DEMAND FOR FINANCIAL INFORMATION
IN SMALL BUSINESS MANAGEMENT.
EMPIRICAL STUDY
Jacek Jaworski
1Abstract
Limited access of small enterprises to reliable and well-prepared information about their condition is mentioned as one of the main barriers to small business development. One of the key types of information used in management is inancial information. It concerns the resources and inancial lows in the enterprise.
The main goal of the paper is to present the results of the questionnaire survey conducted in mid. 2010 among managers of small enterprises in Poland. The survey was used to recognize the usefulness of inancial information in decision-making, to diagnose information needs of entrepreneurs and to identify factors affecting these needs.
JEL Classiication: M19, M21, M49
Keywords: Small business management, Information in decision making, Manager’s information needs
Received: 2.03.2012 Accepted: 31.08.2012
Introduction
Small enterprises create one of the key sectors of modern economy. For example, it produced 32.6% of Polish GDP, employed 51.9% of all employees and comprised 98.87% of active compa-nies in Poland in 2009 (Brusa and Tarnawa, 2011).
Limited access of managers of small companies to reliable and properly prepared information is one of the most frequently mentioned barriers to the small business development. The lack of proper information causes mistakes in management, which are the main reasons for business failures. Especially, it concerns inancial information describing in cash the key processes and business objectives of companies.
This article aims to present the results of empirical research. The goal of this research was to di-agnose demand for inancial information in small business management and the factors forming them. In the latter respect, taking into account conditions of functioning modern companies, it was decided to test the hypothesis saying that mentioned needs depend mainly on: size of a company, nature of its business, life cycle phase in which the company is and managers’ education.
Financial information and its role in enterprise management
The research of Trindade (in: Ganzhorn, and Faustoferri, 1990) led to two speciic conclu-sions about information determinants of small business activities. First – the success of small enterprises increasingly depends on reliable and timely information about market situation and internal situation of the enterprise. But secondly – a typical situation in a small enterprise is the lack of analysts and information processing tools. It also concerns the inancial information. Content and subject of inancial information concern different types of corporate inancial low. Such information conveys messages about formation of all economic phenomena related to corporate inance. It includes messages about the direction, value and strength of inancial lows and decisions on their changes. This paper attempts to explain the role of inancial information in small business management as a one of resources used by entrepreneurs.
In the classiication of inancial information, multiple criteria can be used. Taking into account the usefulness of this information in management, the key criteria will be period for which decisions are taken and scope of these decisions. During the identiication of inancial infor-mation, inancial goals also play a crucial role. According to a widely accepted opinion (Ross, Westerield, Jordan, 1999) the main long-term inancial goal is to maximize a company’s value. In this context, information about the current and projected value of a company appears to be signiicant information for term management. This value primarily derives from the long-term inancial performance and the relationship between assets and capitals of an enterprise. Therefore, relevant information in long-term management also concerns:
1. proitability of investments in ixed assets,
2. shape of the company’s inancial structure (the company’s debt), 3. cost of the capital used in assets inancing,
4. company’s inancial condition in relation to its competitors and business sector, 5. expected inancial results of the planned long-term activities.
In the short term, the company usually seeks to achieve a satisfactory proit (Ross, Westerield, Jordan, 1999). In this respect, in particular, decisions taken by the company should be aided by information about:
1. ability to generate proits (proitability), 2. shaping the current and future revenue, 3. incurred and planned costs.
In addition to proit maximization, decisions in short-term management should also include a second important task, namely, the maintenance of liquidity. It is a very important task, because the loss of liquidity is the main cause of bankruptcy of today’s companies. Direct information about the current and expected liquidity should also be accompanied by:
1. information about the demand for cash in the short term,
2. information about the eficiency and effectiveness of management of current assets and liabilities.
The determinants of the demand for inancial information:
a literature overview
Table 1: Studies on Manager’s Information Needs in Small Business Management
Author Research description Research results Conclusions
Luoma
(1967) A questionnaire survey among 62 small pro-duction enterprises in the USA
86 % of enterprises point that they need various types of inancial in-formation during decision making
Financial information is necessary for decision making process in the SME sector
Proctor and Canada (1992)
A questionnaire survey among 928 small enter-prises in Australia
The most expected tools for pro-cessing inancial information are: cash low estimate (20.6%), budget of expenses (18.1%), revenue bud-get (17%) and break-even point analysis (12.3%)
Financial information expected by managers is very diversiied and it concerns in varying degrees many inancial categories
Pell and Wilson (1996)
An analysis of methods used in working capi-tal management in 123 small companies in the UK
The working capital management was mainly based on review of bad debts (38%), forecasts of demand for cash (36%), customers’ credit rating (24%) and control of inven-tory levels (14%)
Less than 40% of small businesses use veriied methods of information support of working capi-tal management.
Block
(1997) An analysis of meth-ods used in investment management in 238 small enterprises in the USA
42 % of managers estimated pay-back period, 22 % - rate of return, 16 % internal return rate and only 11 % - NPV, 7 % took decisions in-tuitively
Less than 30% of small businesses use veriied methods of information support of investment management
Source: Own elaboration
The outlined studies lead to two main conclusions:
1. managers of small enterprises are increasingly aware the role of inancial information in making economic decisions,
2. but they do not use veriied methods of information support managing process.
Among the Polish studies two items deserve attention: the research of Nogalski and Karpacz (2011) and the survey of Polish Accountants’ Association (Pielaszek, 2008). The irst research revealed that accounting records and reports are important sources of information used in small business management. 20.0% of surveyed manufacturing and 13.4% of commercial and service companies assessed them as very often used. Only information derived from daily newspapers (36.0/34.6%), Internet (31.4/29.2%) and the professional literature (23.0/19.1%) were more important in decision-making for surveyed enterprises.
Between 2004-2006 Polish Accountants’ Association carried out three independent surveys about desirable changes in accounting for SMEs. The irst survey concerned entrepreneurs (268 companies), the second was aimed at auditors (75 questionnaires). The third was conducted among the 10 leasing companies as potential external recipients of inancial information. 86% of the surveyed companies indicated the need to focus small business accounting on pro-viding management information. 26% of auditors and 30% of leasing companies have the same opinion. The study also found the information awaited by entrepreneurs such as:
3. plans (budgets) - 41.84% of responses, 4. customer proitability - 41.13% of responses, 5. cash low - 31.21% of responses.
Diagnosing the factors inluencing the demand for information is a very important element understanding the information needs. The management process, or rather its quality, quickness, effectiveness and eficiency depend on the circumstances in which an enterprise operates. It concerns the information aspects, too. The factors, which could shape the demand for informa-tion in the management process, are described by e. g. Kieżun (1998). He divided these factors into two groups: endogenous - resulting from the company’s characteristic and people partici-pating in decision making process and exogenous – deriving from an enterprise’s environment and current market conditions. According to Kieżun opinion, the most important factors from the irst group are:
1. company’s size - the larger an enterprise, the more processes and phenomena. Therefore it can be expected that managers of larger irms will report a greater demand for more detailed information,
2. type of business activity - the nature of the core business undoubtedly determines the signiicance of different kinds of information according to processes and activities inside an enterprise,
3. phase of the life cycle in which a company is - managers will be interested in other types of information depending on the economic situation which is characterized by the life cycle phase in which a company is,
4. manager’s education – decision-making is a process that must be learned. The higher and more educated manager (especially business proiled) the greater awareness of this process and the wider, more detailed information needs.
The above comments also apply to the widely understood inancial information (Jaworski, 2011). The empirical research of factors forming managers’ information needs in the small-business sector was begun by Holmes, Kelly, and Cunningham (1991). They identiied four main factors using the logit analysis based on a survey among 900 small Australian enterprises:
1. size of an enterprise - the larger enterprise, the larger the demand for information, 2. age of an enterprise - older companies report the demand for more detailed information
but also more standardized than the star-ups,
3. nature of an activity - the more homogenous activity, the smaller managers’ information needs,
4. education of managers - the more educated owner, the larger demand for information. Another researcher (Lybaert, 1996), using the regression analysis of the survey carried out among 208 Belgian small enterprises, successfully veriied three hypotheses:
1. better informed companies achieve better average results, and vice versa, companies that achieve better results report a larger demand for information,
2. information needs are determined by managers’ awareness, their education, professional experience, focusing on the company’s growth and also by the life-cycle phase which the company goes through,
3. demand for information increases together with the company’s growth, but decreases with its age.
Research methods
Small-sized enterprise according Polish regulations (UoSDG, art. 104 and 105) is deined as the company, whose employment in the past 2 years did not exceed 50 people, and its rev-enue or total assets were less than € 10 000 000. In 2010 there were 1 723.7 thousands active small enterprises in Poland (Brusa and Tarnawa, 2011). For the recognition of their managers’ information needs, the questionnaire survey was conducted among 1008 managers of Polish small enterprises in mid. 2010. The surveyed companies were layer drawn in the proportion resulting from the indicators in the general population (size of the enterprise, nature of activity, geographical distribution etc.) according to report prepared by Brussa and Tarnawa (2011). The selected sample can be regarded as representative.
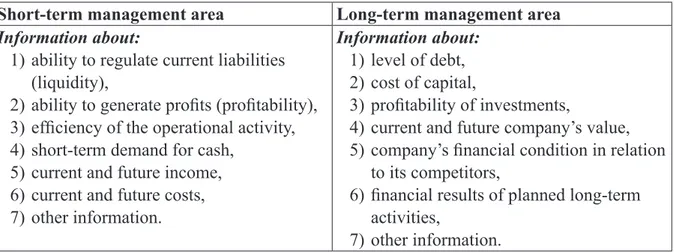
The survey was conducted by “CEM Market & Opinion Research Institute” from Krakow at the request of the author. Researchers used the Computer Assisted Telephone Interview (CATI) method. Entrepreneurs were asked: what inancial information they usually expect to receive before taking short-and long-term decisions. In both areas, the respondents had a choice of 7 types of information listed in Table 2. Description of these information types was placed in previous section of the paper.
Table 2: The List of Financial Information Types Used in the Survey
Short-term management area Long-term management area
Information about:
1) ability to regulate current liabilities (liquidity),
2) ability to generate proits (proitability), 3) eficiency of the operational activity, 4) short-term demand for cash,
5) current and future income, 6) current and future costs, 7) other information.
Information about:
1) level of debt, 2) cost of capital,
3) proitability of investments,
4) current and future company’s value, 5) company’s inancial condition in relation
to its competitors,
6) inancial results of planned long-term activities,
7) other information.
Source : Own elaboration
The entrepreneurs assessed the importance of the chosen type of inancial information in deci-sion making using a 1-5 scale. The evaluation could concern any amount of information with the possibility of multiple uses of the same assessments. The used scale had to characterize the subjective view of the entrepreneur (the information is: 1 - the least important, 5 – the most im-portant). This numerical weighting facilitates the use of statistical measures for the assessment of the distribution of responses.
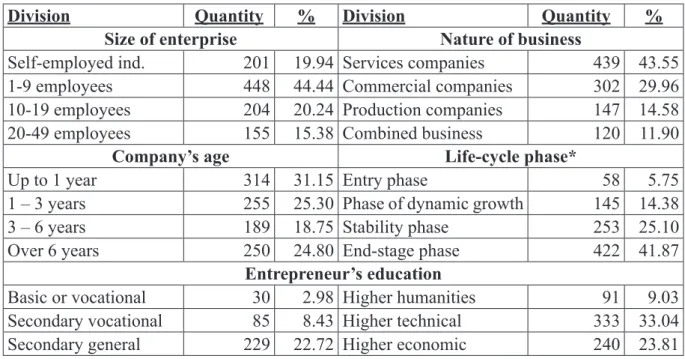
Table 3: Structure of surveyed entrepreneurs
Division Quantity % Division Quantity %
Size of enterprise Nature of business
Self-employed ind. 201 19.94 Services companies 439 43.55
1-9 employees 448 44.44 Commercial companies 302 29.96
10-19 employees 204 20.24 Production companies 147 14.58
20-49 employees 155 15.38 Combined business 120 11.90
Company’s age Life-cycle phase*
Up to 1 year 314 31.15 Entry phase 58 5.75
1 – 3 years 255 25.30 Phase of dynamic growth 145 14.38
3 – 6 years 189 18.75 Stability phase 253 25.10
Over 6 years 250 24.80 End-stage phase 422 41.87
Entrepreneur’s education
Basic or vocational 30 2.98 Higher humanities 91 9.03
Secondary vocational 85 8.43 Higher technical 333 33.04
Secondary general 229 22.72 Higher economic 240 23.81
*- life-cycle phase was based on the answers to questions about changes in income, proits and investment needs in the enterprise (More: Jaworski, 2012).
Source: Own elaboration
To examine the relationship between the diagnosed information needs and the above factors, the Chi-square test of independence was used. The mathematical aspect of this test is reduced to calculate the following statistics (More: Aczel and Sounderpardian, 2009):
n n
n n
n n
k
i l
j ij k
i l
j
ij ij
ij ij
− =
=∑ ∑ ∑ ∑
−
= =
= = 1 1 ^
2
1 1 ^ 2
2
^
χ
where:
l, k – kinds of irst and second variables (the entrepreneurs’ score for each kind of information and assumed factor),
- empirical numbers of the simultaneous occurrence of pairs of variables i and j, - expected numbers of the simultaneous occurrence of pairs of variables i and j, - number of all answers.
The calculated statistics is compared with the critical value of the chi-square distribution. The critical value is read out from the statistical tables for the speciic degree of freedom ((k-1)*(l-1)) and also the signiicance level (probability of rejecting a true hypothesis). In the research signif-icance level was set on 0.05. It means that the test result was established with 95% of certainly. If empirical statistic is less or equal to the read value, then there is no reason to reject the hy-pothesis about the independence of the variables. Otherwise, there are reasons for the accep-tance the alternative hypothesis that the variables are interdependent.
coeficients are presented in Table 4. The values of both coeficients are in the range of 0 - 1. The correlation between the examined variables is stronger when the coeficients’ values are higher.
Table 4: T-Czuprow and C-Pearson contingency coeficient
T-Czuprow C-Pearson
( 1) ( )1
2
− × − × =
l k n
T χ
n C
+ =
χ χ
2 2
Source: Own elaboration based on: Aczel and Soundepardian, 2009
The structure analysis based on the central tendency measures (arithmetic average, median and mode) was used for the evaluation of the survey results. All calculations were carried out in a spreadsheet EXELL. The analysis results are presented using graphical method (graphs) supplemented by written descriptions.
Research Results
Diagram 1 presents global results of the entrepreneurs’ answers about information needs in short-term decision making.
Diagram 1: Assessment of information types expected in short-term decision making
Financial Internet Quarterly „e-Finanse” 2012, vol. 8, nr 3
www.e-finanse.com
University of Information Technology and Management Sucharskiego 2,
35-225 Rzeszów
17 The calculated statistics is compared with the critical value of the chi-square distribution. The critical value is read out from the statistical tables for the specific degree of freedom ((k-1)*(l-1)) and also the significance level (probability of rejecting a true hypothesis). In the research significance level was set on 0.05. It means that the test result was established with 95% of certainly.
If empirical statistic is less or equal to the read value, then there is no reason to reject the hypothesis about the independence of the variables. Otherwise, there are reasons for the acceptance the alternative hypothesis that the variables are interdependent.
To determine the strength of the diagnosed correlations, T-Czuprow and C-Pearson contingency coefficients were used (More: Aczel and Sounderpardian, 2009). Mathematical definitions of these coefficients are presented in Table 4. The values of both coefficients are in the range of 0 - 1. The correlation between the examined variables is stronger when the
coefficients’ values are higher.
Table 4: T-Czuprow and C-Pearson contingency coefficients
T-Czuprow C-Pearson
1 1
2
l k n T
n
C 2
2
Source: Own elaboration based on: Aczel and Soundepardian, 2009
The structure analysis based on the central tendency measures (arithmetic average, median and mode) was used for the evaluation of the survey results. All calculations were carried out in a spreadsheet EXELL. The analysis results are presented using graphical method (graphs) supplemented by written descriptions.
Research Results
Diagram 1 presents global results of the entrepreneurs’ answers about information needs in short-term decision making.
Diagram 1: Assessment of information types expected in short-term decision making
Source: Own elaboration
4,
27
71
4,
00
89
3,
92
13
3,
54
71 4,04
48
4,
10
23
3,
42
16
3,00 3,20 3,40 3,60 3,80 4,00 4,20 4,40 4,60 4,80 5,00
Li
qu
id
ity
Pr
of
ita
bi
lit
y
Ef
fic
ie
nc
y
of
th
e
ac
tiv
ity
Sh
or
t-t
er
m
d
em
an
t
fo
r c
as
h
C
ur
re
nt
a
nd
fu
tu
re
in
co
m
e
C
ur
re
nt
a
nd
fu
tu
re
co
st
s
O
th
er
c
at
eg
or
ie
s
Arithmetic average Median Mode
Measures:
In
fo
rm
at
io
n
ab
ou
t:
Source: Own elaboration
Summing up the results for the short-term management, very high average scores for most types of information (above 4.0) should be noted. It means that small business managers attach great importance to short-term decision, and it causes their high information needs in this area. Ratings for the long-term management are a bit lower (Diagram 2).
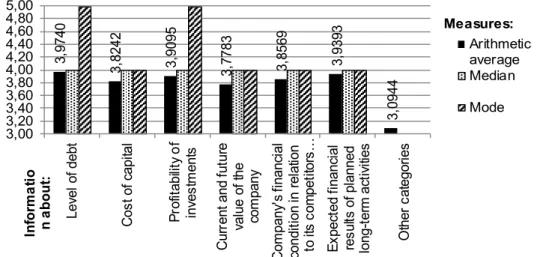
Diagram 2: Assessment of information types expected in long-term decision making
Financial Internet Quarterly „e-Finanse” 2012, vol. 8, nr 3
www.e-finanse.com
University of Information Technology and Management Sucharskiego 2,
35-225 Rzeszów
18 In everybody’s opinion, the most important is information about liquidity. Its importance was most frequently evaluated by entrepreneurs to 5.0. The same level noted for median, arithmetic average is 4.2771. The information about current and future costs obtained not much lower average score (4.1023). However, in this case half of the ratings were less than 4.0. The information about current and future income was found as almost equally important (4.0448). The ratio of profitability is also significant (4.0089) for the surveyed managers. Information about efficiency is less important (3.9213). The latter type of information was most often assessed at 4.0. The information about future demand for cash is the least important (3.5471). The same concerns other types of financial information (3.4216).
Summing up the results for the short-term management, very high average scores for most types of information (above 4.0) should be noted. It means that small business managers attach great importance to short-term decision, and it causes their high information needs in this area. Ratings for the long-term management are a bit lower (Diagram 2).
Diagram 2: Assessment of information types expected in long-term decision making
Source: Own elaboration
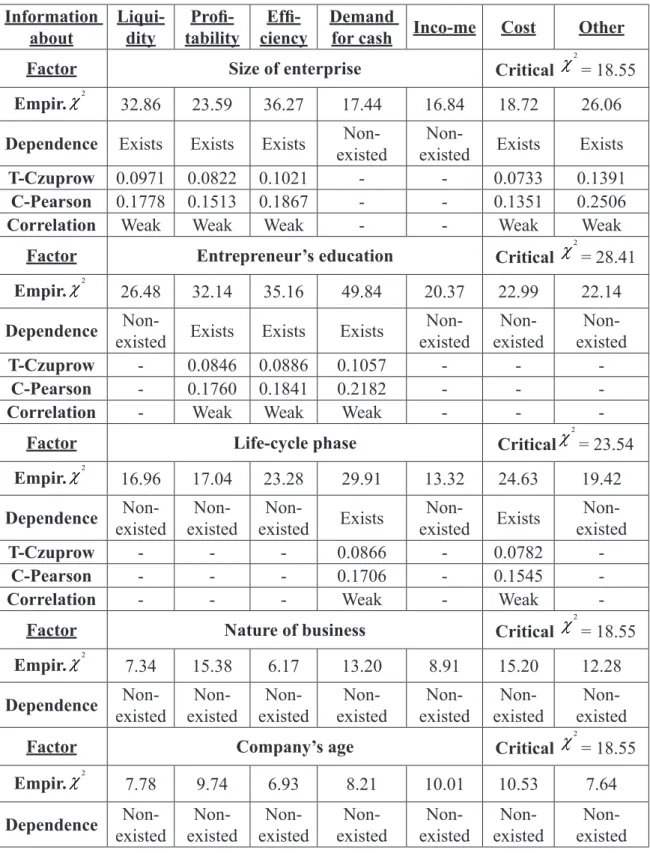
The information about the level of debt and about profitability of investments has mostly obtained the highest scores (5.0). The average assessment is 3.9740 and 3.9095, respectively. The information about financial effects of the planned long-term activities received very high average scores (3.9393), too. Median and mode 4.0 mean that the entrepreneurs assessed this area of information as very stable and equally relevant. The information about the company’s financial condition (3.8569) and about cost of capital (3.8242) was rated similarly, but slightly lower. Other financial information obtained the lowest scores (3.0944; mode and median 3.0). Table 5 presents calculations of the Chi-square statistic and the contingency coefficient for selected factors in a short-term management area. The presented calculations show that the entrepreneurs’ information needs depend mainly on the size of the enterprise (information about: liquidity, profitability, efficiency, costs and other financial categories). To some extent
they are affected by managers’ education (information about: profitability, efficiency and
demand for cash). The weakest dependence can be observed for the life-cycle phase of the company (information about: demand for cash and about cost levels). For the rest selected
3,
97
40
3,
82
42
3,
90
95
3,
77
83
3,
85
69
3,
93
93
3,
09
44
3,00 3,20 3,40 3,60 3,80 4,00 4,20 4,40 4,60 4,80 5,00
Le
ve
l o
f d
eb
t
C
os
t o
f c
ap
ita
l
Pr
of
ita
bi
lit
y
of
in
ve
st
m
en
ts
C
ur
re
nt
a
nd
fu
tu
re
va
lu
e
of
th
e
co
m
pa
ny
C
om
pa
ny
's
fi
na
nc
ia
l
co
nd
iti
on
in
re
la
tio
n
to
it
s
co
m
pe
tit
or
s…
Ex
pe
ct
ed
fi
na
nc
ia
l
re
su
lts
o
f p
la
nn
ed
lo
ng
-te
rm
a
ct
ivi
tie
s
O
th
er
c
at
eg
or
ie
s
Arithmetic average Median Mode
Measures:
In
fo
rm
at
io
n
ab
ou
t:
Source: Own elaboration
Table 5: Relationships between entrepreneur’s information needs and assumed factors in short-term management
Information
about Liqui-dity tabilityProi- ciencyEfi- Demand for cash Inco-me Cost Other
Factor Size of enterprise Critical χ2= 18.55
Empir.χ2 32.86 23.59 36.27 17.44 16.84 18.72 26.06
Dependence Exists Exists Exists existedNon- existedNon- Exists Exists
T-Czuprow 0.0971 0.0822 0.1021 - - 0.0733 0.1391
C-Pearson 0.1778 0.1513 0.1867 - - 0.1351 0.2506
Correlation Weak Weak Weak - - Weak Weak
Factor Entrepreneur’s education Critical χ2= 28.41
Empir.χ2 26.48 32.14 35.16 49.84 20.37 22.99 22.14
Dependence existedNon- Exists Exists Exists existedNon- existedNon- existed
Non-T-Czuprow - 0.0846 0.0886 0.1057 - -
-C-Pearson - 0.1760 0.1841 0.2182 - -
-Correlation - Weak Weak Weak - -
-Factor Life-cycle phase Criticalχ2= 23.54
Empir.χ2 16.96 17.04 23.28 29.91 13.32 24.63 19.42
Dependence existedNon- existedNon- existedNon- Exists existedNon- Exists existed
Non-T-Czuprow - - - 0.0866 - 0.0782
-C-Pearson - - - 0.1706 - 0.1545
-Correlation - - - Weak - Weak
-Factor Nature of business Critical χ2= 18.55
Empir.χ2 7.34 15.38 6.17 13.20 8.91 15.20 12.28
Dependence existedNon- existedNon- existedNon- existedNon- existedNon- existedNon- existed
Non-Factor Company’s age Critical χ2= 18.55
Empir.χ2
7.78 9.74 6.93 8.21 10.01 10.53 7.64
Dependence existedNon- existedNon- existedNon- existedNon- existedNon- existedNon- existed
19 Financial Internet Quarterly „e-Finanse” 2012, vol. 8, nr 3
www.e-inanse.com
University of Information Technology and Management Sucharskiego 2,
35-225 Rzeszów
The research clearly shows that the larger enterprise the more attention is paid to all types of information (Diagram 3). Differences in the assessment range are from 4 % in the case of infor-mation about the demand for cash to 10 % for inforinfor-mation about liquidity.
Diagram 3: Distribution of assessment of information in short-term management according to size of enterprise
Financial Internet Quarterly „e-Finanse” 2012, vol. 8, nr 3
www.e-finanse.com
University of Information Technology and Management Sucharskiego 2,
35-225 Rzeszów
20
Empir.2
7.78 9.74 6.93 8.21 10.01 10.53 7.64
Dependence existe
Non-d
Non-existed existed Non- existed Non- existed Non- existed Non- existed
Non-Source: Own elaboration
The research clearly shows that the larger enterprise the more attention is paid to all types of information (Diagram 3). Differences in the assessment range are from 4 % in the case of information about the demand for cash to 10 % for information about liquidity.
Diagram 3: Distribution of assessment of information in short-term management according to size of enterprise
Source: Own elaboration
The distribution of assessments depending on the entrepreneurs’ education is more diverse
(Diagram 4). The highest rating for all dependent information is provided by entrepreneurs with higher economic education, while the lowest one by managers with higher technical education. Relatively high ratings are also issued by entrepreneurs with basic and vocational education. From the three presented types of information the information about profitability
(3.6296 – 4.2042) is the most important and the information about the demand for cash
(3.2319 – 3.8033) is the least important.
4. 08 00 3. 84 42 3. 77 27 3. 96 48 3. 25 71 4. 29 46 4. 02 45 3. 95 76 4. 09 35 3. 38 15 4. 30 39 4. 04 41 3. 96 57 4. 14 71 3. 46 15 4. 44 52 4. 12 90 3. 94
81 4.24
52 3. 64 71 3.00 3.20 3.40 3.60 3.80 4.00 4.20 4.40 4.60 4.80 Li qu id ity P ro fit ab ilit y E ff ic ie nc y of th e ac tiv ity C ur re nt a nd fu tu re co st s O th er c at eg or ie s Self-employed ind. Employing 1-9 workers Employing 10-19 workers Employing 20-49 workers Enterprises: In fo rm at io n ab ou t:
Source: Own elaboration
The distribution of assessments depending on the entrepreneurs’ education is more diverse (Diagram 4). The highest rating for all dependent information is provided by entrepreneurs with higher economic education, while the lowest one by managers with higher technical education. Relatively high ratings are also issued by entrepreneurs with basic and vocational education. From the three presented types of information the information about proitability (3.6296 – 4.2042) is the most important and the information about the demand for cash (3.2319 – 3.8033) is the least important.
Diagram 4: Distribution of assessment of information in short-term management according to manager’s education
21
Diagram 4: Distribution of assessment of information in short-term management according to manager’s education
Source: Own elaboration
The life-cycle phase of the company affects the information needs only in two areas (Diagram 5). For all companies the information about the level of costs is more important. This is particularly true for companies in the entry and growth phases. In the stability and end-stage phases, the entrepreneurs are especially interested in the demand for cash.
Diagram 5: Distribution of assessment of information in short-term management according to life-cycle phase
Source: Own elaboration
Table 6 presents calculations of the Chi-square statistic and contingency coefficient for
selected factors in long-term management. The entrepreneurs’ information needs, as for the
short-term, depend on the size of the enterprise (information about: level of debt, cost of capital, profitability of investments, value of company, expected results of long-term activities and about other categories), education of the manager (information about: level of debt, cost of capital, value of company, financial condition and expected results of long-term activities) and the life-cycle phase of the company (information about: the value of a company and expected results of long-term activities). In addition, the correlation for the nature of business is diagnosed. It concerns information about: level of debt and about financial condition in
relation to company’s competitors and sector.
3. 62 96 4. 08 00 3. 76 92 4. 08 24 4. 01 18 3. 70 59 3. 91 74 3. 96 93 3. 64 00 4. 08 79 3. 94 51 3. 57 78 3. 92 47 3. 77 78 3. 23 19 4. 20 42 4. 01 67 3. 80 33 3.00 3.20 3.40 3.60 3.80 4.00 4.20 4.40 4.60 Pr of ita bil ity Ef fic ien cy of th e ac tiv ity De m an d fo r C as h Basic or vocational Secondary general Secondary vocational Higher humanities Higher technical Higher economic Education: In fo rm at io n ab ou t: 3,2 06 9 4,2 75 9 3,3 83 0 4,2 13 8 3,5 67
6 3,944
4 3,5 63 5 4,0 92 4 3,00 3,20 3,40 3,60 3,80 4,00 4,20 4,40 4,60 De ma nd fo r C as h Cu rre nt an d f utu re co sts Entry Growth Stability End-stage Life-cycle phase: Inf orm ati on ab ou t:
The life-cycle phase of the company affects the information needs only in two areas (Diagram 5). For all companies the information about the level of costs is more important. This is particu-larly true for companies in the entry and growth phases. In the stability and end-stage phases, the entrepreneurs are especially interested in the demand for cash.
Diagram 5: Distribution of assessment of information in short-term management according to life-cycle phase
Financial Internet Quarterly „e-Finanse” 2012, vol. 8, nr 3
www.e-finanse.com
University of Information Technology and Management Sucharskiego 2,
35-225 Rzeszów
21
Diagram 4: Distribution of assessment of information in short-term management according to manager’s education
Source: Own elaboration
The life-cycle phase of the company affects the information needs only in two areas (Diagram 5). For all companies the information about the level of costs is more important. This is particularly true for companies in the entry and growth phases. In the stability and end-stage phases, the entrepreneurs are especially interested in the demand for cash.
Diagram 5: Distribution of assessment of information in short-term management according to life-cycle phase
Source: Own elaboration
Table 6 presents calculations of the Chi-square statistic and contingency coefficient for
selected factors in long-term management. The entrepreneurs’ information needs, as for the
short-term, depend on the size of the enterprise (information about: level of debt, cost of capital, profitability of investments, value of company, expected results of long-term activities and about other categories), education of the manager (information about: level of debt, cost of capital, value of company, financial condition and expected results of long-term activities) and the life-cycle phase of the company (information about: the value of a company and expected results of long-term activities). In addition, the correlation for the nature of business is diagnosed. It concerns information about: level of debt and about financial condition in
relation to company’s competitors and sector.
3.
62
96
4.
08
00
3.
76
92
4.
08
24
4.
01
18
3.
70
59
3.
91
74
3.
96
93
3.
64
00
4.
08
79
3.
94
51
3.
57
78
3.
92
47
3.
77
78
3.
23
19
4.
20
42
4.
01
67
3.
80
33
3.00 3.20 3.40 3.60 3.80 4.00 4.20 4.40 4.60
Pr
of
ita
bil
ity
Ef
fic
ien
cy
of
th
e
ac
tiv
ity
De
m
an
d
fo
r C
as
h
Basic or vocational Secondary general Secondary vocational Higher humanities Higher technical Higher
economic Education:
In
fo
rm
at
io
n
ab
ou
t:
3,2
06
9
4,2
75
9
3,3
83
0
4,2
13
8
3,5
67
6 3,944
4
3,5
63
5 4,0
92
4
3,00 3,20 3,40 3,60 3,80 4,00 4,20 4,40 4,60
De
ma
nd
fo
r C
as
h
Cu
rre
nt
an
d f
utu
re
co
sts
Entry
Growth
Stability
End-stage Life-cycle phase:
Inf
orm
ati
on
ab
ou
t:
Source: Own elaboration
Table 6 presents calculations of the Chi-square statistic and contingency coeficient for selected factors in long-term management. The entrepreneurs’ information needs, as for the short-term, depend on the size of the enterprise (information about: level of debt, cost of capital, proitability of investments, value of company, expected results of long-term activities and about other catego-ries), education of the manager (information about: level of debt, cost of capital, value of com-pany, inancial condition and expected results of long-term activities) and the life-cycle phase of the company (information about: the value of a company and expected results of long-term activi-ties). In addition, the correlation for the nature of business is diagnosed. It concerns information about: level of debt and about inancial condition in relation to company’s competitors and sector. The assessment of information in the long-term management conirms the trend that the larger size of an enterprise determines larger information needs of its manager (Diagram 6). Differ-ences in ratings range from 4.7 % (information about the proitability of investments) to 8.7 % (information about the level of debt). The information about the level of debt is the most impor-tant for the largest enterprises. For the smallest one: about proitability of investment.
For the entrepreneurs with higher education, information about the expected results of long-term activities is the most important. The information about the inancial condition is the most signiicant for the managers with lower education (Diagram 7). The assessments of the other types of information are more diversiied. However, the less demand for information is shown for the entrepreneurs with vocational (technical) education, regardless of the level.
Table 6: Inluence of endogenous factors on entrepreneur’s information needs in long-term management
Information
about Level of debt Cost of capital
Prof. of
invest-ments
Value of company
Finan-cial condition
Expec-ted
results Other
Factor Size of enterprise Critical χ2= 18.55
Empir.χ2 30.62 27.39 26.33 22.75 16.15 22.07 22.55
Dependence Exists Exists Exists Exists existedNon- Exists Exists
T-Czuprow 0.0940 0.0886 0.0869 0.0808 - 0.0796 0.1386
C-Pearson 0.1723 0.1627 0.1597 0.1487 - 0.1466 0.2497
Correlation Weak Weak Weak Weak - Weak Weak
Factor Entrepreneur’s education Critical χ2= 28.41
Empir.χ2
41.83 52.24 18.16 46.42 37.90 49.97 24.84
Dependence Exists Exists existedNon- Exists Exists Exists existed
Non-T-Czuprow 0.0968 0.1078 - 0.1017 0.0919 0.1055
-C-Pearson 0.2005 0.2223 - 0.2102 0.1907 0.2178
-Correlation Weak Weak - Weak Weak Weak
-Factor Life-cycle phase Critical χ2= 23.54
Empir.χ2 14.03 21.35 23.46 31.70 21.22 26.49 13.02
Dependence existedNon- existedNon- existedNon- Exists existedNon- Exists existed
Non-T-Czuprow - - - 0.0888 - 0.0812
-C-Pearson - - - 0.1748 - 0.1603
-Correlation - - - Weak - Weak
-Factor Nature of business Critical χ2= 18.55
Empir.χ2 26.90 9.18 10.32 15.48 20.50 9.81 9.97
Dependence Exists existedNon- existedNon- existedNon- Exists existedNon- existed
Non-T-Czuprow 0.0881 - - - 0.0767 -
-C-Pearson 0.1618 - - - 0.1413 -
-Correlation Weak - - - Weak -
-Factor Company’s age Critical χ2= 18.55
Empir.χ2 11.57 13.75 16.43 9.17 11.61 8.80 5.7
Dependence existedNon- existedNon- existedNon- existedNon- existedNon- existedNon- existed
22 Financial Internet Quarterly „e-Finanse” 2012, vol. 8, nr 3
www.e-inanse.com
University of Information Technology and Management Sucharskiego 2,
35-225 Rzeszów
Diagram 6: Distribution of entrepreneurs’ assessment of information in long-term management according to size of enterprise
Financial Internet Quarterly „e-Finanse” 2012, vol. 8, nr 3
www.e-finanse.com
University of Information Technology and Management Sucharskiego 2,
35-225 Rzeszów
23
existed existed existed existed existed existed existed
Source: Own elaboration
The assessment of information in the long-term management confirms the trend that the larger size of an enterprise determines larger information needs of its manager (Diagram 6). Differences in ratings range from 4.7 % (information about the profitability of investments) to 8.7 % (information about the level of debt). The information about the level of debt is the most important for the largest enterprises. For the smallest one: about profitability of investment.
For the entrepreneurs with higher education, information about the expected results of long-term activities is the most important. The information about the financial condition is the most significant for the managers with lower education (Diagram 7). The assessments of the other types of information are more diversified. However, the less demand for information is shown for the entrepreneurs with vocational (technical) education, regardless of the level.
Diagram 8 shows that the importance of information about the company's value increases with the phase of the life cycle. For information about the results of long-term activities, the situation is reversed. The demand for both kinds of information is very similar for the companies in growth and stability phases of the life-cycle.
Diagram 6: Distribution of entrepreneurs’ assessment of information in long-term management according to size of enterprise
Source: Own elaboration
3,
79
00
3,
62
00 3,8700
3, 55 50 3, 69 50 2, 91 67 4, 00 45 3, 80 62 3, 83 48 3, 79
42 3,9799
3, 08 07 3, 97 52 3, 91 13 4, 00 49 3, 85
78 4,0294
3, 11 11 4, 12 42 4, 02 58 4, 05 16 3, 91 61 4, 01 96 3, 30 91 2,80 3,00 3,20 3,40 3,60 3,80 4,00 4,20 4,40 Le ve l o f d eb t Co st of ca pit al Pr ofi ta bil ity o f inv es tm en s Va lue o f c om pa ny Ex pe cte d r es ult s o f lon g-te rm ac tiv itie s Ot he r c ate go rie s Self-employed ind. Employing 1-9 workers Employing 10-19 workers Employing 20-49 workers Enterprises: In fo rm at io n ab ou t:
Source: Own elaboration
Diagram 7: Distribution of assessment of information in long-term management according to entrepreneur’s education
Diagram 7: Distribution of assessment of information in long-term management
according to entrepreneur’s education
Source: Own elaboration
Diagram 8: Distribution of assessment of information in long-term management according to life-cycle phase
Source: Own elaboration
Diagram 9: Distribution of entrepreneurs’ assessment of information in long-term management according to nature of business
Source: Own elaboration.
Source: Own elaboration
3,5 92 6 3,5 92 6 3,4 81 5 4,1 85 2 3,7 40 7 4,1 17 6 4,0 23 5 4,1 05 9 3,9 88 2 4,0 82 4 4,0 92 9 3,9 69 6 3,8 87 0 3,9 21 7 3,9 21 1 4,0 00 0 3,9 23 1 3,7 58 2 3,8 79
1 4,263
7 3,7 94 6 3,5 84 3 3,5 34 7 3,6 29 5 3,7 16 9 4,0 92 1 3,9 37 5 3,8 62 5 4,0 12 6 4,1 12 5 3,00 3,20 3,40 3,60 3,80 4,00 4,20 4,40 4,60 Le ve l o f d eb t Co st of ca pit al Va lue of co mp an y Fin an cia l c on dit ion in rel ati on to co mp eti tor s an d s ec tor Ex pe cte d r es ult s o f lon g-t erm ac tiv itie s Basic or vocational Secondary general Secondary vocational Higher humanities Higher technical Higher economic Education: Inf or ma tio n ab ou t: 3, 46 55 4, 18 97 3, 62 76 3, 92 41 3, 67 19 3, 84 92 3, 84 29 3, 87 38 3,00 3,50 4,00 4,50 Va lu e of co m pa ny Ex pe ct ed re su lts o f lo ng -te rm ac tiv iti es Entry Growth Stability End-stage Life-cycle phase: In fo rm at io n ab ou t: 3. 80 92 3. 72 54 4. 06 64 3. 97 68 4. 12 24 3. 90 54 4. 16 10 3. 97 48 3.00 3.20 3.40 3.60 3.80 4.00 4.20 4.40 4.60 Le ve l o f d eb t Fi na nc ia l co nd iti on in re la tio n to co m pe tit or s a nd se ct or Service Trade Production Mixed
Nature of business:
In fo rm at io n ab ou t:
Source: Own elaboration
Diagram 8: Distribution of assessment of information in long-term management according to life-cycle phase
24
Diagram 7: Distribution of assessment of information in long-term management
according to entrepreneur’s education
Source: Own elaboration
Diagram 8: Distribution of assessment of information in long-term management according to life-cycle phase
Source: Own elaboration
Diagram 9: Distribution of entrepreneurs’ assessment of information in long-term management according to nature of business
Source: Own elaboration.
Source: Own elaboration
3,5 92 6 3,5 92 6 3,4 81 5 4,1 85 2 3,7 40 7 4,1 17 6 4,0 23 5 4,1 05 9 3,9 88 2 4,0 82 4 4,0 92 9 3,9 69 6 3,8 87 0 3,9 21 7 3,9 21 1 4,0 00 0 3,9 23 1 3,7 58 2 3,8 79
1 4,263
7 3,7 94 6 3,5 84 3 3,5 34 7 3,6 29 5 3,7 16 9 4,0 92 1 3,9 37 5 3,8 62 5 4,0 12 6 4,1 12 5 3,00 3,20 3,40 3,60 3,80 4,00 4,20 4,40 4,60 Le ve l o f d eb t Co st of ca pit al Va lue of co mp an y Fin an cia l c on dit ion in rel ati on to co mp eti tor s an d s ec tor Ex pe cte d r es ult s o f lon g-t erm ac tiv itie s Basic or vocational Secondary general Secondary vocational Higher humanities Higher technical Higher economic Education: Inf or ma tio n ab ou t: 3, 46 55 4, 18 97 3, 62 76 3, 92 41 3, 67 19 3, 84 92 3, 84 29 3, 87 38 3,00 3,50 4,00 4,50 Va lu e of co m pa ny Ex pe ct ed re su lts o f lo ng -te rm ac tiv iti es Entry Growth Stability End-stage Life-cycle phase: In fo rm at io n ab ou t: 3. 80 92 3. 72 54 4. 06 64 3. 97 68 4. 12 24 3. 90 54 4. 16 10 3. 97 48 3.00 3.20 3.40 3.60 3.80 4.00 4.20 4.40 4.60 Le ve l o f d eb t Fi na nc ia l co nd iti on in re la tio n to co m pe tit or s a nd se ct or Service Trade Production Mixed
Nature of business:
In fo rm at io n ab ou t:
Diagram 9: Distribution of entrepreneurs’ assessment of information in long-term management according to nature of business
Financial Internet Quarterly „e-Finanse” 2012, vol. 8, nr 3
www.e-finanse.com
University of Information Technology and Management Sucharskiego 2,
35-225 Rzeszów
24
Diagram 7: Distribution of assessment of information in long-term management
according to entrepreneur’s education
Source: Own elaboration
Diagram 8: Distribution of assessment of information in long-term management according to life-cycle phase
Source: Own elaboration
Diagram 9: Distribution of entrepreneurs’ assessment of information in long-term management according to nature of business
Source: Own elaboration.
Source: Own elaboration
3,5 92 6 3,5 92 6 3,4 81 5 4,1 85 2 3,7 40 7 4,1 17 6 4,0 23 5 4,1 05 9 3,9 88 2 4,0 82 4 4,0 92 9 3,9 69 6 3,8 87 0 3,9 21 7 3,9 21 1 4,0 00 0 3,9 23 1 3,7 58 2 3,8 79
1 4,263
7 3,7 94 6 3,5 84 3 3,5 34 7 3,6 29 5 3,7 16 9 4,0 92 1 3,9 37 5 3,8 62 5 4,0 12 6 4,1 12 5 3,00 3,20 3,40 3,60 3,80 4,00 4,20 4,40 4,60 Le ve l o f d eb t Co st of ca pit al Va lue of co mp an y Fin an cia l c on dit ion in rel ati on to co mp eti tor s an d s ec tor Ex pe cte d r es ult s o f lon g-t erm ac tiv itie s Basic or vocational Secondary general Secondary vocational Higher humanities Higher technical Higher economic Education: Inf or ma tio n ab ou t: 3, 46 55 4, 18 97 3, 62 76 3, 92 41 3, 67 19 3, 84 92 3, 84 29 3, 87 38 3,00 3,50 4,00 4,50 Va lu e of co m pa ny Ex pe ct ed re su lts o f lo ng -te rm ac tiv iti es Entry Growth Stability End-stage Life-cycle phase: In fo rm at io n ab ou t: 3. 80 92 3. 72 54 4. 06 64 3. 97 68 4. 12 24 3. 90 54 4. 16 10 3. 97 48 3.00 3.20 3.40 3.60 3.80 4.00 4.20 4.40 4.60 Le ve l o f d eb t Fi na nc ia l co nd iti on in re la tio n to co m pe tit or s a nd se ct or Service Trade Production Mixed
Nature of business:
In fo rm at io n ab ou t:
Source: Own elaboration.
The research (Diagram 9) shows that the information about level of debt (4.1610) and about inancial condition in relation to competitors (3.9748) is the most needed by companies leading mixed activities (ca. 4.01 and 3.95). Not much lower level of information needs is reported by production and trading companies. However, this information is deinitely less important for service companies (3.8092 and 3.7254, respectively).
Conclusions
Entrepreneurs assessed the usefulness of inancial information in the short-term management area highly. The scores exceed 4.0 in the ive-point scale. For the long-term management ratings are a bit lower. It means that demand for inancial information is signiicant and conirms the widely recognized notion that small entities are primarily focused on survival in the short term. Information about liquidity is the most important for the managers. It shows that for small companies, the maintenance of liquidity is a key problem in the short time. In this area, the information about current and future costs is the second on the list of entrepreneurs’ priorities. Information about revenues and about the proitability was also assessed as relatively high. It means that in the short term, in addition to the maintenance of liquidity, managers also try to maximize proit.
Information about the level of debt and about the expected inancial results of long-term activi-ties is the most signiicant in the strategic management. Entrepreneurs rated the usefulness of information about cost of capital as relatively low. In their opinion, the information about the inancial condition in relation to the competitors and the business sector is more signiicant. The hypothesis about the relationship between information needs and selected factors was only partially veriied positively. In the short-term management these needs depend on the size of the enterprise, the entrepreneur’s education and the life-cycle phase in which the company is. In addition to these factors, the dependence on the nature of business is diagnosed for long-term management. In all cases of dependence the strength of correlation is weak. The demand for inancial information does not depend on the company’s age.
The presented results of the research are important characteristics of the small enterprise sec-tor in Poland. They describe the information needs reported by their managers and the facsec-tors shaping them on the basis of a representative empirical study. They complement the gap in the management knowledge about information conditions of decision making in small enterprises. The knowledge about the managers’ information needs and the demand for inancial informa-tion in management can be used in the future studies. First direcinforma-tion of them concerns com-parative research of different enterprise sectors, countries and economies. Second is related to assessment of the entrepreneurship’s maturity and the role of inancial information among other classes of information in decision-making. But from the author’s point of view, the most important is third direction of possible studies. Namely, results of this research have also a utilitarian value, especially for accounting practice. Its results may be the basis for a review, construction and adaptation of information systems in small enterprises. Direction of the next research should be an analysis of the correlation between the scope of information provided by currently used accounting systems in the SME sector in Poland and diagnosed information needs of entrepreneurs. It would give the reasons for recommendation of appropriate changes in small business accounting systems to adjust them better to changing internal and external conditions of small enterprise management.
References
Aczel, A. D., Soundepardian, J. (2009). Complete Business Statistics. New York: McGraw-Hill/ Irwin.
Block, S. (1997). Capital Budgeting Techniques Used by Small Business Firms in the 1990s.
The Engineering Economist, 42 (2).
Brusa, A., Tarnawa, A. (2011). Raport o stanie sektora małych i średnich przedsiębiorstw w Polsce 2009-2010 (Report About Condition of Small and Medium Sized Enterprise Sector in Poland
2009-2010). Warszawa: PARP [in Polish].
Chang, C. H., Lee, C. W. J. (1992). Information Acquisition as Business Strategy. Southern
Economic Journal, vol. 58 (3).
Corner, D. C. (1967). Financial Incentive in the Small Business. Social and Economic Admin-istration, no. 5.
Holmes, S., Kelly, G., Cunningham, R. (1991). The Small Firm Information Cycle: a Reap-praisal. International Small Business Journal, vol. 4.
Jaworski, J. (2011). The Use of Financial Information in Small Business Management in Poland. Opinions and Recommendations of Experts. Research Results. In: A. Adamik, S. Lachiewicz (Eds.) Methods and Concepts of Small and Medium-Sized Enterprises Management, Łódź: Technical University of Łódź Press.
Jaworski J. (2012), Informacja inansowa w zarządzaniu małym przedsiębiorstwem. Potrzeby – źródła – wykorzystanie (Financial Information in Small Business Management. Needs –
Sources – Usage), CeDeWu, Warszawa 2012 [in Polish].
Kieżun, W. (1998). Sprawne zarządzanie organizacją (Eficient Management of Organization). Warszawa: SGH [in Polish].
Inlu-Nogalski, B., Karpacz, J. (2011). Identyikacja źródeł informacji wykorzystywanych w prak-tyce zarządzania małymi i średnimi przedsiębiorstwami (Identiication of Informaction Sources Used in Practice of Management of Small and Medium-sized Enterprises. In: S. Lachiewicz, M. Matejun (Eds.) Zarządzanie rozwojem małych i średnich przedsiębiorstw
(Management of Development of Small and Medium-sized Enterprises).Warszawa: Wolters
Kluwer [in Polish].
Peacock, R. W. (1987). The Financial Effects of Business Bankruptcies. Accounting Forum, 10 (3). Pell, M. J., Wilson, N. (1996). Working Capital and Financial Management Practices in the
Small Firm Sector. International Small Business Journal, no. 14 (2).
Pielaszek, M. (2008). Pożądane kierunki zmian w rachunkowości małych i średnich przedsię-biorstw. Wyniki badań ankietowych SKwP w latach 2004-2006 (Desirable Directions of Changes in Accounting for Small and Medium Enterprises. Polish Accountant’s Association Survey in 2004-2006). Zeszyty Teoretyczne Rachunkowości, tom 47 (103) [in Polish]. Proctor, M. D., Canada, J. R. (1992). Past and Present Methods of Manufacturing Investment
Evaluation: A Review of the Empirical and Theoretical Literature. The Engineering
Econo-mist Fall, vol. 38, iss. 1.
Ross, S. A., Westerield, R. W., Jordan, B. D. (1999). Finanse przedsiębiorstwa (Corporate
Fi-nance). Warszawa: Dom Wydawniczy ABC [in Polish].