DENELOPMENTS AND TRENDS IN THE LIFE INSURANCE
MARKET IN ROMANIA
Florina Oana Nirlanuta
Daniela Nechita
Dunarea de Jos University of Galati, Romania
An essential aspect in the life and evolution of man since ancient times was the concern for the future, fear combined with care and wisdom certainly accomplished something. The events of our lives fast moving and often they occur unpredictably. We need to make sure that our family is safe and receiving all the financial support it needs. Evolving from simple function of protection in case of death, life insurance became more complex, and at the moment we can choose one of the following forms of insurance. Life insurance is a form of financial protection of human in case of an accident, illness, disability or death. In this regard we propose an analysis of the life insurance market in Romania.
Keywords: life insurance, insurance density, market insurance
Jel Clasification: G1, G22
1. Introduction
The market represents a coherent ensemble, system or network of relationships of sale between economic agents are, on the one hand, united by ties of interdependence and, on the other hand, the opposition is in relationships, each pursuing his interest. Square signifies the existence of clashes between carriers and demand determines the price by which economic goods that are exchanged. On the insurance market are meeting the demand for insurance, which comes from insured individuals and businesses keen to enter various types of insurance with the insurance, supported by specialized organizations licensed to operate in this area and able, under the financial report to carry out such activity. Insurance application is focused on insurance contracts after confronting her with the offer. Demand for insurance people, property and liability comes from individuals who want to enter into contracts of insurance to protect them, their families and the entities concerned to provide security to their employees in case of accidents or illnesses. Since insurance through a specialist company (insurer) undertakes to cover you in return premiums received from natural and legal persons (as the insured), the negative effects of an event or complex of events, ensuring appears as a means through which the insured can provide shelter from the dangers that threaten them. Insurance operations are conducted within a framework called the insurance market. Findings insurance market situation can be achieved by presenting quantitative indicators that reflect the importance of the insurance sector in the national economy as well as qualitative indicators. Among the indicators that characterize the insurance market are: the number of contracts signed in a certain branch or sub-branch of insurance, the volume of written premiums, the amount of insurance obligations, the amount of indemnities paid.
2. Insurance density
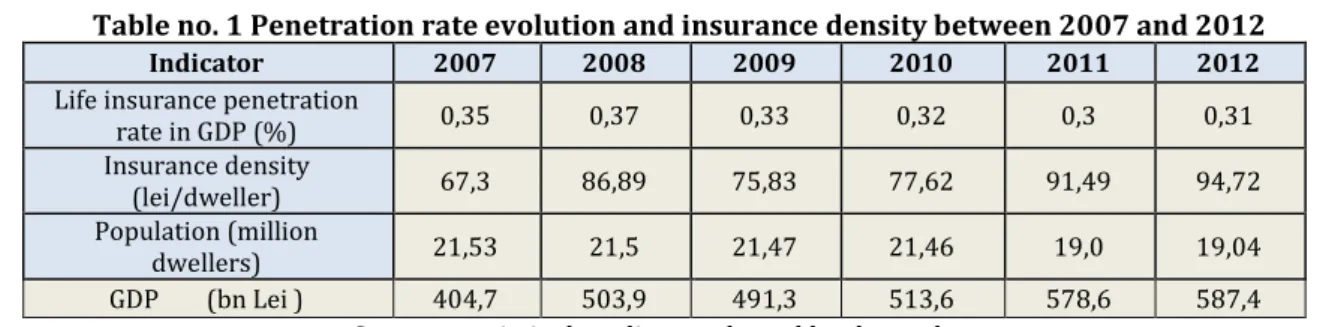
Table no. 1 Penetration rate evolution and insurance density between 2007 and 2012
Indicator 2007 2008 2009 2010 2011 2012
Life insurance penetration
rate in GDP (%) 0,35 0,37 0,33 0,32 0,3 0,31
Insurance density
(lei/dweller) 67,3 86,89 75,83 77,62 91,49 94,72
Population (million
dwellers) 21,53 21,5 21,47 21,46 19,0 19,04
GDP (bn Lei ) 404,7 503,9 491,3 513,6 578,6 587,4
Source: statistical studies conducted by the author
Insurance density, another insurance specific indicatoris calculated as the ratio of gross written premiums to total population. According to the analysis, on 31 December 2012, this indicator showed a value of 94.72 lei/capita, increasing by 3.23 lei/capita compared with 2011 (91.49 lei/capita). Life insurance sector did not succeed to influence the overall improvement of insurance penetration rate in GDP and their density, although a slight increase of gross written premiums was revealed between 2011 and 2012. The low share of life insurance gross written premiums i.e. 22.22%, in the total market underwritings significantly diminishes this sector’s influence upon the above-mentioned indicators.
Gross claims paid
On December 31 2012, the value of gross claims paid by insurance companies that provided general insurance totalled 5.187.981.443lei, increasing by 1.25% compared to the same date of 2011.
Table no. 2. Structure of gross claims paid on two types of insurance
Types of insurance 2009 2010 2011 2012
Life insurance
Total (lei) 248.023.136 271.922.669 288.396.876 268.903.217
Share (%) 4.56 5.36 6.43 5.18
General
insurance Total (lei) Share (%) 5.187.480.620 95.44 4.797.561.000 94.64 4.194.672.389 93.57 5.187.981.443 94.82
Total of gross claims
paid (lei) 5.435.503.756 5.069.483.669 4.483.069.265 5.456.884.660
Source: CSA Report 2009-2012
The total of gross claims paid by insurers in 2012 was around 5.2 bn lei, increasing by 6.33% compared to 2011. According to general insurance contracts, the insurers paid insurance claims of over 4.4 bn lei, increasing by 6.22% compared to the figures carried forward at the end of the previous year. General insurance combined ratio – loss ration and expense ratio showed a constant level in 2012 as well, over 100%, which means that insurers incurred underwriting loss in general insurance.
Chart no. 1 Dynamics of gross claims paid between 2007 and 2012
0 1,000,000,000 2,000,000,000 3,000,000,000 4,000,000,000 5,000,000,000 6,000,000,000
2007 2008 2009 2010 2011 2012
Life Insurance General Insurance
The amount of gross claims paid for life insurance totalled 268.903.217 lei in 2012, recording 6.76% nominal increase compared to 2011. In real terms the increase was of 1.07%.
2. Gross technical reserves in life insurance
For life insurance, on December 31 2011, insurance companies had gross technical reserves of 4.772.055.357 lei, increasing by 8.86% (2.89%, real increase) compared to December 31 2010. The share of technical reserves related to reinsurance cession for this type of insurance amounted to 95.452.249 lei, representing 2% of the total gross technical reserves in life insurance.
Table no. 3 Evolution of gross technical reserves in life insurance between 2008 and 2012
Year Gross technical reserves (lei) Gross mathematical reserves (lei) Share of mathematical reserves in total (%)
2008 2.889.403.658 2.269.584.825 78,55
2009 3.423.586.592 2.544.842.737 74,33
2010 3.889.930.756 3.015.904.434 77,53
2011 4.383.572.919 3.535.862.556 80,66
2012 4.772.055.357 3.913.498.770 82,01
Source: CSA Report 2007-2011
At the end of last year, the total gross technical reserves in insurance exceeded 12.4 bn lei, increasing by 5.47% compared to the total recorded at the end of 2011. Out of the total reserves, the one related to general insurance amounted by nearly 7 bn lei, whereas the one related to life insurance exceeded 5.4 bn lei.
Chart no. 2 Dynamics of gross technical reserves in life insurance between 2008 and 2012
0 2.000.000 4.000.000 6.000.000
Gross mathematical reserves 2.269.585 2.544.843 3.015.904 3.535.863 3.913.498 Mathematical reserves (GI) 2.889.403 3.423.586 3.889.930 4.383.572 4.772.055
2008 2009 2010 2011 2012
Source: made by the author
Gross mathematical reserves totalling 3.913.498.770 lei, represented 82.01% out of the total gross technical reserves in life insurance and recorded 10.68% nominal increase (4.61%, real increase) compared to 2010.
3. Crisis impact upon life insurance market
dissimilarity compared with the banking sector where current loans are correlated with economic factors of general interest.
Although the insurance sector has been less affected than the banking one, the current economic crisis has revealed new opportunities to improve risk management and surveillance in insurance. Cautious and traditional business policies that insurers have applied so far, proved rather resilient although not all insurance market participants have adopted cautious strategies.
In Romania, insurance companies have faced the effects of international financial turbulences as well as the depreciation of assets in the investment portfolio and emergence of negative perceptions of population on financial institutions. The main risks of market insurance are related to the decreasing growth rate of gross written premiums, loss ratio increase in car insurance, and increase of cash surrender value of life insurance (BNR, 2009). Profitability ratios calculated on Romanian insurance market have continued to deteriorate as a result of the decrease of technical results. The increase of car insurance loss ratio accentuated the negative technical result for general insurance and the benefits and cash surrender payments doubled 2008.
In our country, the crisis had effects in life insurance even since 2008, according to the statements made by CSA manager, as when they did not have enough money to pay their debts and when the national currency lost its value to the European currency, the Romanians wanted to surrender their life insurance policy in order to have an additional source of income.
Compared to the average of the first nine months of 2007, the Romanians cashed out 80% more money in October 2008, according to the data provided by Insurance Supervisory Commission (CSA). In October and November 14.577 individuals surrendered their life insurance and demanded a check for the surrender value, which represents 0.2% of the total of 7.6 million life insurance policies recorded at the end of September 2008. The need for cash did not occur instantly but gradually because life was becoming increasingly difficult, unemployment rate increased, credit slowed down, companied laid off their staff, ceased production etc. All these aspects led to an increased need for money materialized in the fact that people withdrew all money they had in savings accounts or insurance policies.
In 2009, life insurance sectorfelt the financial crisis most acutely, taking into account the increase in unemployment rate and the fall in income of insurance products customers. One of the factors that had a significant influence upon this sector was the psychological factor because the fear and uncertainty concerning consumers’ financial security led in early 2009, both to the increate in cancellations and complete cash surrender of contracts and also the intention to buy an insurance policy was put off.. Consumers need to know when buying insurance that if they request a cash surrender value of their policy will not bring in the expected benefits. Life insurance segment bounced back in late 2009, when the number of surrenders and cancellations diminished significantly. Gross paid claims and the amounts paid for repurchases and mature life insurance contracts totalled 680.,720 million lei in 2009, increasing by 37.48% compared to 2008 (495.1 million lei). Rising prices and wage-cutting were the main elements that influenced negatively the quality of life of the Romanian people. These were followed by the loss of diminish of fringe benefits or job loss, increase of payment value due to leu devaluation, all these aspects being direct consequences of the world economic crisis. This led inevitably to a significant change in consumers’ behaviour.
Insurance companies made 6% less profit in 2011 than in the previous year. In 2010 the total gross written premiums was of 6.9 bn lei, while last year their total was only 6.5 bn lei. The decrease is largely due to the car insurance segment, especially RCA policies, decreasing by 21%, that were in turn influenced by the drop in car sales, lower by 7.4% in 2011 compared to 2010. Casco insurance recorded also losses of 17%.
In 2012, life insurance market increased by 3.75% compared to the previous year, up to 1.8 bn lei and 2013 is expected to be the same.
4. Conclusions
In assessing insurance effectiveness, the results achieved both by the insurer and the insured must be taken into account. If for some reasons, the results achieved by the insurer or the insured are overlooked, it means that we settle to a partial analysis that does not allow to identify all factors that are included in insurance. It can be said that the assessment of insurance effectiveness should be done taking into account the indicators that show both the results achieved by the insurer and the efficiency for the insured.
middle class that is growing increasingly more powerful lately. Even if household borrowing has grown exponentially in recent years, the idea of building financial security is still far from most Romanians. In conclusion, life insurance contribution to GDP growth, create new jobs and thus to employment, to protect citizens against various risks that threaten their lives and health, in a word, growth.
References
[1] Băiescu, A.,T.(2005), Asigurări de viață la debutul mileniului III, Editura Dacia, Cluj –Napoca; [2] Bistriceanu, Gh. D.(2006), ,,Asigurări şi Reasigurări”, editura Universitară, Bucureşti;
[3] Bistriceanu, Gh. D.(2001), Lexicon de Finanțe – Bănci – Asigurări, Volumul I, Editura Economică, București; [4] Bistriceanu, Gh. D.(2002), Sistenul asigurărilor din România, Editura Economică, București;
[5] Constantinescu, D. A(2004), Tratat de asigurări, Volumul I, Editura Economică, Bucureşti;
[6] Constantinescu ,A. D.(2002), ,,Istoria asigurărilor în România”, Colecţia Naţională, Volumul I, Bucureşti; [7] Ciumaş, C.(2003), Economia asigurărilor, Editura Casa Cărţii de Ştiinţă, Cluj – Napoca ;
[8] Cistelecan, L., Cistelecan, R.,(2006), Asigurări, Editura Universitatea ”Petru Maior”,Târgu-Mureș;
[9] Ciurel Violeta(2000), Asigurări şi reasigurări: abordări teoretice şi practici internaţionale, Editura All Beck, Bucureşti ;
[10] Manea l.D., Muntean M-C.,Nistor C.,Nistor R., Labour Migration from Romania to the EU Point of Weakness in the Romanian Economy ,Annals of “Dunarea de Jos” University of Galati Fascicle I. Economics and Applied Informatics Years XIX – no1/2013 ISSN 1584-0409, http://www.eia.feaa.ugal.ro/images/eia/2013_1/ManeaMunteanNistorNistor.pdf
[11] Negru Titel(2008), Asigurarile si reasigurarile in economie, Editura C.H. Beck, Bucuresti;