COMPARING OF DEPOSIT MODEL AND LIFE INSURANCE MODEL IN
MACEDONIA
TATJANA ATANASOVA-PACHEMSKA
1,
SASE LOZANOV
1,
LIMONKA LAZAROVA
11
FACULTY OF COMPUTER SCIENCE, GOCE DELCEV UNIVERSITY, SHTIP,
MACEDONIA
[email protected],
[email protected],
[email protected]
Abstract. In conditions of the continuous decline of the interest rates for bank deposits, and at a time when uncertainty about the future is increasing, physical and legal persons have doubts how to secure their future or how and where to invest their funds and thus to “fertilize” and increase their savings. Individuals usually choose to put their savings in the bank for a certain period, and for that period to receive certain interest, or decide to invest their savings in different types of life insurance and thus to "take care" of their life, their future and the future of their families. In mathematics are developed many models that relate to the compounding and the insurance. This paper is a comparison of the deposit model and the model of life insurance.
Key words:deposit, life insurance, interest rate, profit, mathematical models. Clasificare JEL:C12,C83
1.
Introduction
We live in a complex world where nobody believes that he/she can make a real and proper decision in the business conducting. Life insurance in our country is still insufficiently developed and the citizens are not familiar enough with it to be able to make a real decision where to invest the surplus of funds. Life insurance is the most common type of insurance in the world, mainly because of its benefits for the insured and the country as a whole. As special financial services that in a best way combine protection of interests of the insured and the members of their family with adequate basic savings, life insurance through accumulation and investment of significant financial resources, and up to the positive effects on the economy as a whole. Life insurance covers the insurance of the people that have accumulated funds or savings to cover the increased risks in the later years of insurance. The said is on voluntary basis, with the exception of the risks that threaten to third parties or their property, and hence the law stipulates compulsory insurance. The Law on Supervision of Insurance as the basic law by which is regulated the insurance industry in the Republic of Macedonia is in line with the directives and the other regulations of the European Union in the field of insurance, and this builds in the principles and standards to ensure the monitoring of the International association of insurance supervisions. The insurance sector in the Republic of Macedonia is characterized by moderately competitive market.
In 2011, in the group of life insurance on the market in the Republic of Macedonia, a significant participation is owned by two insurance companies: Grave (49,17%) and Croatia insurance (40,44%), and two other insurance companies have a low share on the market: Viner, Uniqa, which is due to the fact that they are two new companies that started with their business in 2011, and they are present for a relatively short period on the Macedonian insurance market. 1
In [7] a researching has been made in relation to when the insured persons are satisfied with the companies that offer life insurance. According to the researching made by the authors, it was established that the confidence, competences of the agents and the appropriateness of the product they are offered is crucial for the insurance beneficiary to be satisfied. On the other hand [6], the authors point to the risks that are present in life insurance. In [8] a comparison between the life insurance and the long term personal insurance has been made.
„ACADEMICA BRÂNCUŞI” PUBLISHER, ISSN 2344 – 3685/ISSN-L 1844 - 7007 2. Methodology of factor analysis
Subject of this researching is the attitude of the insured persons who voluntarily have additional insurances or more precisely, life insurance. The results of this research are only one part of a more precise and more complex researching. Surveyed were total of 118 respondents all over the country who have life insurance and the sample was designed by random selection. As a research technique was used survey and a structured questionnaire was used, composed of questions of open and closed type. For analysis of the data were used standard statistical mathematical procedures in the SPSSv16 program.
In this paper we will single out two hypotheses, as follows:
1 - H0: The sum of the annual amounts that are allocated for life insurance is in correlation with the total monthly
income of the respondents
2 - H0: The time period to invest in life insurance is in correlation with the total monthly income of the respondents
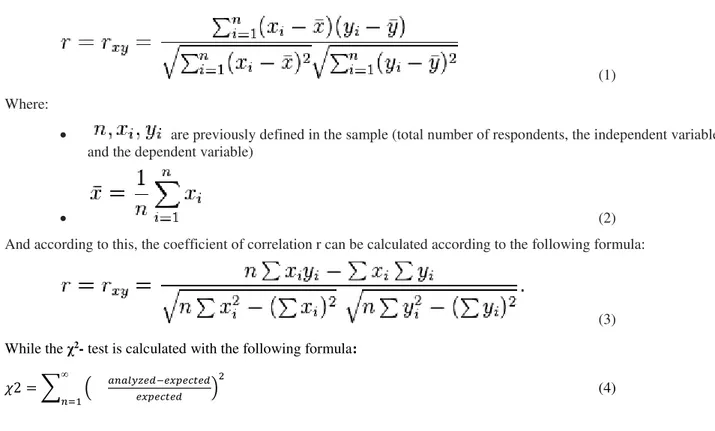
The data are shown in tables (through frequencies and percentages), and for their testing we used the coefficient of correlation and the χ2- test.
The coefficient of correlation is calculated by the following formula:
(1)
Where:
are previously defined in the sample (total number of respondents, the independent variable and the dependent variable)
(2)
And according to this, the coefficient of correlation r can be calculated according to the following formula:
(3)
While the χ2- test is calculated with the following formula:
�2 = ∑∞ ���� � �− � �
�= (4)
3. Results and discussion
For the needs of the first hypothesis we will analyze the cross tabulation between the two questions, to which the hypothesis refers:
1 - H0: The sum of the annual amounts that are allocated for life insurance is in correlation with the total monthly
income of the respondents
All respondents didn’t answer to this question, but only 77 out of 118 or 65,3% of the respondents:
Table No. 1: Case Processing Summary Cases
Valid Missing Total
N Percent N Percent N Percent Which is the annual
for the life insurance? Total monthly income?
It may be noted that most respondents (17) have incomes above 811 Euros, and 31 of them allocate annual amount for insurance up to 250,00 Euros. It is also interesting to note that 6 respondents that have income above 811 Euros allocate up to 250,00 Euros per year for insurance.
Table No. 2: Crosstabulation - Which is the annual amount that you allocate for life insurance? * Total monthly income Total monthly income
Up to 325 Euros Up to 410 Euros Up to 490 Euros Up to 570 Euros Up to 650 Euros Up to 730 Euros Up to 810 Euros 811 +
Euros Total
W h ich is th e an n u al am o u n t th at y o u allo ca te fo r life in su ra n ce ? Up to 250 Euros
Count 4 4 5 5 3 0 4 6 31
Expected Count 2,0 3,6 4,4 4,4 2,8 2,4 4,4 6,8 31 Std. Residual 1,4 ,2 ,3 ,3 ,1 -1,6) -,2) -,3)
251 - 500 Euros
Count 1 1 5 1 2 4 2 2 18
Expected Count 1,2 2,1 2,6 2,6 1,6 1,4 2,6 4,0 18 Std. Residual -,2) -,8) 1,5 -1,0) ,3 2,2 -,4) -1,0)
501 - 750 Euros
Count 0 1 0 1 0 1 2 1 6
Expected Count ,4 ,7 ,9 ,9 ,5 ,5 ,9 1,3 6 Std. Residual -,6) ,4 -,9) ,2 -,7) ,8 1,2 -,3)
751 - 1000 Euros
Count 0 2 1 2 0 1 1 4 11
Expected Count ,7 1,3 1,6 1,6 1,0 ,9 1,6 2,4 11 Std. Residual -,8) ,6 -,5) ,3 -1,0) ,2 -,5) 1,0
1000 Euros and more
Count 0 1 0 2 2 0 2 4 11
Expected Count ,7 1,3 1,6 1,6 1,0 ,9 1,6 2,4 11 Std. Residual -,8) -,3) -1,3) ,3 1,0 -,9) ,3 1,0
Total Count 5 9 11 11 7 6 11 17 77
Expected Count 5 9 11 11 7 6 11 17 77
Source: Analysis and comparison of profit in various long-term investments (master thesis - 2016)
In order for us to be able to prove the H0 – hypothesis, first we will calculate the mean, standard deviation and the coefficient of correlation.
Table No. 3: Descriptive Statistics - Which is the annual amount that you allocate for life insurance? * Total monthly income
Mean Std. Deviation N
Which is the annual amount that you allocate
for life insurance?
2,39 1,488 77
Total monthly income 5,82 2,618 115
Table No. 4: Correlations - Which is the annual amount that you allocate for life insurance? * Total monthly income Which is the annual amount
that you allocate for life insurance?*
Total monthly income
Which is the annual amount that you allocate
for life insurance?*
Pearson Correlation 1,000 ,242*
Sig. (2-tailed) ,034
N 77,000 77
Total monthly income
Pearson Correlation ,242* 1,000 Sig. (2-tailed) ,034
N 77 115,000
*. Correlation is significant at the 0.05 level (2-tailed).
„ACADEMICA BRÂNCUŞI” PUBLISHER, ISSN 2344 – 3685/ISSN-L 1844 - 7007
increasing of the annual amount that the insured allocate for life insurance. Since the coefficient of correlation is 0,243 or 24,3%, we can safely conclude that between these two variables there is a poor correlation connection.
The analysis of the �2 test can be seen on the following table. The said has the value of 27,871.
Table No. 5: Chi-Square Tests - Which is the annual amount that you allocate for life insurance? * Total monthly income
Value df Asymp. Sig. (2-sided) Pearson Chi-Square 27,871a 28 ,471
Likelihood Ratio 33,870 28 ,205 Linear-by-Linear
Association 4,468 1 ,035 N of Valid Cases 77
a. 39 cells (97,5%) have expected count less than 5. The minimum expected count is ,39.
We note a significant relationship between the annual amount that the respondents allocate for life insurance and the total monthly incomes, at χ2(28)=27,871, p=0.05. This means that we can prove the hypothesis H0 that the Sum of
annual amounts allocated for life insurance is in correlation with the total monthly incomes of the respondents.
The second hypothesis is:
H0: The time period of investing in life insurance is in correlation with the total monthly incomes of the respondents
The following variables have been taken into consideration for the second hypothesis: How many years you already have life insurance and total monthly income. For this cross tabulation have been surveyed 79 respondents from a total of 118 or 66,9%.
Table No. 6: Case Processing Summary Cases
Valid Missing Total
N Percent N Percent N Percent
How many years you already have life
insurance? * Total monthly income
79 66,9% 39 33,1% 118 100,0%
By cross tabulation of these two variables we have concluded that persons most often make allocation up to 5 years for life insurance. As the years of allocation for life insurance increase, thus the number of respondents decreases. The persons with total incomes above 810 Euros have most of insurances up to 5 years.
Table No. 7: Crosstabulation - How many years you already have life insurance? * Total monthly income Total monthly income
Up to 250 Euros Up to 325 Euros Up to 410 Euros Up to 490 Euros Up to 570 Euros Up to 650 Euros Up to 45000 Up to 730 Euros Above 810 Euros Total H o w m an y y ea rs y o u alr ea d y h av e life in su ra n ce ?
Up to 5
years 1 3 8 8 6 5 3 4 12 50
Up to 10
years 0 1 2 1 2 1 3 3 5 18
Up to 15
years 0 0 0 2 3 1 0 0 0 6
Up to 20
years 0 0 0 1 0 0 0 0 0 1
More than
20 years 0 0 0 0 0 0 0 2 2 4
Total 1 4 10 12 11 7 6 9 19 79
In order for us to be able to prove the H0 – hypothesis, first we will calculate the mean, standard deviation and the coefficient of correlation
Table No. 8: Descriptive Statistics - How many years you already have life insurance? * Total monthly income Mean Std. Deviation N
Total monthly income 5,82 2,618 115 How many years you will
make allocation for life insurance?
2,68 1,235 73
We will test the level of association of these two variables through the Pearson’s coefficient of correlation. According to the table given below, we can note that the said has a negative correlation, indicating that between the two analyzed variables there is a negative correlation, i.e., that by increasing of total incomes of the respondents, the years of allocation for life insurance decline. The coefficient of correlation of - 0,001 points out to the poor correlation between these two variables.
Table No. 9: Correlations - How many years you already have life insurance? * Total monthly income
Total monthly income
How many years you will make allocation for
life insurance?
Total monthly income
Pearson Correlation 1,000 -,001)
Sig. (2-tailed) ,991
N 115,000 73
How many years you will make allocation for life
insurance?
Pearson Correlation -,001) 1,000 Sig. (2-tailed) ,991
N 73 73,000
With level of significance of p=0,05, it can be concluded that there is no statistically significant correlation between these two variables.
The analysis for χ2 test can be seen in the table No 10. The obtained value of χ2 test is 31.391.
Table No. 10: Chi-Square Tests - How many years you already have life insurance? * Total monthly income
Value df Asymp. Sig. (2-sided) Pearson Chi-Square 31,391a 32 ,497
Likelihood Ratio 30,591 32 ,538 Linear-by-Linear
Association 2,241 1 ,134 N of Valid Cases 79
a. 40 cells (88,9%) have expected count less than 5. The minimum expected count is ,01.
There is a statistically significant relationship between the annual amount that the respondents allocate for life insurance and the total monthly incomes, at χ2(32)=31,391, p=0.05. This means that we can accept H0, i.e.,that the
Time period of investment in life insurance is in correlation with the total monthly incomes of the respondents
4. Conclusion
„ACADEMICA BRÂNCUŞI” PUBLISHER, ISSN 2344 – 3685/ISSN-L 1844 - 7007 Bibliography:
1 Briys Е., de Varenne F,On the Risk of Life Insurance Liabilities: Debunking Some Common Pitfalls, The
Wharton school, University of Pennsylvania
2 Gacovska А.; Trenceva-Smilevski J..; Ivanovska N. „Mathematics for economists„, MON, 2010 3 Jovanovski T., „Economics of insurance“, Skopje, 2005
4 Janev. D. „Actuarial models of life insurance“, UKIM, Skopje, 2013
5 Kuhlemeyer G. А., Allen G. H., Consumer Satisfaction With Life Insurance: A Benchmarking Survey
6 Meier V., Long-Term Care Insurance and Life Insurance Demand, The GENEVA Papers on Risk and Insurance TheoryJune 1998, Volume 23, Issue 1, pp 49-61.