RESEARCH ARTICLE
Regional Fluctuation in the Functional
Consequence of LINE-1 Insertion in the
Mitf
Gene: The Black Spotting Phenotype Arisen
from the
Mitf
mi-bw
Mouse Lacking
Melanocytes
Kazuhisa Takeda1☯, Hiroki Hozumi1☯, Koji Ohba1☯, Hiroaki Yamamoto2, Shigeki Shibahara1
*
1Department of Molecular Biology and Applied Physiology, Tohoku University School of Medicine, Sendai, Miyagi 980–8575, Japan,2Faculty of Bioscience, Nagahama Institute of Bio-Science and Technology, Nagahama, Shiga 526–0829, Japan
☯These authors contributed equally to this work.
*shibahar@med.tohoku.ac.jp
Abstract
Microphthalmia-associated transcription factor (Mitf) is a key regulator for differentiation of melanoblasts, precursors to melanocytes. The mouse homozygous for theblack-eyed white (Mitfmi-bw) allele is characterized by the white-coat color and deafness with black eyes due to the lack of melanocytes. TheMitfmi-bwallele carries LINE-1, a retrotransposable element, which results in the Mitf deficiency. Here, we have established the black spotting mouse that was spontaneously arisen from the homozygousMitfmi-bwmouse lacking melanocytes. The black spotting mouse shows multiple black patches on the white coat, with age-related gray-ing. Importantly, each black patch also contains hair follicles lacking melanocytes, whereas the white-coat area completely lacks melanocytes. RT-PCR analyses of the pigmented patches confirmed that the LINE-1 insertion is retained in theMitfgene of the black spotting mouse, thereby excluding the possibility of the somatic reversion of theMitfmi-bwallele. The immunohistochemical analysis revealed that the staining intensity for beta-catenin was noticeably lower in hair follicles lacking melanocytes of the homozygousMitfmi-bwmouse and the black spotting mouse, compared to the control mouse. In contrast, the staining inten-sity for beta-catenin and cyclin D1 was higher in keratinocytes of the black spotting mouse, compared to keratinocytes of the control mouse and theMitfmi-bwmouse. Moreover, the ker-atinocyte layer appears thicker in theMitfmi-bwmouse, with the overexpression of Ki-67, a marker for cell proliferation. We also show that the presumptive black spots are formed by embryonic day 15.5. Thus, the black spotting mouse provides the unique model to explore the molecular basis for the survival and death of developing melanoblasts and melanocyte stem cells in the epidermis. These results indicate that follicular melanocytes are responsi-ble for maintaining the epidermal homeostasis; namely, the present study has provided evi-dence for the link between melanocyte development and the epidermal microenvironment. a11111
OPEN ACCESS
Citation:Takeda K, Hozumi H, Ohba K, Yamamoto H, Shibahara S (2016) Regional Fluctuation in the Functional Consequence of LINE-1 Insertion in the
MitfGene: The Black Spotting Phenotype Arisen from
theMitfmi-bwMouse Lacking Melanocytes. PLoS ONE 11(3): e0150228. doi:10.1371/journal.pone.0150228
Editor:Suzie Chen, Rutgers University, UNITED STATES
Received:October 28, 2015
Accepted:February 10, 2016
Published:March 1, 2016
Copyright:© 2016 Takeda et al. This is an open access article distributed under the terms of the Creative Commons Attribution License, which permits unrestricted use, distribution, and reproduction in any medium, provided the original author and source are credited.
Data Availability Statement:All relevant data are within the paper.
Introduction
Long interspersed element-1 (LINE-1 or L1) is a retrotransposable element that could cause various types of diseases [1]. The insertion of LINE-1 in a certain gene may result in the impaired expression of an affected gene and/or the altered function of an affected gene product.
Incidentally, LINE-1 is present in intron 3 of themicrophthalmia-associated transcription
fac-tor(Mitf) gene of the black-eyed white (Mitfmi-bw) mouse [2]. Mitf has been established as an essential regulator for the development of melanoblasts, precursors to melanocytes [3–5]. The
mouse homozygous for theMitfmi-bwallele shows a complete black-eyed white phenotype with
severe hearing loss but without apparent ocular abnormalities [2,6], the phenotype of which is due to the lack of melanocytes.
Melanoblasts migrate from the neural crest during fetal development to distribute mainly to the skin, eye (iris and choroid), and inner ear, thereby contributing to pigmentation of the coat and eyes as well as to sight and hearing [7]. The LINE-1 insertion results in the aberrant splicing ofMitfgene transcripts [2,8], thereby decreasing the expression level of Mitf, including Mitf-M that is preferentially expressed in melanocyte-lineage cells [9,10]. Because theMitfmi-bwallele
carries the LINE-1 in intron 3 located between exon 3 and exon 4 [2], the Mitf-M transcripts
that are encoded by the downstream first exon may be more likely to undergo aberrant splicing,
compared to other Mitf isoform transcripts. Thus, theMitfmi-bwmouse has provided an
excel-lent model to study the phenotypic consequences of the Mitf-M deficiency and/or the lack of
melanocytes [8,11,12]. Unexpectedly, however, Mitf-M mRNA is expressed in the wild-type
mouse brain as well as in the homozygousMitfmi-bwmouse brain [8,11]. Subsequently, we have shown the Mitf-M expression in the projection neurons of the olfactory bulb [13]. These results suggest that Mitf-M expression may be regulated in neurons by a mechanism distinct from that in melanocyte-lineage cells. Moreover, the influence of the LINE-1 insertion may be different between neurons and melanocyte-lineage cells.
In the present study, we aimed to explore the functional consequence of the LINE-1 insertion using the homozygousMitfmi-bwmouse skin. In this context, Silvers [7] described a black spot-ting phenotype, arisen from the black-eyed white mouse on the C3H strain. We also obtained theMitfmi-bwmouse with black spots that was spontaneously arisen from the homozygous
Mitfmi-bwmouse on a mixed background of C3H and C57BL/6J (C3;B6-Mitfmi-bw/Mitfmi-bw) [2,
14]. The presence of such a black spotting phenotype suggests that the functional consequence
of the LINE-1 insertion may be fluctuated, depending on the cellular microenvironment.
Accordingly, we have established the homozygousMitfmi-bwmouse with black spots, termed
black spotting mouse. This mouse line shows black patches with a grayish tone on the white
coat background, despite that the LINE-1 insertion is retained in itsMitfgene. Moreover, the
adult black spotting mouse is characterized by age-related graying of the pigmented patches.
Using the homozygousMitfmi-bwmouse and the black spotting mouse, we have provided the
evidence that attenuated beta-catenin expression may be involved in the regional fluctuation in the fate of developing melanoblasts and melanocytes.
Materials and Methods
Mice
The mouse strain carrying theMitfmi-bwallele (C3;B6-Mitfmi-bw/Mitfmi-bw) was obtained as described previously [2,14], and thedopachrome tautomerase(Dct)-lacZtransgenic mouse
was kindly provided by Dr. Ian J Jackson [15]. The mouse homozygous for theMitfmi-bwallele
and theDct-lacZtransgene was then established on the C57BL/6J background [5]. Originally,
theMitfmi-bwallele had been maintained on the C57BL/6J background [2]. However, due to the
Variability in the Functional Consequence of LINE-1 Insertion
risk of extinction, theMitfmi-bwallele was rescued by crossing with C3H/He mice [2]. The
Mitfmi-bwmice with pigmented spots were spontaneously born in the late 1990s, during which
time we had maintained theMitfmi-bwallele on the C3;B6 mixed background. Subsequently, the
Dct-lacZtransgene was introduced into the C3;B6-Mitfmi-bw/Mitfmi-bwmice with pigmented spots (C3;B6-Mitfmibw/Mitfmi-bw, Tg(Dct-lacZ)). TheMitfmi-bwmouse line with black spots
car-rying theDct-lacZtransgene on the C57BL/6J background (C57BL/6J-Mitfmi-bw/Mitfmi-bw, Tg
(Dct-lacZ)) was established by crossing the C3;B6-Mitfmi-bw/Mitfmi-bw, Tg(Dct-lacZ) mice with
pigmented spots with the C57BL/6J-Mitfmi-bw/Mitfmi-bw, Tg(Dct-lacZ mice (more than 10
gen-erations). In the subsequent text, we use a term, the black spotting mouse, to indicate the
homozygousMitfmi-bwmouse carrying theDct-lacZtransgene with the black spotting
pheno-type, unless otherwise specified. Mice were maintained under 12 h light/12 h dark cycle at 23–
25°C and were allowed free access to standard mice food and water. This study was carried out in strict accordance with the recommendations in the Guide for the Care and Use of Labora-tory Animals of the National Institutes of Health. The animal experiments were performed based on the protocol approved by the Committee on the Ethics of Animal Experiments of Tohoku University Graduate School of Medicine (Permit Number: 2013MdA-251). Animals were euthanized by cervical dislocation. All efforts were made to minimize suffering.
Antibodies
Anti-MITF polyclonal antibody was produced in rabbits using His-Tag-MITF-M as an antigen
that contains a His-tag at the amino-terminus of full-length MITF-M [16]. This antibody
rec-ognizes each of MITF-M, MITF-A, MITF-C and MITF-H [16] as well as mouse Mitf [13] and
chick Mitf [17,18]. The antibody against Dct as a marker for melanocytes was purchased from
Abcam (Cambridge, UK). The antibodies against beta-catenin, phosphorylated ERK1/2 (p-ERK1/2), cyclin D1, and Ki-67 were purchased from Cell Signaling Technology (Danvers, MA, USA). Non-specific normal rabbit IgG as a negative control for immunostain was purchased from DAKO (Produktionsvej, Glostrup, Denmark).
Immunohistochemical analysis of the mouse skin
The skin samples were prepared from male control C57BL/6 mice with theDct-lacZtransgene,
the bw mice carrying theDct-lacZtransgene, and the black spotting mice carrying theDct-lacZ
transgene. C57BL/6 mice were used as the wild type mouse. The mice used were 8 weeks old, unless otherwise stated. The isolated tissues were fixed with SUPER FIX (KURABO, Chuo-ku,
Tokyo, Japan) at room temperature for 24 h—48 h. The tissues were paraffin-embedded and
were cut into 2-μm sections for immunostaining. The tissue sections were deparaffinized, and
hydrated. Unmasking of antigens was performed with 98°C water bath in Immunosaver (Wako Pure Chemical Industries) for 25 min. For blocking the endogenous peroxidase activity, the tissue sections were treated with Peroxidazed 1 (Biocare Medical, Concord, CA, USA) at room temperature for 5 min. Then, to block non-specific antibody binding, the sections were treated with Background Punisher (Biocare Medical) for 10 min at room temperature. Dilution of primary antibodies in this study was as follows: MITF, 1:400, Dct, 1:1000, beta-catenin, 1:400, cyclin D1, 1:400, p-ERK1/2, 1:400, and Ki-67, 1:400. All antibodies were diluted in Can Get Signal immunostain Solution A. The tissue sections were incubated with primary antibod-ies at 4°C overnight. Immunohistochemical analyses were performed with MACH4 Universal
HRP-polymer (Biocare Medical) according to the manufacturer’s instructions. The tissue
sec-tions were visualized by staining with 3,3’-diaminobenzidine tetrahydrochloride (DAB)
(MITF, beta-catenin, cyclin D1, p-ERK1/2 and Ki-67) or Bajoran Purple (Dct). Hematoxylin was used as counterstaining. As negative control, the tissue sections were incubated with
normal rabbit IgG (DAKO), instead of a primary antibody. In case of the immunofluorescence analysis of Dct expression, the frozen section of the black patches of the black spotting mouse was used, as described previously [5].
PCR analysis of genomic DNA
PCR was performed on 100–500 ng of genomic DNA. Cycling conditions of the PCR were as
follows: initial denaturation for 2 min at 94°C, followed by a three-step profile: denaturation for 10 sec at 98°C, annealing for 30 sec at 65°C and extension for 5 min for 40 cycles. PCR amplification was performed using the following primers for LINE-1 insertion region (intron 3
—exon 4 ofMitfgene): Fp0,50-GGAAAAGGGAAGTGGTAGCTTTGTG-30and Rp4,50-TTCCA
GGCTGATGATGTCATCAATTACATC-30.
RNA isolation and RT-PCR analysis
RNA was prepared from the trunk region of each mouse embryo using TRI REAGENTTM (1
ml per 50–100 mg of tissue). The synthesized cDNA was stored at -20°C. Cycling conditions of
the PCR were initial enzyme activation for 5 min at 95°C, followed by a three-step profile: denaturation for 15 sec at 95°C, annealing for 15 sec at 55°C and extension for 30–60 sec for 40 cycles. To normalize the amount of total cDNA input, the cDNA for 18S rRNA was also ampli-fied as described above. The expression levels of Mitf-M mRNAs and 18S rRNA were detected
by PCR using the following primers: Mitf-M (exon 1M—exon 3) (Fp1:50-ATGCTGGAAATGC
TAGAATACAG-30and Rp3:50-GTTCATACCTGGGACTCACTCT-30); Mitf-M (exon 1M—
exon 7) (Fp1,50-ATGCTGGAAATGCTAGAATACAG-30and Rp7,50-ATGCGGTCGTTTATGTT
AAATCTT-30); and 18S rRNA (Fp,50-TTGACGGAAGGGCACCACCAG-30and Rp,50-GCACC
ACCACCCACGGAATCG-30).
X-gal staining of embryos from the black spotting mouse
This series of experiments was performed in parallel with the embryos from control transgenic
mouse and the bw mouse [5]. Mouse embryos were washed with PBS containing 12.5 mM
EDTA to remove blood components. The day of plug detection was taken to be E0.5. Timed
embryos (E12.5–E17.5) were fixed with 2% paraformaldehyde by using microwave. Fixed
sam-ples were rinsed twice in PBS, and then washed in X-gal detergent (2 mM MgCl2, 0.05% BSA,
0.1% sodium deoxycholate, 0.02% NP-40 in 0.1 M sodium phosphate buffer pH7.3). The
sam-ples were subsequently incubated in chromogenic solution [5 mM K3Fe(CN)6, 5 mM K4Fe
(CN)6, 0.085% NaCl, 0.1% X-gal in X-gal detergent] overnight at 20°C. After coloration,
embryos were stored in 4% paraformaldehyde in PBS.
Results
Evidence for the fluctuation in the functional consequences of the
LINE-1 insertion
Using the C57BL/6J mouse carrying theDct-lacZtransgene, we have established the
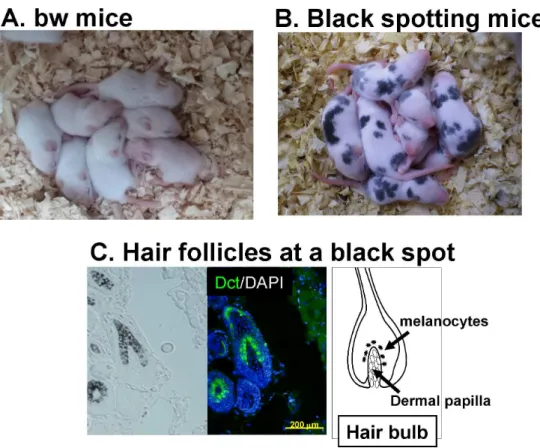
homozy-gousMitfmi-bwmouse carrying theDct-lacZtransgene on the C57BL/6J background [5], termed bw mouse for simplicity in the present study (Fig 1A). We have also established theMitfmi-bw
mouse line manifesting black spots on the C57BL/6J background carrying theDct-lacZ
trans-gene, named the black spotting mouse (Fig 1B). In contrast to the bw mouse that shows the
completely white coat (Fig 1A), the black spotting mouse has black spots on the dorsal portion
(Fig 1B). We then confirmed that melanocytes are present in pigmented hair follicles at a pig-mented patch of the black spotting mouse, as judged by the presence of melanin pigments and
Dct expression (Fig 1C). The distribution of melanocytes in a pigmented hair follicle is similar
to that seen in the wild-type C57BL/6J mouse [5], although the number of pigmented hair
folli-cles is limited in a given black patch of the black spotting mouse, as detailed below.
Features of black patches of the black spotting mouse
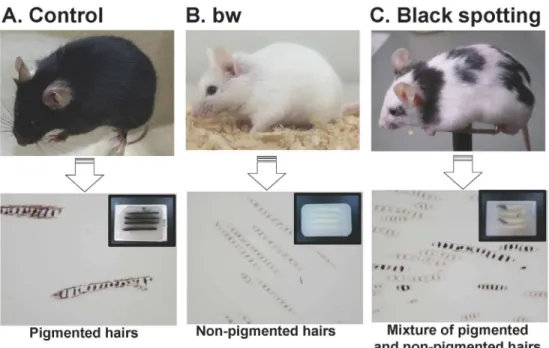
Representative images of the mice that carry theDct-lacZtransgene are shown (Fig 2A–2C):
the control C57BL/6J mouse (A), the bw mouse (B), and the black spotting mouse (C). In
con-trast to the bw mouse that shows the completely white coat (Fig 2B), the black spotting mouse
has black spots mainly on the dorsal portion and the neck region (Fig 2C). Importantly, the
black spotting mouse retains the black-eyed phenotype, but the pigmented patches of the black
spotting mouse show a grayish tone (Fig 2C), compared with the control C57BL/6J transgenic
mouse (Fig 2A). The difference in the tone of pigmented coat color is apparent in the paraffin block of each skin tissue (insets of bottom panels inFig 2). To explore the reason for the grayish tone of black patches of the black spotting mouse, we compared the appearance of hair shafts present in the paraffin blocks of the skin tissues (bottom panels). The hair shafts of the control mouse skin contain melanin pigments with the clearly visible frames (left), whereas the hair shafts of the bw mouse lack melanin pigments (middle). Importantly, there are two types of hairs in a black patch of the black spotting mouse: pigmented hairs and hairs lacking melanin pigments (right). Moreover, the degree of melanin deposits appeared to be lower in the
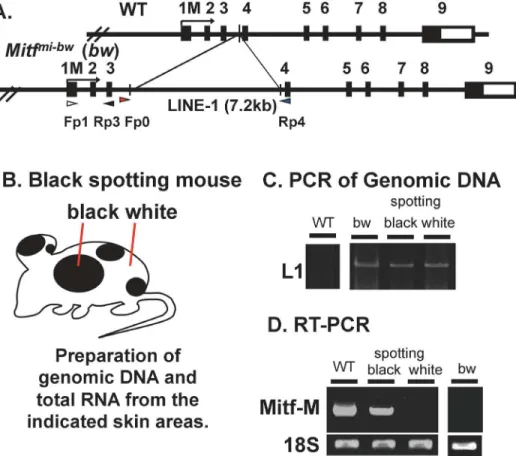
Fig 1. Black spotting mouse spontaneously arisen from the bw mouse.Appearance of bw mice (A) and black spotting mice (B). The newborn mice shown are 9 days old. (C) Pigmented hair follicles are present at a black patch of the black spotting mouse (30 days old). Middle image shows Dct/DAPI double staining. Expression of Dct (green signals) was detected in follicular melanocytes. Note that melanocytes are present in pigmented hair follicles. Scale bar, 200μm.
doi:10.1371/journal.pone.0150228.g001
pigmented hair shafts of the black spotting mouse (right), compared to the pigmented hair shafts of the control mouse (left). As expected, non-pigmented hair shafts of the black spotting mouse are indistinguishable from those of the bw mouse. Thus, the lower number of pig-mented hairs may account for the grayish tone of a pigpig-mented patch of the black spotting mouse, and a black patch of the black spotting mouse contains hair follicles lacking melanin pigments.
Lack of follicular melanocytes in the white coat area of the black spotting
mouse
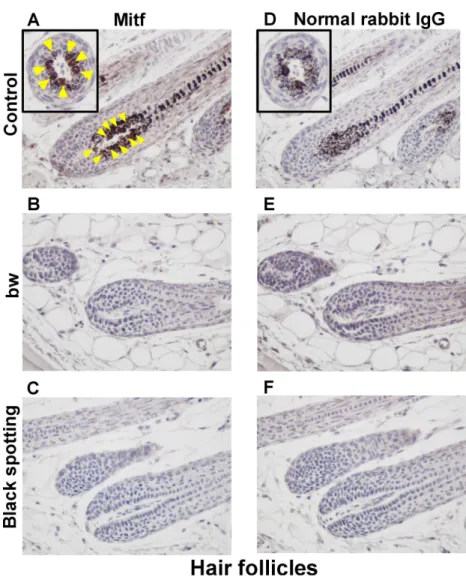
We next immunohistochemically analyzed the Mitf expression in hair follicles at the anagen stage using the skin samples prepared from the bw mouse and the white coat area of the black spotting mouse (Fig 3). The hair follicles of the control transgenic mouse contain melanin
pig-ments (Fig 3A and 3D), and Mitf expression, stained as brown, was detected in follicular
mela-nocytes (arrowheads inFig 3A). Because the brown coloration representing Mitf expression
may be unclear due to the presence of melanin pigments, the transverse section of a hair follicle is also presented in inset. In contrast, melanin pigments and Mitf-positive cells were absent in
the hair follicles of the bw mouse (Fig 3B and 3E). Likewise, melanin pigments and
Mitf-posi-tive cells were absent in the hair follicles at the white coat area of the black spotting mouse (Fig 3C and 3F).
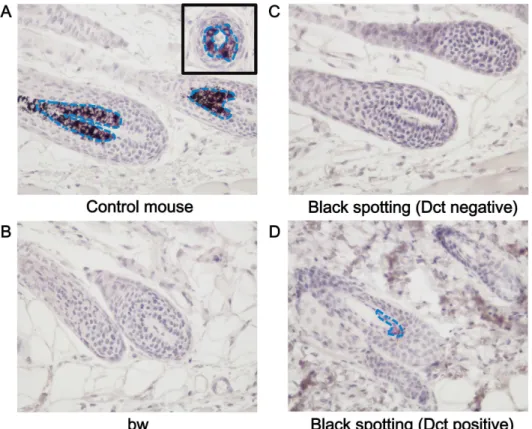
To determine the identity of Mitf-positive cells, we next analyzed Dct expression in the hair
follicles at the anagen stage by the immunohistochemical analysis (Fig 4). The Dct expression
was detected in the hair follicles of the control mouse (Fig 4A), but not in the hair follicles of
Fig 2. Black spotting mouse shows pigmented patches with a grayish tone.Top panels show a control lacZ transgenic mouse on the C57BL/6 background (A), the bw mouse with the black-eyed white phenotype (B), and the black spotting mouse with the black-eyed phenotype (C). Age of each mouse was about 30 days. Note that the black spotting mouse shows pigmented patches with a grayish tone. Bottom panels show the hair shafts from the control mouse (left), the bw mouse (middle), and the black spotting mouse (right). The hairs presented were derived from each paraffin block (insets) of the skin tissues, taken from the indicated mice of 8 weeks old.
doi:10.1371/journal.pone.0150228.g002
the bw mouse (Fig 4B) and in the hair follicles at the white coat area of the black spotting mouse (Fig 4C). Taken together, these results indicate that melanocytes are absent in the hair follicles of the bw mouse and in the hair follicles at the white coat area of the black spotting mouse. In contrast, Dct expression was detected in the hair follicles at a pigmented patch of the black spotting mouse (Fig 4D). Importantly, besides the lack of follicular melanocytes, there is no noticeable change in the structural organization of the hair follicles of the bw mouse and that of the hair follicles lacking melanocytes of the black spotting mouse.
Retained LINE-1 insertion in the
Mitf
gene of the black spotting mouse
We next explored whether the LINE-1 is retained in theMitfgene of the black spotting mouse
(Fig 5A). Genomic DNA and total RNA were isolated from a pigmented patch or a white coat
area of the black spotting mouse (Fig 5B). The PCR analysis of genomic DNA revealed the
Fig 3. Lack of Mitf expression in the white coat area of the black spotting mouse.Immunohistochemical analysis of the hair follicles from the control lacZ transgenic mouse (A, D), from the bw mouse (B, E), and from the white coat area of the black spotting mouse (C, F). Age of each mouse was 8 weeks. The consecutive tissue section was analyzed with the anti-MITF antibody (A-C) or normal rabbit IgG as negative control (D-F) (x 400). Mitf-positive nuclei, stained as brown (arrow heads), were detected only in the hair follicles of the control lacZ transgenic mouse (A). Each inset shows the transverse section of a hair follicle (A, D).
doi:10.1371/journal.pone.0150228.g003
amplified products of 7.6 kb from bw mouse DNA and black spotting mouse DNA (Fig 5C), but not from wild-type mouse DNA. In the latter context, the amplified product of 460 bp from wild-type mouse DNA was detected in a separate agarose gel used (data not shown). These results exclude the possibility of the somatic reversion that eliminates the LINE-1 inser-tion from theMitfmi-bwgene.
We then performed the RT-PCR using skin samples taken from a pigmented patch and a
white coat area of the black spotting mouse (Fig 5D), showing that Mitf-M transcripts are
expressed at the black patch of the black spotting mouse as well as in the skin of the wild type mouse, which is consistent with the Dct expression in follicular melanocytes at the pigmented patch (seeFig 4D). In contrast, Mitf-M transcripts are undetectable in the white coat area of the black spotting mouse (Fig 5D) as well as in the bw mouse skin, as reported previously [8]. These results, together with the immunohistochemical data (Fig 4C), indicate the lack of follic-ular melanocytes in the white coat area of the black spotting mouse.
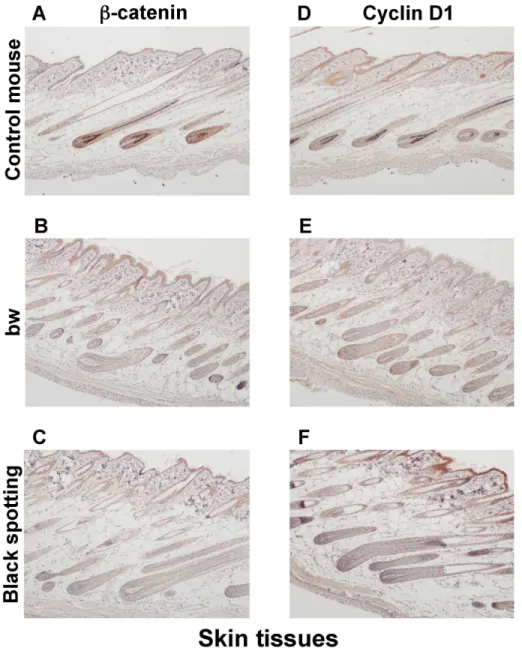
Attenuated expression of beta-catenin and cyclin D1 in the hair follicles
lacking melanocytes
As a first step to explore the functional consequence of the LINE-1 insertion that may deter-mine the fate of skin melanocytes, we analyzed the expression profiles of beta-catenin and
Fig 4. Expression of Dct in melanocytes of a pigmented hair follicle of the black spotting mouse. Immunohistochemical analysis of the hair follicles from the control lacZ transgenic mouse (A), from the bw mouse (B), and from the white coat area (C), and black coat area (D) of the black spotting mouse. Each tissue section was analyzed with the anti-Dct antibody (x 400). Dct-positive cells, stained as purple, were detected in follicular melanocytes of the control lacZ transgenic mouse (A) and in a hair follicle at the black patch of the black spotting mouse (D). An inset shows the transverse section of a pigmented hair follicle (A). Blue broken lines indicate the area where Dct-positive cells are distributed. Age of each mouse was 8 weeks.
doi:10.1371/journal.pone.0150228.g004
cyclin D1 in the skin tissues, isolated from the control transgenic mouse, the bw mouse, and
the black spotting mouse (Fig 6). Beta -catenin is a downstream component of Wnt signaling
[19], the signal of which is actively operating in the hair shaft precursor cells [20] and
melano-cytes [21]. Cyclin D1 is a target of Wnt/beta-catenin signaling. Furthermore, beta-catenin may
function as a coactivator for MITF in melanocytes [22,23]. Overall, the appearance of the skin
tissues was similar among the control transgenic mouse (Fig 6A and 6D), the bw mouse (Fig
6B and 6E), and the black spotting mouse (Fig 6C and 6F), except for the thickened epidermal
layer of the bw mouse. Compared with the control mouse (Fig 6A and 6D), the signal intensity
for the expression of beta-catenin and cyclin D1 was lower in the hair follicles of bw mouse (Fig 6B and 6E) and the black spotting mouse (Fig 6C and 6F). In contrast, the staining for beta-catenin was apparent in the epidermis of the bw mouse and the black spotting mouse,
compared to the control mouse epidermis (Fig 6A–6C). Moreover, the staining intensity for
the cyclin D1 expression was higher in the keratinocyte layer of the black spotting mouse (Fig
6F), compared to the control mouse (Fig 6D) and the bw mouse (Fig 6E).
Fig 5. LINE-1 is retained in the Mitf gene of the black spotting mouse.(A) The wild-typeMitfgene (WT) and theMitfmi-bwgene are schematically presented on the top, showing the position of the LINE-1 insertion in intron 3. The promoter region upstream from exon 1M is the melanocyte–specific promoter [9]. Exon 1 M encodes the amino-terminus of Mitf-M. (B) Schematic representation of the black spotting mouse. (C) PCR of genomic DNA. A primer set (Fp0 and Rp4) was used to amplify the sequence of intron 3. Genomic DNA and total RNA were isolated from the pigmented patch and white coat area of the black-spotting mouse skin at postnatal day (P) 5.0. The age of wild-type mouse and bw mouse was 30 days. (D) RT-PCR analysis of M gene transcripts. A primer set (Fp1 and Rp3) was used to amplify the M transcripts. Expression of Mitf-M transcripts was detected in RNA prepared from the black patch (spotting), but was not detectable from the white coat area (white). Left lane shows positive control with skin RNA from C57BL/6J (WT). A right panel of a separate gel shows the negative control with skin RNA from bw mouse. Bottom bands are internal control (18S rRNA).
doi:10.1371/journal.pone.0150228.g005
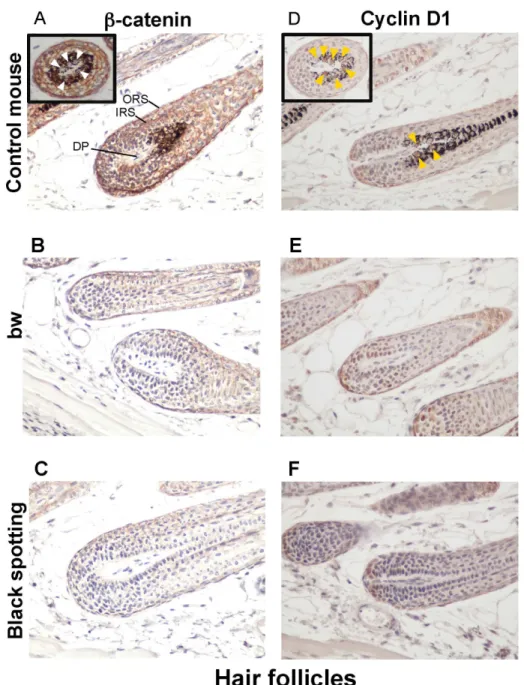
Consequently, using larger magnification of the skin tissue sections (x 400), we compared the expression profiles of beta-catenin and cyclin D1 in the hair follicles of the control
trans-genic mouse (Fig 7A and 7D), the bw mouse (Fig 7B and 7E), and the black spotting mouse
(Fig 7C and 7F). The expression of beta-catenin was detected in follicular cells, located around the dermal papilla and in the outer root sheath and the inner root sheath (Fig 7A); namely, beta-catenin was expressed in matrix cells around the dermal papilla, melanocytes, and the pre-cursor cells for the cortex of hair shaft. However, the nuclear localization of beta-catenin was
not clear in follicular melanocytes of the control mouse (white arrowheads inFig 7A),
Fig 6. Expression of beta-catenin and cyclin D1 in the skin tissues.Immunohistochemical analysis of the skin tissues taken from the control transgenic mouse (A, D), the bw mouse (B, E), and the black spotting mouse (C, F) for expression of beta-catenin (A—C) and cyclin D1 (D—F) (x 100). The age of mice analyzed was 8 weeks. The expression of beta-catenin and cyclin D1 was detected in the hair follicles of the control mouse. The intensity for the expression of cyclin D1 appears highest in the epidermis of the black spotting mouse (F).
doi:10.1371/journal.pone.0150228.g006
suggesting that the hair follicles analyzed were at later anlagen stage. In contrast, the staining intensity for beta-catenin expression was apparently lower in the hair follicles lacking melano-cytes of the bw mouse (Fig 7B) and the black spotting mouse (Fig 7C), compared to the control mouse (Fig 7A). Moreover, the signal intensity for beta-catenin was similar in hair follicles
between the bw mouse (Fig 7B) and the black spotting mouse (Fig 7C). Importantly, the cyclin
D1 expression was detected in the nuclei of follicular melanocytes of the control mouse (yellow
Fig 7. Low expression of beta-catenin and cyclin D1 in hair follicles lacking melanocytes.
Immunohistochemical analysis of the hair follicles taken from the control lacZ transgenic mouse (A, D), the bw mouse (B, E), and the black spotting mouse (C, F) for expression of beta-catenin (A—C) and cyclin D1 (D —F) (x 400). Each inset shows the transverse section of a pigmented hair follicle (A and D). In panel A, the signal for beta-catenin was detected in membranes but not in nuclei (white arrowheads), while in panel D, the cyclin D1 was expressed in nuclei (yellow arrowheads). The tissue sections shown were adjacent to the tissue sections used inFig 6. DP, dermal papilla; ORS, outer root sheath; and IRS, inner root sheath.
doi:10.1371/journal.pone.0150228.g007
arrowheads inFig 7D), suggesting that Wnt signaling may be active in follicular melanocytes.
The cyclin D1 expression was similar in hair follicles between the bw mouse (Fig 7E) and the
black spotting mouse (Fig 7F). These results suggest that follicular melanocytes may support
the expression of beta-catenin in their surrounding cells, such as matrix cells.
Enhanced expression of beta-catenin and cyclin D1 in the epidermis of
the black spotting mouse
We next compared the epidermal expression of beta-catenin and cyclin D1 among the control
mouse (Fig 8A and 8D), the bw mouse (Fig 8B and 8E), and the black spotting mouse (Fig 8C
and 8F). The images shown represent the epidermal portions of the same tissue sections used inFig 7. Apparently, the staining intensity for beta-catenin was higher in the epidermis of the
black spotting mouse, compared to the bw mouse and the control mouse epidermis (Fig 8A–
8C). Moreover, the signals for beta-catenin appeared to be localized in the membrane region of
keratinocytes in the bw mouse epidermis (Fig 8B). In this context, the staining intensity for
cyclin D1 was lower in the bw mouse epidermis (Fig 8E), compared to that in the control
mouse epidermis (Fig 8D) and the black-spotting mouse epidermis (Fig 8F). Importantly, the
staining intensity for beta-catenin and cyclin D1 was highest in the epidermis of the black
spot-ting mouse (Fig 8C and 8F). We also confirmed that the keratinocyte layer was thicker in the
bw mouse (Fig 8B and 8E), compared to the control mouse (Fig 8A and 8D) and the black
spot-ting mouse (Fig 8C and 8F). These results suggest that beta-catenin may not properly function
in keratinocyte nuclei of the bw mouse, whereas the function of beta-catenin may be enhanced in keratinocytes of the black spotting mouse.
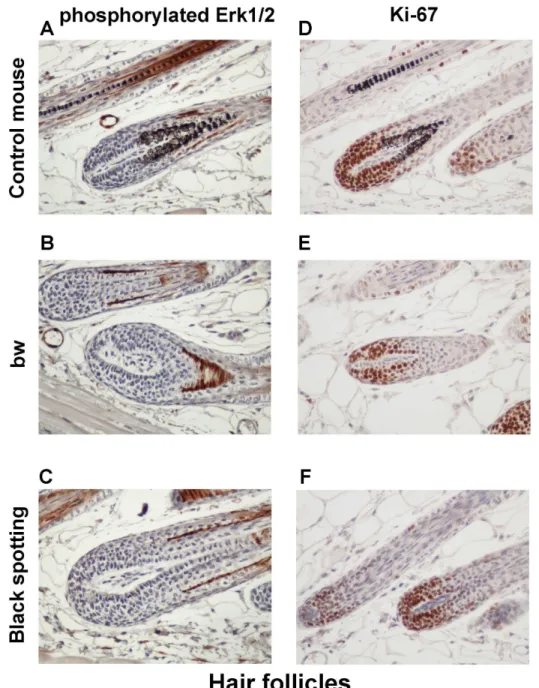
Enhanced expression of Ki-67 in the basal layer of the bw mouse
epidermis
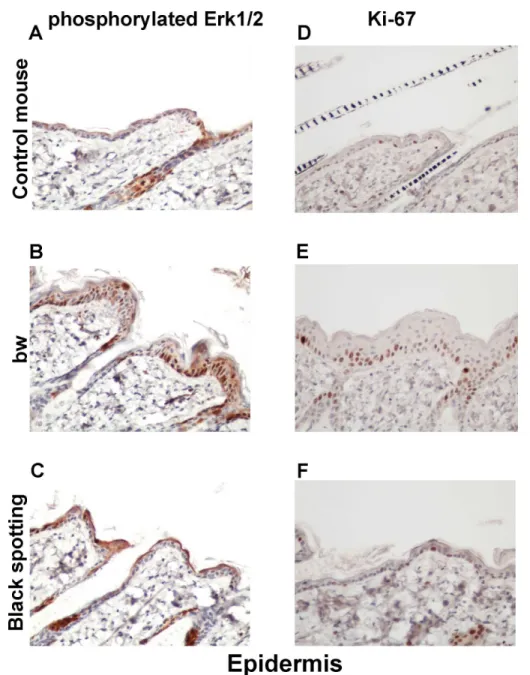
To explore the molecular basis of the thickened keratinocyte layer in the bw mouse, we next analyzed the expression of p-ERK1/2 and Ki-67 in hair follicles (Fig 9) and the epidermis (Fig
10) of the consecutive skin tissue sections. The expression of p-ERK1/2 and Ki-67 was similar
in hair follicles among the three mouse groups (Fig 9). Especially, Ki-67 expression was detected in matrix cells surrounding the dermal papilla. In contrast, the staining intensity for
Ki-67 was higher in the basal layer of the bw mouse epidermis (Fig 10E), compared to the
con-trol mouse and the black spotting mouse (Fig 10D and 10F). Importantly, the epidermal
expression of p-ERK1/2 and Ki-67 was similar in the control mouse and the black spotting
mouse (Fig 10). The enhanced expression of Ki-67 may reflect the thickening of the
keratino-cyte layer of the bw mouse. We therefore suggest that the epidermal microenvironment of the black spotting mouse may be suitable for normal growth of keratinocytes, which may contrib-ute to the survival of developing melanoblasts in the selected areas.
Formation of presumptive black spots by E15.5 in the black spotting
mouse
To explore the timing of the formation of the black spots, we took the advantage that the black
spotting mouse carries theDct-lacZtransgene. The number and the distribution ofDct-lacZ
-positive melanoblasts, stained blue, were analyzed during embryonic development of the black
spotting mouse (Fig 11A and 11B). In addition to the ectopic expression of the transgene in
caudal nerves [24,25], the RPE and the telencephalon, where the endogenousDctgene is
expressed [26], were stained blue. At E12.5,Dct-lacZ-positive melanoblasts were easily detected
in the trunk region of the black spotting mouse embryo (Fig 11A and 11B), although the
density of theDct-lacZ-positive cells was apparently lower in the black spotting mouse embryo, compared to the control mouse embryo [5]. In fact, the number of theDct-lacZ-positive cells per counted area was consistently lower in the black spotting mouse embryo than that in the control mouse embryo (Fig 11C). In contrast, at this stage, theDct-lacZ-positive cells were hardly detected in the bw mouse [5]. Thus, the migration ability of neural crest cells is better retained in the black spotting mouse, compared to the bw mouse.
Fig 8. Expression of beta-catenin and cyclin D1 in the epidermis of the black spotting mouse. Immunohistochemical analysis of the epidermal regions taken from the control transgenic mouse (A, D), the bw mouse (B, E), and the white coat area of the black spotting mouse (C, F) for expression of beta-catenin (A —C) and cyclin D1 (D—F) (x 400). Shown are the images of the epidermal portions of the same tissue sections used inFig 7. The epidermal thickening is apparent in the bw mouse.
doi:10.1371/journal.pone.0150228.g008
Subsequently, at E15.5 (Fig 11A and 11B), theDct-lacZ-positive cells accumulated in restricted areas, while theDct-lacZ-positive cells were undetectable in other areas. In other words, certain groups of melanoblasts survived in the presumptive pigmented patches, and other groups of melanoblasts disappeared in the presumptive white coat areas. Thus, the fate of developing melanoblasts is determined by E15.5 in the black spotting mouse. In contrast, the
Dct-lacZ-positive cells disappeared by E13.5 in the bw mouse [5]. Such a difference in the fate of developing melanoblasts may reflect the fluctuation in the functional consequence of the LINE-1 insertion. At E17.5,Dct-lacZ-positive melanoblasts were easily detected as a cluster at
Fig 9. Expression of phosphorylated ERK1/2 and Ki-67 in hair follicles.Immunohistochemical analysis of the hair follicles of the control transgenic mouse (A, D), the bw mouse (B, E), and the black spotting mouse (C, F) for expression of p-ERK1/2 (A—C) and Ki-67 (D—F) (x 400). Shown are the images of the adjacent tissue sections used inFig 7.
doi:10.1371/journal.pone.0150228.g009
the presumptive pigmented patches (Fig 11B). These results suggest that melanoblasts can pro-liferate and differentiate into melanocytes in certain restricted areas of the black spotting
mouse, despite the LINE-1 insertion in itsMitfgene.
Aberrantly spliced Mitf-M transcripts expressed in the pigmented
patches
To explore the molecular basis for the formation of the black spotting phenotype, we per-formed the RT-PCR analysis using other primer set: exon-1M forward primer (Fp1) and
Fig 10. Expression of phosphorylated ERK1/2 and Ki-67 in the epidermis.Immunohistochemical analysis of the epidermal regions taken from the control transgenic mouse (A, D), the bw mouse (B, E), and the white coat area of the black spotting mouse (C, F) for expression of p-ERK1/2 (A—C) and Ki-67 (D—F) (x 400). Shown are the images of the epidermal portion of the same tissue sections used inFig 9.
doi:10.1371/journal.pone.0150228.g010
Fig 11. Formation of presumptive black patches in the black spotting mouse by E15.5.A. Shown are the X-gal staining images of homozygous black-spotting mouse embryos at the indicated embryonic days. The areas indicated with red square are enlarged and shown at right. At E12.5, melanoblasts are widely distributed in black spotting mice (a, b, c). At E15.5, melanoblasts are regionally accumulated (d). They are present (e) or absent (f), depending on the areas. At E17.5, sharply defined accumulation of melanoblasts is apparent (g, h), but melanoblasts are not present in other area (i). Scale bars: 1.2 mm in (a), (d) and (g), and 0.1 mm in others. B. A representative dorsal region is shown for each embryonic day. Inset shows schematic
exon-7 reverse primer (Rp7) (Fig 12). With this primer set, we were able to detect the aber-rantly spliced Mitf-M transcripts related to the LINE-1 insertion [8]. In the wild-type mouse skin, the PCR products were detected as a single band that represents authentic Mitf-M mRNA, whereas multiple PCR products were detected in the skin samples taken from the
sepa-rated pigmented patches of the black spotting mouse (Fig 12). Sequencing analysis revealed
that these PCR products represent (a) Mitf-M mRNA containing a LINE-1 segment of 104 bp, (b) authentic Mitf-M mRNA, (c) Mitf-M mRNA lacking exon 3 or exon 4, and (d) Mitf-M mRNA lacking both exon 3 and exon 4. These splicing products were identical to those
detected in the bw mouse brain [8]. These data reconfirm that the LINE-1 insertion is retained
in theMitfgene of the black spotting mouse, thereby excluding the possibility of the somatic
reversion. Importantly, the Mitf-M mRNA lacking the exon-4 sequence was shown to encode a
dominant-negative form of Mitf-M protein [8], because exon 4 encodes the transactivation
domain of Mitf [27]. Thus, the LINE-1 insertion may result in the decrease in the level of func-tional Mitf-M in melanoblasts and melanocytes at the pigmented patches of the black spotting
mouse, which may also account for the grayish tone of pigmented patches (seeFig 2). However,
the Mitf-M deficiency does not impair the development of melanoblasts in restricted areas of the black spotting mouse.
Age-related graying of pigmented patches
As described above, the black spotting mouse may provide a good model to study the pheno-typic consequence of the Mitf-M deficiency, prompting us to analyze the age-related changes
of black spots. As expected, the black spotting mouse shows apparent graying (Fig 13). By
about 6 months after birth, graying was noticeable, and by about 12 months, almost all hairs of the black spots turn to gray or white. These results suggest that melanocyte stem cells or mela-nocytes in the hair follicles at the black patches may be more vulnerable to certain aging-related events and thus these cells fail to survive. We have therefore proposed that the Mitf-M defi-ciency may lead to premature death of melanocyte stem cells or melanocytes in the hair follicles of the black spotting mouse. Alternatively, the phenotypic consequence of the LINE-1 insertion may vary with age.
Diluting effect of the
Mitf
mi-bwallele on the black spotting phenotype
To explore the inheritance of the black spotting phenotype, we crossed a male black spotting mouse with a female bw mouse or a female black spotting mouse with a male bw mouse. Irre-spective of the combination, all the offspring of black spotting mice mated with bw mice have
pigmented patches with diluted color, compared to those of black spotting mice (Fig 14A and
14B). In addition, the size of pigmented patches tends to be smaller in the heterozygous black
representation for the distribution of surviving melanoblasts, with the emphasis on the appearance of presumptive black patches at E17.5. Note that the drawing of each embryo does not reflect the actual image of the embryo at the indicated age. C. Difference in the number of X-gal-stained cells among C57BL/6J transgenic mouse embryos (control), black spotting mouse embryos (spotting), and bw mouse embryos at E12.5. The area used for cell counting is schematically shown with red square. Note that the tissue sections containing many Dct-lacZ-positive cells were selected from the black spotting mouse embryos at E12.5, whereas every tissue section contained a large number of Dct-lacZ-positive cells from control mouse embryos at E12.5 [5]. The Dct-lacZ-positive cell number/counted area is presented as mean±S.D. of at least three embryos, although the data were obtained with a semi-quantitative measure. The data of control mouse embryos and bw mouse embryos were taken from the published paper [5] and are shown for comparison. At E12.5, the number of developing melanoblasts was consistently lower in the black spotting mouse than that in control mouse.
doi:10.1371/journal.pone.0150228.g011
spotting mouse with bw mouse, compared to the patches seen in the homozygous offspring of
the black spotting mouse (Fig 14, bottom panels). Thus, the black spotting phenotype is diluted
in the presence of theMitfmi-bwallele; namely, the number of pigmented hair follicles is decreased in the offspring of the black spotting mouse mated with the bw mouse. We also crossed the black spotting mouse with the C57BL/6 mouse, yielding the offspring with black coat color that is indistinguishable from the C57BL/6 mouse (photos not shown). In conclu-sion, the black spotting phenotype is inherited in a semi-dominant manner for the bw pheno-type, whereas the black spotting phenotype appears to be inherited as a recessive trait for the white-coat phenotype.
Fig 12. Expression of aberrantly spliced Mitf-M transcripts at black patches of the black spotting mouse.The RT-PCR analysis was performed with the downstream reverse primer on exon 7 (Rp7). RNA was isolated from the skin of each mouse at the age of 30 days (P30). Exon 4 encodes an activation domain (AD). PCR products were detected as a single band with RNA from wild type mouse skin (WT). In two separate black patches from the black spotting mouse (P30), aberrantly spliced Mitf-M transcripts were detected in addition to authentic Mitf-M mRNA. The sizes of four major PCR products are 882 bp (product a), 778 bp (product b), 694 bp or 682 bp (product c), and 598 bp (product d). The product c contained two species of PCR products: the 694-bp band lacking exon 3 and the 682-bp band lacking exon 4. The predicted identity of the splicing products is shown at bottom: (a) Mitf-M mRNA containing a portion of LINE-1 (104-bp segment), (b) authentic Mitf-M mRNA, (c) Mitf-M mRNA lacking exon 3 or exon 4, and (d) Mitf-M mRNA lacking exon 3 and exon 4. The amplified region is shown in red.
doi:10.1371/journal.pone.0150228.g012
Fig 13. Age-dependent graying of pigmented hairs in the black patches.The black patches get gray with age. At 1 month after birth, black spotting mice have distinct black patches (A and B). By 5–8 months, the mice get more gray hairs (C and D), and by 12 months, most of hairs in the black patches turned white (E and F).
doi:10.1371/journal.pone.0150228.g013
Fig 14. Diluting effect of theMitfmi-bw
allele on the black spotting phenotype.Shown are the black spotting mice at postnatal day (P) 9.0 (A) and the offspring at P 9.0 of male black spotting mouse × female bw mouse (B). There is apparent difference in the color of the black spots between black spotting mice and (black spotting × bw) mice. Each representative mouse is shown at bottom. At P 18.0, the difference became clear; the black spotting offspring (left) has larger black patches, compared to the black patches of the offspring of black spotting mouse × bw mouse (right). In addition, the mouse of black spotting × bw has small black patches (right).
Discussion
Features of the grayish tone of pigmented hairs
The presence of non-pigmented hairs is responsible in part for the grayish tone of a black
patch of the black spotting mouse (Fig 2), which may reflect the lower number of developing
melanoblasts in the trunk region of the black-spotting mouse embryo at E12.5 (about 50%
reduction), compared to the control mouse embryo (Fig 11C). It is therefore conceivable that
follicular melanocytes may also decrease in their number even at a given black patch. In addi-tion, the amount of functional Mitf-M protein may be decreased in follicular melanocytes at a pigmented patch, because of the expression of aberrantly spliced Mitf-M transcripts, including the transcript encoding a dominant negative isoform lacking exon 4 (the activation domain) [8]. Taken together, these findings suggest that melanin production may be decreased in follic-ular melanocytes at a black patch of the black spotting mouse.
The early graying seen in the black spotting mouse is reminiscent of a recessive vitiligo mouse carrying theMitfvitallele [28]. TheMitfvitmouse was spontaneously arisen in the C57BL/6J strain and is characterized by the congenital white spotting on its black coat back-ground, associated with the age-related graying of the pigmented hairs [28]. In contrast, the black spotting phenotype was originally arisen in the bw mouse on the mixed C3;B6 back-ground [2]. TheMitfvitgene carries a single-base change that results in the Asp-to-Asn substi-tution at position 222 in the basic helix-loop-helix region [29], and theMitfvitmutation is expected to alter the function of all Mitf isoforms. Indeed, theMitfvitmutation appears to impair the cooperation with Lef-1 or other factors [22]. Thus, the pathogenesis for early gray-ing of theMitfvitmouse is the Mitf deficiency, which is essentially similar to that of the black spotting mouse.
Molecular basis of the black spotting phenotype
In this study, we are unable to clarify the molecular basis for the black spotting phenotype; namely, it remains to be investigated why the black spotting mouse could partly rescue melano-blasts during embryonic development. One possibility is that the black spotting mouse carries a mutation probably in a modifier gene that may support Mitf expression or attenuate the influence of L1 insertion on Mitf expression in developing melanoblasts. In this context, we have shown that the forced expression of Mitf-M in cultured neural tube isolated from E9.5 bw embryos increases the number of migrating neural crest cells and enhances the differentiation
of migrating melanoblasts [5]. Thus, the Mitf-M deficiency associated with the LINE-1
inser-tion reduces the migrainser-tion of neural crest cells from the neural tube and the differentiainser-tion of migrating melanoblasts. In fact, the expression level of Mitf-M mRNA is lower in bw mouse embryos than that in control mouse embryos at E11.5, and subsequently, it was undetectable at
E13.5 in bw mice [5]. Moreover, we have shown the enhanced apoptosis of bw melanoblasts
during embryonic development [5]. These results indicate that the critical level of Mitf-M is required for the survival of melanoblasts around E13.5. Thus, a certain population of melano-blasts can survive at E13.5 probably due to the increase in Mitf-M function of the black spot-ting mouse. The relevant mutation may assure the activity of Mitf-M that is very close to the threshold level for the melanoblast survival.
Moreover, we have shown the apparent differences in the epidermal phenotype between the
bw mouse and the black spotting mouse (Figs8and10). The bw mouse shows the thickened
keratinocyte layer with the higher expression of Ki-67 and the lower expression of cyclin D1, compared to the black spotting mouse. In fact, the nuclear expression of beta-catenin was not apparent in the bw keratinocytes (Fig 8). In other words, the epidermal features of the black
spotting mouse are similar to those of the control mouse. Thus, a gene mutation responsible for the black spotting phenotype may also influence the epidermal development. Alternatively, a certain environmental factor may cause an epigenetic change, such as histone modification, in the Mitf gene with L1 insertion. Further analyses are required, such as the sequencing the LINE-1 present in the black patches and high-density SNP genotyping. We would like to leave these issues for the future.
On the other hand, we have shown that the immunoreactive Mitf is expressed in projection neurons, mitral cells and tufted cells, of the wild-type mouse olfactory bulb, and the distribu-tion of these Mitf-expressing neurons was similar to that found in the bw mouse and the
con-trol transgenic mouse [13]. Moreover, the real-time RT-PCR analysis revealed the expression
of Mitf-M mRNA in the wild-type mouse olfactory bulb as well as in the bw mouse olfactory bulb, but not in the bw mouse eyeball [13]. These results suggest the regional difference in the functional consequence of the LINE-1 insertion between certain neurons and melanocytes located in the skin [5], inner ear [14,30] and retinal choroid [2]. Thus, understanding the molecular basis for the neuron-specific expression of Mitf will help us to identify the responsi-ble gene for the black spotting phenotype.
Implications of the black spotting mouse
We have shown that follicular melanocytes are responsible for maintaining the expression of beta-catenin in the hair follicle as well as for the keratinocyte homeostasis. Thus, the present study has provided evidence for the link between the epidermal microenvironment and mela-nocyte development/survival. Moreover, the presence of the black spotting mouse indicates the regional difference in the epidermal environment that may determine the Mitf-M expression level and the fate of melanocytes. Thus, the black spotting mouse provides a model system to study the molecular basis for dynamic changes in the functional consequence of the LINE-1 insertion. Lastly, the present study suggests the possibility that human diseases associated with LINE-1 insertion may present the phenotypic variability.
Acknowledgments
The authors thank Dr. Ryota Kusumi for his contribution to the early phase of the present study and Prof. Atsushi Higashitani, Graduate School of Life Sciences, Tohoku University, for his kind support to HH. We are grateful to Biomedical Research Core of Tohoku University Graduate School of Medicine for allowing us to use various facilities.
Author Contributions
Conceived and designed the experiments: KT HH KO HY SS. Performed the experiments: KT HH KO. Analyzed the data: KT HH KO HY SS. Contributed reagents/materials/analysis tools: KT HH HY. Wrote the paper: KT HY SS. Obtained funding: KT SS.
References
1. Thomas CA, Paquola ACM, Muotri AR. LINE-1 Retrotransposition in the Nervous System. Annu Rev Cell Dev Biol. 2012; 28: 555–573. doi:10.1146/annurev-cellbio-101011-155822PMID:23057747 2. Yajima I, Sato S, Kimura T, Yasumoto K, Shibahara S, Goding CR, et al. An L1 element intronic
inser-tion in theblack-eyed white(Mitfmi-bw) gene: the loss of a single Mitf isoform responsible for the pigmen-tary defect and inner ear deafness. Hum Mol Genet. 1999; 8: 1431–1441. PMID:10400990
3. Hodgkinson CA, Moore KJ, Nakayama A, Steingrímsson E, Copeland NG, Jenkins NA, et al. Mutations at the mouse microphthalmia locus are associated with defects in a gene encoding a novel basic-helix-loop-helix-zipper protein. Cell 1993; 74: 395–404. PMID:8343963
4. Hughes MJ, Lingrel JB, Krakowsky JM, Anderson KP. A helix-loop-helix transcription factor-like gene is located at the mi locus. J Biol Chem. 1993; 268: 20687–20690. PMID:8407885
5. Hozumi H, Takeda K, Yoshida-Amano Y, Takemoto Y, Kusumi R, Fukuzaki-Dohi U, et al. Impaired development of melanoblasts in the black-eyed whiteMitfmi-bw
mouse, a model for auditory-pigmentary disorders. Genes Cells 2012; 17: 494–508. doi:10.1111/j.1365-2443.2012.01603.xPMID:22563733
6. Motohashi H, Hozawa K, Oshima T, Takeuchi T, Takasaka T. Dysgenesis of melanocytes and cochlear dysfunction in mutant microphthalmia (mi) mice. Hearing Res. 1994; 80: 10–20.
7. Silvers WK. The Coat Colors of Mice—A Model for Mammalian Gene Action and interaction. New York, NY: Springer-Verlag; 1979.
8. Takeda K, Hozumi H, Nakai K, Yoshizawa M, Satoh H, Yamamoto H, et al. Insertion of long inter-spersed element-1 in the Mitf gene is associated with altered neurobehavior of the black-eyed white Mitfmi-bwmouse. Genes Cells 2014; 19: 126
–140. doi:10.1111/gtc.12117PMID:24304702 9. Fuse N, Yasumoto K, Suzuki H, Takahashi K, Shibahara S. Identification of a melanocyte-type
pro-moter of the microphthalmia-associated transcription factor gene. Biochem Biophys Res Commun. 1996; 219: 702–707. PMID:8645245
10. Amae S, Fuse N, Yasumoto K, Sato S, Yajima I, Yamamoto H, et al. Identification of a novel isoform of microphthalmia-associated transcription factor that is enriched in retinal pigment epithelium. Biochem Biophys Res Commun. 1998; 247: 710–715. PMID:9647758
11. Takeda K, Adachi T, Han F, Yokoyama S, Yamamoto H, Hida W, et al. Augmented chemosensitivity in black-eyed white Mitfmi-bwmice, lacking melanocytes. J Biochem. 2007; 141: 327
–333. PMID:
17202193
12. Takeda K, Takahashi NH, Shibahara S. Neuroendocrine functions of melanocytes: Beyond the skin-deep melanin maker. Tohoku J Exp Med. 2007; 211: 201–221. PMID:17347546
13. Ohba K, Takeda K, Yamamoto H, Shibahara S. Microphthalmia-associated transcription factor is expressed in projection neurons of the mouse olfactory bulb. Genes Cells 2015; 20: 1088–1102. doi:
10.1111/gtc.12312PMID:26522736
14. Uehara S, Izumi Y, Kubo Y, Wang CC, Mineta K, Ikeo K, et al. Specific expression of Gsta4 in mouse cochlear melanocytes: a novel role for hearing and melanocyte differentiation. Pigment Cell Melanoma Res. 2009; 22: 111–119. doi:10.1111/j.1755-148X.2008.00513.xPMID:18983533
15. Mackenzie MA, Jordan SA, Budd PS, Jackson IJ. Activation of the receptor tyrosine kinase Kit is required for the proliferation of melanoblasts in the mouse embryo. Dev Biol. 1997; 192: 99–107. PMID:9405100
16. Fuse N, Yasumoto K, Takeda K, Amae S, Yoshizawa M, Udono T, et al. Molecular cloning of cDNA encoding a novel microphthalmia-associated transcription factor isoform with a distinct amino-terminus. J Biochem. (Tokyo) 1999; 126: 1043–1051.
17. Tsukiji N, Nishihara D, Yajima I, Takeda K, Shibahara S., Yamamoto H Mitf functions as an in ovo regu-lator for cell differentiation and proliferation during development of the chick RPE. Dev Biol. 2009; 326: 335–346. doi:10.1016/j.ydbio.2008.11.029PMID:19100253
18. Nishihara D, Yajima I, Tabata H, Nakai M, Tsukiji N, Katahira T, et al. Otx2 is involved in the regional specification of the developing retinal pigment epithelium by preventing the expression of Sox2 and
Fgf8, factors that induce neural retina differentiation. PLoS One 2012; 7(11):e48879. doi:10.1371/ journal.pone.0048879PMID:23145006
19. Eastman Q, Grosschedl R. Regulation of LEF-1/TCF transcription factors by Wnt and other signals. Curr Opin Cell Biol. 1999; 11: 233–240. PMID:10209158
20. DasGupta R, Fuchs E. Multiple roles for activated LEF/TCF transcription complexes during hair follicle development and differentiation. Development 1999; 126: 4557–4568. PMID:10498690
21. Osawa M. Melanocyte stem cells. 2009 Jun 30. In: StemBook [Internet]. Cambridge (MA): Harvard Stem Cell Institute; 2008-. Available from:http://www.ncbi.nlm.nih.gov/books/NBK27077/
22. Yasumoto K, Takeda K, Saito H, Watanabe K, Takahashi K, Shibahara S. Microphthalmia-associated transcription factor interacts with LEF-1, a mediator of Wnt signaling. EMBO J. 2002; 21: 2703–2714. PMID:12032083
23. Schepsky A, Bruser K, Gunnarsson GJ, Goodall J, Hallsson JH, Goding CR, et al. The microphthalmia-associated transcription factor Mitf interacts with beta-catenin to determine target gene expression. Mol Cell Biol. 2006; 26: 8914–8927. PMID:17000761
24. Zhao S, Overbeek PA. Tyrosinase-related protein 2 promoter targets transgene expression to ocular and neural crest-derived tissues. Dev Biol. 1999; 216: 154–163. PMID:10588869
25. Hornyak T.J., Hayes D.J., Chiu L.Y., Ziff E.B. (2001) Transcription factors in melanocyte development: distinct roles for Pax-3 and Mitf.Mech.Dev. 101, 47–59. PMID:11231058
26. Steel KP, Davidson DR, Jackson IJ. TRP-2/DT, a new early melanoblast marker, shows that steel growth factor (c-kit ligand) is a survival factor. Development 1992; 115: 1111–1119. PMID:1280558
27. Sato S, Roberts K, Gambino G, Cook A, Kouzarides T, Goding CR. CBP/p300 as a co-factor for the Microphthalmia transcription factor. Oncogene 1997; 14: 3083–3092. PMID:9223672
28. Lerner AB, Shiohara T, Boissy RE, Jacobson KA, Lamoreux ML, Moellmann GE. A mouse model for vitiligo. J Invest Dermatol. 1986; 87:299–304. PMID:3525691
29. Steingrímsson E, Moore KJ, Lamoreux ML, Ferre DAAR, Burley SK, Zimring DC, et al. Molecular basis of mouse microphthalmia (mi) mutations helps explain their developmental and phenotypic conse-quences. Nat Genet. 1994; 8: 256–263. PMID:7874168
30. Watanabe K, Takeda K, Yasumoto K, Udono T, Saito H, Ikeda K, et al. Identification of a distal enhancer for the melanocyte-specific promoter of the MITF gene. Pigment Cell Res. 2002; 15: 201– 211. PMID:12028584