❊♥s❛✐♦s ❊❝♦♥ô♠✐❝♦s
❊s❝♦❧❛ ❞❡
Pós✲●r❛❞✉❛çã♦
❡♠ ❊❝♦♥♦♠✐❛
❞❛ ❋✉♥❞❛çã♦
●❡t✉❧✐♦ ❱❛r❣❛s
◆◦ ✶✵✹ ■❙❙◆ ✵✶✵✹✲✽✾✶✵
❇r❛③✐❧✐❛♥ ❊①♣❡r✐❡♥❝❡ ❲✐t❤ ❊①t❡r♥❛❧ ❉❡❜t ❛♥❞
Pr♦s♣❡❝ts ❢♦r ●r♦✇t❤
❋❡r♥❛♥❞♦ ❞❡ ❍♦❧❛♥❞❛ ❇❛r❜♦s❛✱ ▼❛♥✉❡❧ ❙❛♥❝❤❡③ ❞❡ ▲❛ ❈❛❧
❖s ❛rt✐❣♦s ♣✉❜❧✐❝❛❞♦s sã♦ ❞❡ ✐♥t❡✐r❛ r❡s♣♦♥s❛❜✐❧✐❞❛❞❡ ❞❡ s❡✉s ❛✉t♦r❡s✳ ❆s
♦♣✐♥✐õ❡s ♥❡❧❡s ❡♠✐t✐❞❛s ♥ã♦ ❡①♣r✐♠❡♠✱ ♥❡❝❡ss❛r✐❛♠❡♥t❡✱ ♦ ♣♦♥t♦ ❞❡ ✈✐st❛ ❞❛
❋✉♥❞❛çã♦ ●❡t✉❧✐♦ ❱❛r❣❛s✳
❊❙❈❖▲❆ ❉❊ PÓ❙✲●❘❆❉❯❆➬➹❖ ❊▼ ❊❈❖◆❖▼■❆ ❉✐r❡t♦r ●❡r❛❧✿ ❘❡♥❛t♦ ❋r❛❣❡❧❧✐ ❈❛r❞♦s♦
❉✐r❡t♦r ❞❡ ❊♥s✐♥♦✿ ▲✉✐s ❍❡♥r✐q✉❡ ❇❡rt♦❧✐♥♦ ❇r❛✐❞♦ ❉✐r❡t♦r ❞❡ P❡sq✉✐s❛✿ ❏♦ã♦ ❱✐❝t♦r ■ss❧❡r
❉✐r❡t♦r ❞❡ P✉❜❧✐❝❛çõ❡s ❈✐❡♥tí✜❝❛s✿ ❘✐❝❛r❞♦ ❞❡ ❖❧✐✈❡✐r❛ ❈❛✈❛❧❝❛♥t✐
❞❡ ❍♦❧❛♥❞❛ ❇❛r❜♦s❛✱ ❋❡r♥❛♥❞♦
❇r❛③✐❧✐❛♥ ❊①♣❡r✐❡♥❝❡ ❲✐t❤ ❊①t❡r♥❛❧ ❉❡❜t ❛♥❞ Pr♦s♣❡❝ts ❢♦r ●r♦✇t❤✴ ❋❡r♥❛♥❞♦ ❞❡ ❍♦❧❛♥❞❛ ❇❛r❜♦s❛✱
▼❛♥✉❡❧ ❙❛♥❝❤❡③ ❞❡ ▲❛ ❈❛❧ ✕ ❘✐♦ ❞❡ ❏❛♥❡✐r♦ ✿ ❋●❱✱❊P●❊✱ ✷✵✶✵ ✭❊♥s❛✐♦s ❊❝♦♥ô♠✐❝♦s❀ ✶✵✹✮
■♥❝❧✉✐ ❜✐❜❧✐♦❣r❛❢✐❛✳
PROSPECTS FOR GROWTH
Fernando de Holanda Barbosa** Manuel Sanchez de la Cal***
1. Introduction
The developing country’s negotiations of its external debt with creditor countries, and in particular with the international banking system, have been conducted within a context in which several devices have been utilized in order i) to reschedule the cash-flow of the debt service and ii) to reduce the actual value of the debt. These negotiations have paid much more attention to the cash-flow problem than to the actual value of the debt.
Several economists and political analysts of the problem created by the external debt crisis have stated that the economic growth process of the developing countries will in future years depend a substantial reduction of the actual value of the debt, that is a partial default or some form of the debt relief.
This paper attempts to analyze this argument for the Brazilian economy, by using a simple dynamic model that takes into account the state-of-the-art of the Brazilian external debt as well as different alternatives for the negotiation process. This paper also provides some historical background with the main facts that characterized the Brazilian process of increasing its external debt, from the beginning of the 70’s up to the recent moratorium.
2. Evolution of Brazil’s External Debt
The Brazilian net external debt grew fifteen time between 1973 and 1985, from 6.2 to 90.3 billion U.S. dollars. The 1973/79 period is where we observe the highest rate of growth for the external debt, when it rose from 6.2 to 40.2 billion dollars, a rate of growth of 550 percent. Between 1979 and 1982 it rose 64 percent, and from the 1982 crisis up to 1985 the net external debt increased 36.5 percent.
The average rate of interest on the external debt was approximately 8.5 percent per year between 1973 and 1978. From 1979 the rate of interest gradually starts to increase, reaching a peak of 17.1 percent in 1982 and the declining to 10.6% in 1985. The real rate of interest was very low, or even negative, during the 1973/79 period, became positive in 1982, and since then has given no sign that will return to its previous level.
The net debt/export ratio was 99 percent in 1973, has grown steadily during the whole period and reached 3505 in 1985. The debt service (interest plus amortization) required 42 percent of Brazilian exports in 1973, was below the 70% mark until 1981, increased to almost 100% in 1982, and then declined to 78% in 1985.
*
Paper prepared for presentation at the Economic Development and the World Debt Problem Conference, Zagreb, Yugoslav, September 8-11, 1987.
Table 1
Brazilian External Debt (millions of US dollars) (percent)
Year Gross
External Debt
International Reserves
Net External Debt
Net Interest Average Rate of Interest
Inflation Rate
Net Debt Exports
Services Exports
Net Debt GOP
1973 12.572 6.416 6.156 514 8,3 13,1 99 42 7,7
1974 17.166 5.269 11.897 652 8,4 18,9 150 33 11,3
1975 21.171 4.040 17.131 1.498 8,7 9,2 198 42 13,9
1976 25.985 6.544 19.441 1.810 9,3 4,6 192 48 12,8
1977 32.037 7.256 24.781 2.103 8,5 6,4 204 51 14,1
1978 43.511 11.895 31.616 2.696 8,5 7,8 250 64 15,8
1979 49.904 9.689 40.215 4.186 10,4 12,5 264 70 17,9
1980 53.847 6.913 46.934 6.311 13,4 14,0 233 65 19,6
1981 61.411 7.507 53.904 9.161 17,0 9,0 231 72 20,3
1982 70.198 3.994 66.204 11.353 17,1 2,1 328 97 24,8
1983 81.319 4.563 76.756 9.555 12,4 3,2 351 90 37,7
1984 91.091 11.995 79.096 10.203 12,9 4,3 293 67 37,4
External Debt with Foreign Commercial Banks
Currency Loans
Year Resolution nº 63 Law nº 4131 Total*
1973 2398 5.379 7.777
1974 3319 7.823 11.142
1975 3734 10.781 14.515
1976 4715 13.438 18.153
1977 5240 16.262 21.502
1978 7273 22.200 29.473
1979 7723 26.883 34.606
1980 9924 27.887 37.811
1981 13456 31.520 44.976
1982 16146 36.763 52.909
1983 15115 44.511 59.626
1984 13630 52.830 66.460
1985 12052 53.619 65.671
Source: Central Bank of Brazil
* Excludes suppliers’ and buyer’s credits provided by foreign commercial banks.
The next external debt/gross domestic product ratio was around 7.7% in 1973, has frown gradually during the whole period, and in 1985 the next external debt was equal to 40 percent of the gross Brazilian product.
Since the first oil shock the international banking system has assumed a very important role in financing the balance of payments deficits of developing countries. Table 2 shows de evolution of the currency loans made by the commercial banks to Brazil, according to the two possibilities available to the Brazilian economy. Currency loans, according to the criteria established by Law nº 4131, the law that rules foreign capital in Brazil, can be arranged by nonfinancial firms located in Brazil, while the currency loans under central bank Executive Resolution nº 63 are made by Brazilian resident banks, in order to lend to their customers. Currency loans represented 72.7 percent of Brazilian net external debt in 1985, and more than 100% in 1973.
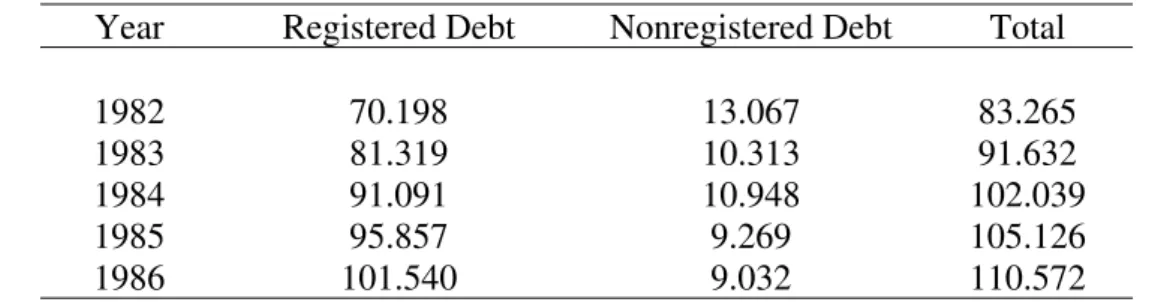
The external debt of Table 1 is the registered debt in the Central Bank of Brazil, which involves all medium term and long run debt, defined as those that have maturity of at least one year. All these debts are required to be registered with the Central Bank. Since 1982 this institution has gathered data on the Brazilian short run debt, which is named nonregistered debt. This type of debt has declined since 1982. It represented 18.6 percent of the registered debt in 1982, and in 1985 it decreased to 8.0 percent.
4 Table 3
Foreign Registered and Nonregistered Debt*
Year Registered Debt Nonregistered Debt Total
1982 70.198 13.067 83.265
1983 81.319 10.313 91.632
1984 91.091 10.948 102.039
1985 95.857 9.269 105.126
1986 101.540 9.032 110.572
Source: Central Bank of Brazil
* Registered Debt = medium and long term external debt. Nonregistered Debt = short term external debt.
Table 4
Variable Rate
Year Prime Libor Other Fixed Rate
1983 6.2 68.2 0.8 24.8
1984 15.1 59.2 4.2 21.5
1985 22.1 48.7 7.1 22.1
1986 17.1 50.4 10.4 22.1
The conversion of the external debt into direct investment has been going on in the Brazilian economy since the 70’s when some fiscal incentives were created to stimulate such a procedure. Table 5 shows the evolution of such conversions since 1978. In 1978 and 1979, 160 and 207 million US dollars were converted. In 1980 and 1981 there was a substantial reduction in the amount converted. From 1982 the volume of debt equity swaps began to increase, reaching a peak of 746 million dollars in 1984,declining to 581 million dollars in 1985 and 220 million dollars in 1986. On November 1984, the Central Bank of Brazil, through Circular Letter nº 1125, created new rules for equity debt swaps, establishing that only intercompany loans and financing institution credits that were not previously negotiated in the secondary market could be converted in to direct investment. This rule blocked foreign investors from buying Brazilian debt with a discount in the secondary market and registering their investment at face value. Recently (in July 1987) the Central Bank of Brazil suspended all conversions, since a new policy is forthcoming.
It is interesting to point out that debt equity swaps have represented (with the exceptions of 1980 and 1981) a high proportion of the net flow of foreign capital in Brazil, whose average rate of remittance is below 5 percent per year.
Foreign Direct Investment
Year Net Investment
Flow
Debt Equity Swap
Stock of Foreign Investment
Average Remitance Rate
(percent)
1978 1 071 160 13 740
1979 1 490 270 15 963 4.6
1980 1 121 39 17 480 1.9
1981 1 584 2 19 247 2,1
1982 991 143 21 176 3,0
1983 664 452 22 302 3,6
1984 1 077 746 22 844 3,6
1985 720 581 25 665 4,6
1986 -115 220 n.a. 4,8
Source: Central Bank of Brazil (apud Correa do Lago)
Table 6
Secondary Market Brazil Debt Prices (Cents/US$)
Year Price
1980-1985 80
1985 (April) 78
1985 (August) 77
1986 (February) 76
1986 (April) 75
1986 (December) 75
1987 (February) 70
1987 (March) 65
1987 (April) 65
1987 (September) 45
Source: SFD, New York
One important characteristic of the Brazilian external indebtedness is that a fraction of our debt with commercial banks is due to foreign branches of Brazilian banks. The registered external debt with Brazilian banks abroad was 7.0 billion dollars in 1982, and the nonregistered debt was equal to 0.8 billion dollars at the end of the same year. Table 7 shows the external debt with branches of Brazilian banks for the period 1981/86.
Several Brazilian commercial banks, both private and government-owned, opened a great number of branches abroad during the 70’s, due to the exceptional international market conditions.1 Most of the funding of these banks was made at the interbanking
1
The number of branches of Brazilian commercial banks abroad, according to Central Bank of Brazil, were the following:
6
market for shorts periods of time (even overnight) and then lent to Brazilian firms at medium term and long run. The sudden breakdown of the international markets in 1982 brought a liquidity crisis for those banks, because they borrowed short and lent long. In the Brazilian negotiation process a special mechanism hand to be devised to relieve those banks.
Table 7
External Debt with Branches of Brazilian Banks
US$ million
Year Registered Nonregistered Total Total Brazilian Banks
Foreign Commercial Banks
1981 6,035 1,570 7,605 15.2
1982 6,963 820 7,783 13.3
1983 7,355 619 7,974 12.4
1984 7,479 801 8,280 11.7
1985 7,640 630 8,270 12.1
1986 7,450 325 7,775 11.1
Source: Central Bank of Brazil
3. An Overview of the Brazilian Economy: 1974/87
The Brazilian economy presents a very rich and broad experience during the 1974/87 period. In this overview we wish to highlight some points that are closely connected with the external indebtedness process: the external shocks and the economic policy responses to those shocks.
Table 8 tries to summarize the recent economic experience from this perspective. At the beginning of the 1974/79 period the Brazilian economy was hurt by external shocks, mainly the oil shock, and economic policy was managed quite reasonably within the adopted strategy. During 1979/82 the Brazilian economy was in extremely bad shape due to a chain of external shocks and gross mismanagement of economic policy.
From 1983 to 1985 there was no external shocks and the Brazilian government adopted an adjustment program under IMF supervision, which started to yield some results in 1984, with recovery taking place in 1985.
During the period 1985(IV)87 the Brazilian economy was not hit by external shocks; on the contrary it actually benefited from lower international rate of interest and oil prices. Even so it endured a process of gross mismanagement of economic policy, bearing social costs that are still to be accounted for.
External Shock x Economic Policy
External Shocks
Yes No
Gross No 1974/79 1983/85
Mismanagement
of Economic Policy Yes 1979/82 1985/87
Debt-cum-growth Strategy: 1974/7
We choose to begin our analysis of the Brazilian external indebtedness process in 1973, because this year is one of transition into a new era in our recent economic history.
During 1967/72 the external sector had a very good performance. Both exports and imports grew at high rates, with small trade balances, and the net external debt in 1972 was 4 billion US dollars. This period became known as the ‘economic miracle” epoch, because gross domestic product grew at an average rate over 10 percent per year.
In 1973 the Brazilian economic setting began to change. The main event was the fourfold increase of the oil price. However, it should be pointed out that imports increased $ 6 billion in 1974, (100% in relation to 1973), and oil imports accounted for only one third of that amount.
The adverse change in the terms of trade and the decrease in the rate of growth of industrialized countries’ imports contributed to bring about a change in the rate of growth of our exports.
The economic policy response of the Brazilian government was to enact a very ambitious plan, the 2nd National Development Plan, based on large public and private projects, with emphasis on promoting the capital goods and basic raw materials industries. The option for this growth strategy became possible due to the availability of external financing through the international banking system.
The investment rate during 1974/79 was, on average, about 22.5 percent of gross domestic product. The Brazilian economy grew at an average rate of 7.0 percent, while the industrialized countries’ average rate of growth was 2 percent per year.
The other side of the coin was the rapid growth of the external debt. The current account was in deficit during the whole period, standing at $ 1.6 billion in 1973 and an average of $ 6.0 billion during the rest of the period. The external debt grew at an average rate of 28.2 percent between 1973 and 1978.
The inflation rate stood at 15-20 percent per year during 1967/73, and then increases to a new plateau, a little below the 40 percent per year mark, during 1974/78. This raise was due to an excessive monetary expansion in 1973, as a result of increasing international reserves, and the following accommodation of monetary policy since 1974.
The commercial policy adopted after 1974 was made up of night tariffs; a compulsory deposit on imports for one year, without payment or interest and no allowance for inflation; prohibition of importing goods considered to be superfluous; and quantitative restrictions on imports by state owned enterprises.2 The exchange rate policy followed the crawling-peg system introduced in 1968, and the purchasing power parity rule.
2
8
Gross Mismanagement of Economic Policy and External Shocks: 1979/82
The 1979/82 period was very unfavorable for the Brazilian economy because, besides being hit by several external shocks, economic policy reacted in the wrong way, making an already difficult situation even worse.
With the second oil shock in 1974, the average price of oil increased from $ 13.76 per barrel in 1978 to $ 22.46 in 1979 and $ 33.72 in 1980. The Brazilian economy was, and still is a very closed economy, with a degree of openness around 10 percent. Consumer goods imports in 1979 represented just 10 percent of total imports, while 90 percent was made up of capital goods and raw materials. The oil import bill increased from $ 2.5 billion in 1974 to $ 6.3 billion in 1979, representing in the latter 35 percent of total imports. The degree of maneuver with this level and structure of Brazilian imports is very narrow. In order to cut imports in the short run one has to diminish the level of output and decrease the rate of economic growth. The short run adjustment pays a very high price in terms of output losses.
Table 9
Structure of Brazilian Imports (percent)
Selected Years Consumer Goods Capital Goods Raw Materials
Durables Non-Durables
1973 5,78 6,64 35,47 50,73
1974 3,96 4,98 25,38 64,87
1979 3,09 7,03 21,98 67,83
1984 1,47 2,88 16,64 79,00
1985 2,08 3,64 20,39 73,85
1986 2,99 11,88 26,79 58,30
Source: Cacex
The second external shock that happened during this period was thr falling of the terms of trade. Exports prices declined, while the price of imported capital goods and raw materials rose.
The third adverse shock that affected the Brazilian economy was the world recession, which had a big impact on our exports.
The fourth external shock that occurred was the sudden and unexpected increase in the international rate of interest, due to the American monetary-fiscal mix policies.
The fifth shock was the breakdown of the international financing market for the indebted developing countries in the second semester of 1982.
Given such unfavorable picture, economic policy provoked the last shock that created a turmoil in the Brazilian economy. At the beginning of the Figueiredo Government, the Planning Minister wanted to promote an adjustment, because the debt-cum-growth strategy was no longer viable. This new strategy would reduce, in the short run, the rate of GDP growth. Several economists, within and outside the government, were against this strategy.
“miracle” period, began to put his ideas in practice.
A new wage policy was introduced in November 1979, with readjustment at each six-month interval, based on the rate of inflation during the last six-months, whereas the old policy had yearly readjustment. The principle behind this new policy was to reach the previous peak instead of the average real wage as before. Wages below tem minimum wages received a bonus of 10 percent of the inflation rate. The workers became shareholders of inflation.
In December 1979, the cruzeiro was devaluated 30 percent. Suddenly, in January 1980, it was announced by the Government that the rate of devaluating during 1980 was prefixed at 40 percent. This measure tried to change the rate of inflation expected by the private sector. However, monetary and fiscal policies were too loose and inconsistent with the government’s inflation target.
The end result of this package was to provide a boom and real GDP grew 7.2 percent in 1980. The inflation rate then rose from 77.2 percent in 1979 to more than 100 percent in 1980.
Economic theory teaches that a real exchange-rate devaluation in a wage-indexed economy yields only more inflation. The facts confirmed theory once again.
Absorption was greater than output, creating a huge balance of payment deficit that had to be financed by lowering international reserves. The prefixing of the exchange rate had to be given up in the middle of 1980, with an additional tax on imports, and the comeback of several exports subsidies which had been abolished at the time of the 1979 maxidevaluation. The level of international reserves declined $ 3 billion. The balance of payments situation at the end of 1980 and the beginning of 1981 was near collapse.
The private sector was not willing to borrow abroad, being afraid of a new maxidevaluation. The government then introduced a credit ceiling for use of domestic funding by the banking system. This measure obliged Brazilian firms to borrow abroad. The currency loans under Resolution nº 63 grew at a rate of 35 percent between 1981 and 1980.
Economic policy changed 180 degree in 1981, with a tight monetary policy and a loose fiscal policy. The real rate of interest grew to a very high level, and the conditions were created for the first Brazilian recession during the post-war period, with real GDP declining 1.6 percent in 1981.
The balance of payments situation was becoming worse in the second semester of 1982, with a declining rate of currency loans flow. The crisis hit its peak with the Mexican moratorium and the breakdown of the international financing system. The year of 1982, when real GDP grew just 0.9 percent and the inflation rate was around 100 percent, was an election year. The government waited for the day following election day to come up with a new economic program.
Adjustment Under IMF: 1983/85
During the last quarter of 1982, the level of Brazilian international reserves was critical. The American Treasury, The Bank for International Settlements and the international banking community put together a rescue operation in order to help the Brazilian government. Meanwhile, a short run plan was being prepared to reschedule the Brazilian external debt.
10
technical details were agreed upon in a few weeks. The Brazilian government then, wrote, the first letter of intent to the IMF Managing Director.
The 1982 December package included a reschedule plan with the commercial banks, in four items that were named Projects I, II, III and IV. By Project I the commercial banks would lend $ 4.4 billion in a new money; Project II was able to reschedule $ 4.6 billion of amortizations that were due during 1983; by Project III the commercial banks agreed to maintain the short commercial credit lines for financing Brazilian exports and imports at the level of $ 8.8 billion; and Project IV tried to keep the interbanking deposit level of $ 9.4 billion at the Brazilian commercial branches.
As is well known, a precondition for an IMF agreement is an exchange-rate devaluation. In the Brazilian case the Fund staff accepted a devaluation rule for 1983 that stipulated a 1 percent monthly rate of real devaluation, besides the traditional performance criteria with regard to domestic credit ceiling, public deficit and balance of payments target. At the beginning of 1983 the trade balance gave clear signs that it would be very difficult to reach the balance of payments target. As a follow-up of this prediction, the cruzeiro was devaluated 30 percent in February of 1983, and a new letter of intent had to be written because this maxidevaluation changed all performance criteria established so far. The first letter had not yet been appreciated by the IMF Board, while the second one was already being prepared.
The outcome of this cruzeiro maxidevaluation, with tight monetary and fiscal policies, and a partial wage desindexation, was a very sharp and swift improvement of the trade balance, reaching a monthly $ 1 billion balance by the end of 1983. On the other hand, the inflation rate accelerated rising from 100 percent per year to a new plateau of 200 percent per year during the three following years (1983/85). Real GDP declined 3.6 percent in 1983, in the worst recession of the Brazilian economy in the second post-war period.
The fact that several performance criteria were not accomplished by the Brazilian government resulted in seven letters of intent being written in the short interval of two years. The fault for this prolixity should be credited to both parties. The IMF staff shares part of the guilt because they did not take into account the fact that the Brazilian economy had a very high degree of indexation. On the other hand, the Brazilian government was not able to show that the performance criteria agreed upon were not consistent. Table 10 gives some indicators of the IMF adjustment program. It is easy to verify that the balance of payments target were, in general, reached. However, the same did not occur with the public deficit and inflation figures.
In the second semester of 1983 another reschedule package with the commercial banks was arrived at, this time for 1984.
This package had the same format as the previous one, with Projects I, II, III, and IV named Project A, B, C and D3. Project A gave $6.5 billion in new money, with a spread rate above LIBOR declining from 2.125% to 2.0% per year. Project B reschedule $5.4 billion or amortization due in 1984, for 9-year and 5-year grace period, with commission rate fees fixed at 3.0 percent (spread of 2.0 percent and flat fee of 1.0 percent) above LIBOR, whereas Project II this rate was 3.625 percent (spread of 2.125 percent and flat fee of 1.5 percent) per year. By project C the short-run commercial credit lines were preserved at a level of $9.8 billion. The interbanking deposits with foreign branches of Brazilian commercial banks were maintained at $5.4 billion by project D.
3
Brazilian Adjustment Program under IMF: Some Indicators
1982 1983 1984
Item Predicted
Value
Actual Value
Predicted Value
Actual Value
Trade Balance* 0.8 6.0 6.5 8.0 13.1
Current Account* -14.7 -7.0 -6.1 -5.0 0.6
Balance of Payments*
Deficit(-)or Superavit(+) -8.9 0 -3.3 1.0 7.0
PSBR/GDP (%) 15.8 7.9 18.6 5.0 20.5
Rate of growth of Real
GDP (%) 0.9 -3.5 -3.2 2.0 4.5
Inflation (%) 99.0 70.0 211.0 40.0 223.8
* billion of U.S. dollars Source: Marques (1987)
The Magic Kingdom of Heterodoxy: 1985/87
The end of the military regime in March 1985 began with the tragedy of the death of President elect Tancredo Neves. He had made a partition of government jobs, even for the lower ranks, among different groups that supported his candidacy for the Presidency. Tancredo Neves had reserved the Minister of Finance post for someone that he personally could trust. Thus, a nephew of his with experience in public financing was appointed for that job.
For the Planning Ministry was appointed an economist from the PMDB party of São Paulo. After the death of Tancredo Neves the Vice-President became President for the rest of the six-year mandate, and the entire ministry was maintained.
During the following five months the two most important economic ministry did not agree upon economic policy. The Finance Minister imposed a very tight monetary policy and a controlled price system that was unfavorable to the state owned enterprises. The Planning Minister criticized such policies, arguing that the public deficit was increasing due to the rise of internal public debt service as a result of raising interest rates and also because price control was lowering the state enterprise receipts. Economists from the Finance Ministry would reply by stating that the public deficit was increasing due to expansion of federal government expenditure. The imbroglio was finally solved with the Minister of Finance’s resignation.
The new Finance Minister, an industrialist from São Paulo state, began by changing monetary policy, increasing the rate of expansion of highpowered money and decreasing interest rates. This loose monetary policy, plus an agricultural price shock due to bad harvests at the end of the year, caused an increase in the inflation rate during the first two months of 1985.
At the end of 1985, in order to solve the public deficit problem, a fiscal package was sent by the government and then approved by the Congress. The two major points of this package were the following: i) a complete indexation of the tax system and ii) a decrease in lag collections for a few key taxes.
12
inflation was 100 percent inertial: it simply reproduced itself due to the indexation system. Those economists, who called themselves ‘heterodox’, believed that the proper way to combat inflation was to put an end to the indexation system with a price freeze and a monetary reform with a conversion rule between the old and the new money to avoid transferences between debtors and creditors, and to fix the exchange rate, thus anchoring the system. This program to end inflation through a shock treatment was being prepared by economists connected with the Planning Minister.
At the beginning of 1986, when the Finance Minister perceived that he had lost control over the inflation, he made up his mind and opted for the ‘heterodox shock’. On February 28 the Cruzado Plan was announced.
Popular support for this Plan was enormous, without precedent in Brazilian economic history. During the first few months government economists believed that Brazil had become a mixture of Switzerland, with low rates of inflation, and Japan, with high rates of growth. The dream did not come true as events unfolded.
Due to staggered wage readjustment, nominal wages were converted to the new money, the cruzado, based on their real average value. On the top of that was added a bonus of 16 percent for the minimum wage and 8 percent for other salaries.
Monetary policy was conducted on the assumption that the expected rate of inflation of the new money was nearly zero; during the first three months highpowered money increased 66 percent. Public deficit, according to government officials, was under control. But the truth of the matter came out later on, and the figures showed that the public deficit was increasing.
The outcome of all these factors was a boom, the price control began disfunctioning after three months, absorption was greater than output, international reserves were being drained in order to pay for imports (even of consumer goods that were not allowed in the country before), exports declined, and the $1 billion monthly trade surplus became a trade deficit by October, 1986.
After two attempts through fiscal measures to control demand, the Cruzado Plan resulted in a tremendous failure. In the first quarter of 1987, inflation came back with rates that broke records in Brazilian history, and the picture was ready for a stagflation process.
The moratorium of February 1987, when interest payments to commercial banks were interrupted, occurred as a consequence of gross mismanagement of economic policy. This moratorium was not a decision taken within a new strategy to renegotiate Brazilian external debt.
The 1985/87 period has also been characterized by a complete lack of new ideas or proposals with respect to the renegotiations of the external debt. The major party that supports the Government is against any negotiation procedure that would involve IMF programs, which is credited for the 1983 economic recession.
The renegotiations of the Brazilian external debt with official institutions in the first quarter of 1987 under the Club of Paris arrangement and without a previous IMF agreement, was announced by government economists as a victory; according to them, they had broken down a golden rule of that institution.4
After some disagreement within the governmental economic area, the Central Bank President resigned and afterwards the Minister of Planning chose the same route. The Minister of Finance saw his support coming to an end, after the recognition that such a
4
Kingdom of Heterodoxy finally reached its end.
IV – Conditionalities for External Debt Management
The debt/exports ratio has been used as an indicator of a country’s ability to serve its external debt. Simonsen (1985) has used this ratio to derive a stability condition for the growth of external debt. This condition states that if the rate of growth of exports is higher than the rate of interest, and the country has a resource gap, the debt/exports ratio will converge to a stable value.
The value of exports in a measure of the resources that a country can effectively use to pay its external debt. However, the ability of a country to pay its external debt could be more properly measured by the value of the production of its tradable goods sector evaluated at international prices. This indicator would not depend on commercial policies of its trade partners, in contrast with the value of exports. It is possible that a country could be in a difficult position to serve its external debt, because creditor are imposing a series of restrictions on the international flow of goods and services. Nevertheless, the potential to pay could be very high. This indicator is also more general because it includes importable as well as exportable goods.
Let d be the ratio between net debt (D) and the value of production (y) of tradable goods, evaluated at international price (P), that is:
(1)
y P
D d=
The rate of increase in net external debt is equal to the amount of interest paid (iD) plus the resource gap (H):
(2) D =iD+H
where the dot means a derivative with respect to time.
By taking derivatives with respect to time in both sides of (1), we get:
(3)
y y P P D D d
d
− − =
By substituting (3) for (2), after rearranging some terms, we obtain:
(4) d=(i−π−g)d+h
where π =P/P is the rate of inflation of tradable goods, g=y/y is the rate of growth of
output in the tradable goods sector, and
Py H
h= is the proportion of the resource gap, in
relation to the output value of the tradable goods sector.
14
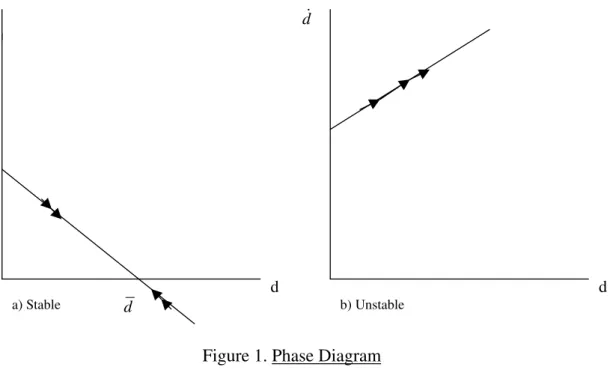
i-π -g<0, equation (4) is stable, and the ratio d converges to d . On the oder hand, if i-π -g>0, equation (4) is unstable, and the ratio d grows without bonds.5
d
d
d
a) Stable b) Unstable
d
d
Figure 1. Phase Diagram
Debtor countries in general have no kind of control over the international rate of interest i and the rate of inflation π. The stability condition just derived states that external debt management has to be such that the tradable goods sector grows at a higher rate than the international real interest rate, where this real rate has to be evaluated by subtracting from the nominal interest rate the rate of inflation of tradable goods.
Equation (4) helps us to understand the origins of the external debt crisis in 1982 and how its responsibility has to be shared by debtor and creditor countries.
The creditor countries are accountable for raising the international real rate of interest, due to economic policies that resulted in increasing the nominal rate of interest and lowering the rate of inflation (or even negative rates of growth for tradable goods prices).
The debtor countries, on the other hand, were responsible for not implementing economic growth policies that paid due regard to the tradable goods sector, in such a way that this sector could grow at a higher rate than the international real rate of interest. Countries like South Korea that did not suffer much from the debt crisis seem to have a tradable goods sector that counterbalanced the effects of a rising interest rate.
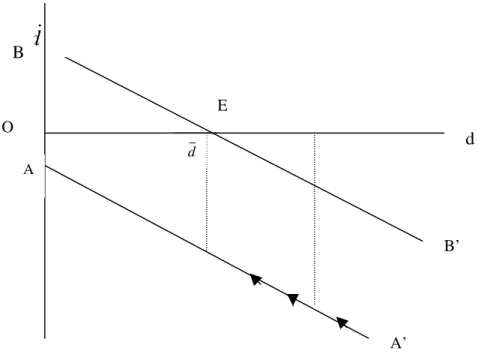
The phase diagram on Figure 2 contributes to our understanding the actual strategy of the international management of the external debt, and some alternative ways to this strategy. First of all, we should recognize some stylized facts. They are the following: i) the external debt crisis came into existence because the ratio d grew in an unstable fashion due to external shocks and gross mismanagement of economic policy; ii) the ratio d was raised beyond the level that would be recommendable, given the resource gap and the differential between the growth rate of output of the tradable goods sector and the real
5
transferred a substantial amount of resources to the creditor countries; and iv) there is some sparse evidence that the ratio d has declined since 1982 crisis.
Let us assume for the sake of the argument that g>i-π. Point C in Figure 2 would represent the situation of countries like Brazil that are transferring resources to creditor countries, and at the same time have adjusted their economy towards increasing output of the tradable goods sector. The adjustment path AA’ is feasible in the short run but imposes a heavy burden on the debtor countries.6 Besides that, this path may not be accomplished in the long run, because economic growth, in particular the rate of growth of the tradable goods sector, may depend upon a resource gap imposed by an external constraint, due to the need to import capital goods and basic raw materials without close domestic substitutes. We assume that OAB in Figure 2, is the resource gap level given by such a constraint.
Thus, an alternative strategy to handle the external debt problem is to have a partial debt relief so that point E in Figure 2 would be reached immediately. At this point the ratio
d is at stable level. In this strategy, debtor countries would be required to have an economic growth program that would allow the tradable goods sector to grow at a rate higher than the international real rate of interest.
Creditor countries, on the other hand, would be required to develop the proper environment for international trade, in such a way that debtor countries could transform into exports part of the potential output of their tradable goods sector.7
6
It should be pointed out that if indebted countries are willing to transfer resources to the creditor countries )
0
(h> , this strategy does not assure stability for the external debt management process. This is so because if g<i−π the AA’ curve will have a positive inclination, and the whole process is unstable.
7
If international organizations, such as IMF, are to go on supervising the external debt management process, they would have: i) to impose restrictions on creditor countries’ monetary and fiscal policies, in order to assure reasonable levels for the international real interest rate (i-π); and ii) to require that creditor countries’ commercial policies do not create restrictions to the flow of goods and services coming from indebted countries. Otherwise, there is no reason to expect that this whole process is a rational and proper way to deal with the developing country’s external debt problem.
d
B
O
A
E
d
B’
A’
d