Brazilian Journal of Political Economy, vol. 27, nº 1 (105), pp. 20-40, january-march/2007
External Debt in Developing Economies:
Assessment and Policy Issues
MÁRCIO HOLLAND*
More than one decade after the external debt restructuring (the Brady Plan), a great amount of literature has been published concerning the balance sheet factors in developing countries. The staff of international multilateral institutions joined with reputable academics in this great controversy. The external debt problem of the developing countries is back and once more reflections on its cause and on policy recommendations are analytically distinct. Our main task is to reflect on the recent external debt dynamics and assess howthis debt has evolved. Our findings indicate that the susceptibility of some developing countries to default is associated with global imbalance, that is, the waythey borrow.
Key-words: External Debt, Developing Countries, Original Sin, Debt Sustainability Assessment.
JEL classification: F33, F34, F59.
INTRODUCTION
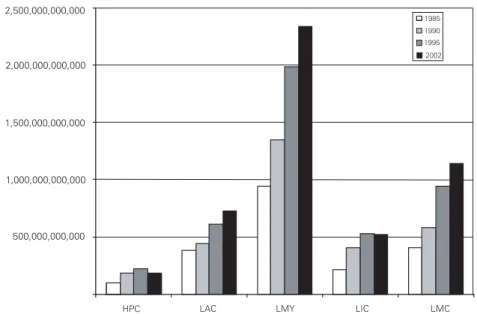
Even though programs of debt restructuring took place in the late 1980s and in the early 1990s, the total external debt has increased in most developing regions (as we can see in the figure 1). Only HIPCs (Heavily Indebted Poor Countries) have experienced constancy in their external debt, and the reason for this is directly associated with the programs designed to relieve these poor nations; and, since low income per capita countries are part of the HIPCs, the chart illustrates a relatively stable expansion of the external debt of these economies. When middle income countries are included, it is fair to say that external debt is back as a problem of great concern.
Taking three canonical examples of external debt problems (Brazil, Argentina and Mexico), the debt agreements and restructuring according to the Brady Plan have not been able to overcome that external constraint. The official terms of the Brady Plan took place in Mexico (March 1990), Argentina (April 1993) and Brazil (April 1994), and afterwards the total external debt increased by 45% in Argentina, 53% in Brazil and 43% in Mexico. In January 2002, Argentina formalized a default on US$95 billion of foreign currency bonds and US$2.2 billion of local-currency bonds.1 In Brazil, the external debt increased even though several components of debt had been restructured for a total of US$48 billion, and in Mexico the agreement restructured a total of US$48.2 billion.2In terms of total debt service to exports, Argentina experienced a significant increase since the Brady deal, from 35% to 71%, in 2001, one year before the default. Brazilian indicators presented similar behavior, changing from 36% (1995) to 93% (2000).
Figure 1: Total External Debt in Developing Countries (1985-2002) – US$
Notes: HPC = Heavily Indebted Poor Countries (HIPC); LAC = Latin America & Caribbean countries; LMY = Low & middle income countries; LIC = Low income countries; and LMC = Lower middle income countries. Source: World Bank (2004).
2,500,000,000,000
1985 1990 1995 2002
2,000,000,000,000
1,500,000,000,000
1,000,000,000,000
500,000,000,000
HPC LAC LMY LIC LMC
1In Argentina, January 2002, the local currency bonds were exchanged for new debt, which carried
covenants less favorable than the original debt. Bonds maturing before 2010 were extended by three years and the coupon was reduced to 7% or less. As of January 2003 the foreign currency bonds were still to be restructured. Stand-by credit facility (US$2.8 billion) by the IMF for transitional financial support until August 2003.
2In Mexico, in addition to new money, US$1 billion, the agreement provided for the exchange of
There are three main contributions to this persistent economic phenomenon. First, the “debt intolerance” approach (Reinhart, Rogoff and Savastano, 2003) support the idea that default became a rule rather than an exception in countries with weak financial intermediation and high tax avoidance. Second, there is the “original sin” approach (Eichengreen, Hausmann and Panizza, 2004). These authors associate the never-ending3problem of the external debt in developing countries with the “global imbalance”. One can quickly summarize these two contributions with two questions: 1) whydo debt intolerant countries borrow so much? (“debt intolerance”); and 2) howdo they borrow? (“original sin”). Finally, there are considerations from multilateral international institutions, such as the World Bank and the International Monetary Fund. These institutions have not developed a theoretical approach, but only empirical analysis; and even these sustainability assessments are not commonly shared, both of them are apprehensive about the external debt sustainability problem. The IMF staff is more focused on the sustainability assessments while the World Bank staff has tried to classify countries according to their level of external indebtedness and per capita income.
The main purpose of this paper is to provide a comprehensive empirical analysis of the recent external debt trends in developing countries. Section two summarizes the main and recent approach that can help us understand the specifics of the external debt phenomenon in developing countries. We focused on the “original sin” approach because of our main intention to discuss the recent evolution of sovereign debt profiles.4The third section presents empirical evidence on the recent evolution of the external debt in developing countries. The fourth section briefly discusses the interventions of multilateral international institutions in the debate about sovereign debt. Our final section presents policy implications.
HOW DO DEVELOPING COUNTRIES BORROW?
According to Eichengreen, Hausmann and Panizza (2003), if a country is unable to borrow abroad in its own currency it suffers from “original sin”, and because developing countries accumulate external debt, it will face currency mismatches on its balance sheets. The authors show that “the composition of the external debt – and specifically the extent to which that debt is denominated in foreign currency — is the key determinant of the stability of output, the volatility of capital flows, the management of exchange rates and the level of country credit ratings” (The Pain, p. 3).
The “original sin” approach is concerned about the consequences of the debt
3Even from a historical perspective Latin American Economies are quite a lot of prone to default.
For example, from 1820 to 1913, from 43 total default episodes 34 occurred in those economies. (Esteves, 2005).
concentration denominated in a few currencies5of the developed economies, mainly for the reasons to borrow in foreign currency.6On the other hand, from the investors’ standpoint, this historical7and global phenomenon suggests limits of portfolio diversification. Hence, one can say that the country size matters and the “ability to borrow abroad in one’s own currency seems to be heavily concentrated among large countries” (The Mystery, p. 5). The authors analyze several factors that could be associated with the original sin, such as monetary credibility, fiscal fundamentals, measures of governance, the size of the financial system, and capital controls, and they only found a weak correlation.8
Furthermore, it is important to ask what matters for the concentration of the world’s portfolio in few currencies. It means that the opportunities for diversification face decreasing marginal benefits in adding costs and risks of each additional currency. Imagine two countries (A and B),9with their own currency (M and N, respectively), and each currency adds return and risk to some portfolio composed by M and N. But, following the essential problem of the original sin, the model assumes different sizes (measured by GDP, trade or domestic credit) for each country such that M is from the small economy and N is from the large one. The “original sin” supposes asymmetries not only in terms of size, but also in opportunities for diversification and each currency (or assets indexed to this currency) presents specific risks and returns, but the risk of the portfolio composed by them increases according to the transaction cost and credit risk from the addition of the currency of the smallest country.10But, the risk of the largest economy is only the expected currency risk. Hence, the investor in the large economy will have less enthusiasm to hold the currency of the small economy, while the investors in the small economy easily hold foreign currency of the country N. According to the authors, “This suggests that developing countries and their currencies, which are latecomers to the international financial game, face an uphill battle when attempting to add their currencies to the international portfolio”. In Hausmann and Panizza (2003), the interest paid by a domestic
5Eichengreen, Hausmann and Panizza (The Pain 2003, p. 7) show that 87% of debt instruments are
issued in the 3 main currencies (the US dollar, the Euro and the Yen) and residents of these three countries issue 71% of total debt instruments.
6According to Reinhart, Rogoff and Savastano (2003), Eichengreen, Hausmann and Panizza (2002)
blame the insufficiencies of international capital markets for recurring debt cycles and have proposed mechanisms to make it easier for emerging market economies to borrow more, but the main problem for these countries is how to borrow less, and they show that defaulters borrow more than non-defaulters.
7From a historical perspective, according to Flandreau and Sussman (2003), there is a high correlation
between original sin around 1850 and now.
8One can find the same analysis on the factors that can explain the determinants of original sin in
Hausmann and Panizza (2003).
9An illustrative model could be easily extended for a continuumof countries, currencies and assets. 10According to Eichengreen, Hausmann and Panizza (The Pain, p. 7 and The Mystery, p. 23) the
currency bond issued by a developing economy can be decomposed into three components: a safe interest rate that can be interpreted as the risk-free rate (may be the interest rate paid by bonds of developed economies), a currency risk and a sovereign risk or credit risk. The authors correctly consider that the two latter are positively correlated, but they do not say anything about the causality between them. Does the higher currency risk cause the higher credit risk, or vice-versa?
The investors are interested in optimizing their risk-return relationship, based on forward-looking expectations. Then, when they contract bonds from a small country, they receive ex post interest rates, which must be at least equal to the fixed interest rate offered by foreign-currency-denominated bonds plus the expected local currency devaluation.
Following Chamon and Hausmann’s (2002) arguments, in emerging markets (small economy), central banks have a preference for exchange rate stability and hence they suffer from high interest rate volatility11and bankrupt costs. At the initial moment of the bond issuing process, the lender takes into account the discount rate considering:
1. The expected currency devaluation of the small country;
2. The reward to lending in ex-post interest rate local-currency as opposed to foreign currency interest rates, and compares this with the transaction cost of allocating wealth into emerging markets.
If central banks in emerging markets are obstinate to stabilize the exchange rate even at the cost of high domestic interest rate variability, the second factor becomes the most important in measuring, in the initial state, future returns on emerging market bonds.
Chamon and Hausmann (2002, p. 7-8) believe that “the central bank decides to “throw in the towel” if the interest rate hike necessary to keep the exchange rate at a certain level is so high that the loss function is actually larger than the one where it lets them go bankrupt and accommodates the shock between the two instruments”. They support this from Hausmann’s (2000) empirical study on the exchange rate volatility in a sample of Latin American countries for the period of 1994-1999. They are probably right, but the sample is definitely biased by the fact that most of these economies were under fixed exchange rate regimes and it would have been better to question not if interest rate volatility was high but how volatile interest rates were compared to exchange rates. The model can be generalized to take into account the effort of monetary authorities to avoid excessive exchange rate volatility and, at the same time, to capture the pass-through from high devaluation of the exchange rate to domestic inflation.12
11In this case, the country may suffer from the “fear of floating” (Calvo & Reinhart, 2002). 12According to Chamon and Hausmann (2002), the countries most likely borrow in foreign currency
But, if the “original sin” approach is right, some countries cannot borrow abroad in their own currency and will suffer from global financial market imperfections or currency mismatches.13 If the country’s external debt is denominated in foreign currency the real exchange rate depreciation will make it more difficult to service this debt. “Knowing that shocks affecting the real exchange rate can disrupt the country’s ability to service its debt, foreigners may be rendered less willing to lend. And since the real exchange rate tends to strengthen in good times and weaken in bad times, foreign-currency debts will be harder to service in bad times, reducing the willingness to lend and thereby accentuating the procyclical nature of capital flows” (Eichengreen, Hausmann and Panizza, 2003b, p. 4). On the other hand, crises are more frequent and more severe when short-term borrowing and dollar denominated external debt are high (Frankel and Wei, 2004).
And, if the original sin approach is right the next question is: what are its determinants? Or, in other words, what determines which countries do not borrow abroad in their own currency or even domestically for the long term? Among several possible determinants, one must consider the importance of financial market institutions, domestic monetary credibility (Jeanne, 2002), fiscal solvency (Corsetti and Mackowiak, 2002), capital market imperfections (Chamon, 2001), and the exchange rate regimes (Calvo and Reinhart, 2002). Hausmann and Panizza (2003) found a strong role played by country size (measured by the log of GDP), trade or domestic credit. That is, large economies have limited incentives to hold currencies issued by small countries. “Large countries are less sinful”, (p. 980). But, why does size matter? It is most likely because size “explains the concentration of the world portfolio in few currencies or the fact that it is mainly large countries that seem to be able to issue foreign debt in their own currency” (p. 978). Then, “in presence of international transaction costs, the benefits of diversification are larger for small countries” (p. 978).
RECENT HISTORY REPEATING THE PAST
There is doubtlessly a historical correlation among the total external debt, exports and GDP (figure 2 illustrates this correlation for the Latin American region). What does this movement show? Assuming that external debt service costs follow the same trajectory and similar intensity of the total external debt,14 we can effortlessly conclude that there is a long-term stationary state between external debt service and GDP (or exports) which implies that it would be hard for a country to change this relationship in the near future.
13Even though currency mismatch is different from original sin, it can be a possible consequence of
original sin (Eichengreen, Hausmann and Panizza, 2003b).
14The coefficient of correlation between total external debt and total external service is about 0.87
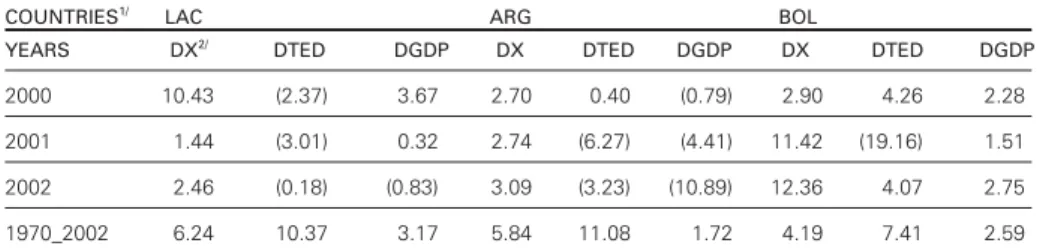
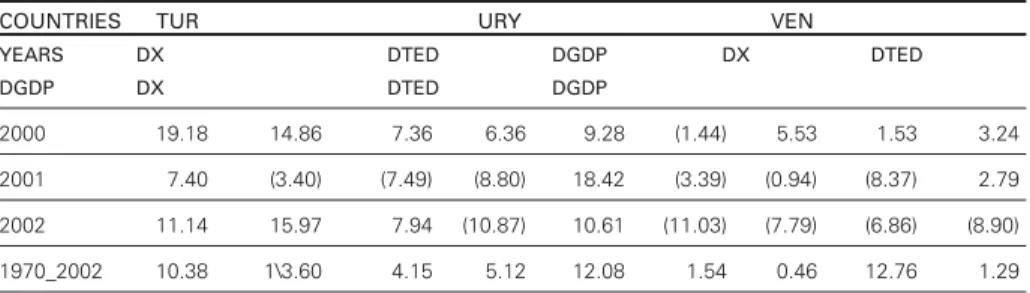
Taken into account the dynamics of exports, total external debt and GDP, in terms of growth rates, for most countries, it is fair to say that the total external debt has enlarged more than their exports or GDP, according to table 1, for the Latin American and Caribbean Economies (LAC) and for selected developing countries15. It is very important to highlight that the recent downward movement in the total external debt (2000-2002) cannot hide a long-term increase (1970-2002) and it does not compensate the historical trajectory.
Figure 2: Latin American and Caribbean Economies: GDP, Exports and TED
(1971-2003) US$ Billion
Source: World Bank (2004).
Note: GDP = Gross Domestic Product; TED = Total External Debt; EXPORTS = Total Exports
Tables 1 and 2 show other very important information about the profile of the external debt for all middle-income-per-capita developing countries.16The most wide-ranging conclusion we can obtain from table 2 is about the structural heterogeneity across these countries. They can vary from income per capita of the US$800 to US$7,600; they could be classified, in the average, as moderately indebted, according to the ratio PVD_GNI,17but this key-indicator varies form
1975 1980 1985 1990 1995 2000
8.E+11
7.E+11
6.E+11
5.E+11
4.E+11
3.E+11
2.E+11
1.E+11
0.E+00
GDP TED EXPORTS
2.2E+12
2.0E+12
1.8E+12
1.6E+12
1.4E+12
1.2E+12
1.0E+12
8.0E+11
6.0E+11
15We have only selected countries that have experienced some sort of financial and/or currency crisis,
and our remarks do not change for other developing countries.
16For this analysis we consider only middle income per capita countries, as classified by the World
Bank.
17PVD_GNI is one key-indicator of external indebtedness estimated by the World Bank; we will return
14% to 129%. They generally show a very low liquidity “cushion”, according to either external debt services to exports or reserves in months of imports.
Table 1: Selected Countries: Growth Rate of Exports, Total External Debt and GDP
(1970-2002)
COUNTRIES1/ LAC ARG BOL
YEARS DX2/ DTED DGDP DX DTED DGDP DX DTED DGDP
2000 10.43 (2.37) 3.67 2.70 0.40 (0.79) 2.90 4.26 2.28
2001 1.44 (3.01) 0.32 2.74 (6.27) (4.41) 11.42 (19.16) 1.51
2002 2.46 (0.18) (0.83) 3.09 (3.23) (10.89) 12.36 4.07 2.75
1970_2002 6.24 10.37 3.17 5.84 11.08 1.72 4.19 7.41 2.59
COUNTRIES BRA CHL CHN
YEARS DX DTED DGDP DX DTED DGDP DX DTED DGDP
2000 10.59 (2.02) 4.40 7.50 8.11 4.40 30.57 (4.19) 8.00
2001 11.24 (5.21) 1.40 9.70 3.64 2.80 9.62 16.71 7.50
2002 7.76 0.70 1.50 5.65 9.24 2.20 29.42 (1.06) 8.00
1970_2002 8.36 12.47 3.98 8.82 9.41 4.37 11.79 18.27 8.55
COUNTRIES COL ECU IDN
YEARS DX DTED DGDP DX DTED DGDP DX DTED DGDP
2000 6.15 (1.43) 2.92 (1.00) (15.62) 2.80 26.48 (4.49) 4.92
2001 2.74 8.15 1.39 (1.32) 5.57 5.12 1.88 (7.18) 3.44
2002 (4.39) (7.76) 1.62 0.86 13.61 3.41 0.44 (1.37) 3.69
1970_2002 5.75 9.05 3.74 8.15 14.72 3.66 5.85 11.51 6.01
COUNTRIES MYS MEX PER
YEARS DX DTED DGDP DX DTED DGDP DX DTED DGDP
2000 16.07 0.09 8.50 16.42 (9.70) 6.57 7.93 (1.74) 2.82
2001 (7.50) 6.37 0.30 (3.83) (3.09) (0.12) 7.06 (3.71) 0.25
2002 4.49 8.84 4.19 1.51 (3.03) 0.73 6.81 1.89 4.85
1970_2002 9.57 15.96 6.69 10.12 10.76 3.72 4.40 7.61 2.46
COUNTRIES POL RUS THA
YEARS DX DTED DGDP DX DTED DGDP DX DTED DGDP
2000 23.20 4.26 4.10 9.50 (8.43) 10.00 17.49 (17.62) 4.76
2001 3.10 0.03 3.95 4.20 (4.71) 5.10 (4.06) (15.69) 2.14
2002 1.34 9.87 1.02 9.90 (3.25) 4.70 12.07 (11.90) 5.41
COUNTRIES TUR URY VEN
YEARS DX DTED DGDP DX DTED
DGDP DX DTED DGDP
2000 19.18 14.86 7.36 6.36 9.28 (1.44) 5.53 1.53 3.24
2001 7.40 (3.40) (7.49) (8.80) 18.42 (3.39) (0.94) (8.37) 2.79
2002 11.14 15.97 7.94 (10.87) 10.61 (11.03) (7.79) (6.86) (8.90)
1970_2002 10.38 1\3.60 4.15 5.12 12.08 1.54 0.46 12.76 1.29
Notes: 1/ Description of Legends: LAC = Latin American and Caribbean; ARG = Argentina; BOL = Bolivia; BRA = Brazil; CHL = Chile; CHN = China; COL = Colombia; ECU = Ecuador; IDN = Indonesia;
MYS = Malaysia; MEX = Mexico; PRY = Paraguay; PER = Peru, POL = Poland; RUS = Russia;
THA = Thailand; TUR = Turkey; URY = Uruguay; VEN = Venezuela. 2/ Description of Variables: DX = growth rate of exports; DTED = growth rate of total external debt; DGDP = growth rate of GDP
Source: World Bank (2004).
Taking the coefficients of correlation18among those indicators, there is no evidence to support the theory that highly indebted countries present high inflation and low trade openness. But, there is some fair evidence to believe that they are the same countries with high U.S. Dollar-denominated external debt and short-term debt to total debt. Hence, in this rough empirical estimate, highly externally indebted countries are not necessarily under an uncontrolled inflation process. They are not those economies under exchange rate misalignment and, they are not those economies that have undergone imbalances in their current accounts which constitute a fascinating result.
Table 2: Middle-Income Countries: Basic Statistics (Average 2000-2002)
CA_GDP COMPOSITION CPI GDPpc GDPpc INT_XGS GROWTH
Mean -3.23 61.04 171.80 2,893.62 1.90 6.15
Maximum 14.41 93.20 863.83 7,587.08 11.21 22.83
Minimum -23.54 17.10 97.91 800.60 -6.19 0.97
Std. Dev. 7.17 21.23 126.83 1,700.33 3.25 4.69
PVD PVD_GNI PVD_XGS RES_IMP STD_TED
Mean 31,962.81 57.66 130.29 4.01 15.95
Maximum 242,257.0 129.00 393.00 9.38 57.96
Minimum 169.0000 14.00 38.00 0.75 2.87
Std. Dev. 53,866.63 26.12 76.19 1.97 11.72
18The estimated coefficient of correlation for different years during the 90s and for the average annual
TDS_XGS TED_GNI TED_XGS TED STOCK TRADE
Mean 18.18 62.75 140.14 31,624.96 89.68
Maximum 79.26 221.00 372.00 227,932.0 218.14
Minimum 2.56 15.00 39.00 206.00 26.39
Std. Dev. 13.70 32.70 75.08 52,019.98 41.86
Notes: CA_GDP = current account to GDP; Composition = U.S Dollar Composition to total debt; CPI = consumer price index (1995=100); GDPpc = GDP per capita; GDPpcgowth = growth rate of GDPpc; Int_XGS = interest payments to Exports; PVD = present value of debt service; PVD_GNI = PVD to Gross National Income; PVD_XGS = PVD to Exports; RES_IMP = total reserves in months of imposts; STD_TED = short-term debt to total external debt; TDS_XGS = total debt services to Exports; TED_GNI = total external debt to GNI; TED_XGS = total external debt to exports; TED Stock = stock of total external debt in US$ mi; and Trade = sum of exports and imports to GDP. Source: World Bank (2004).
Figure 3: United States Dollar: Real and Effective Exchange Rate (1975-2003)
Source: World Bank (2004)
The next step is to understand how developing countries borrow abroad. According to table 3, the majority of the developing countries’ long-term external debt is indexed to only one currency, the U.S. Dollar. Nowadays, about 95% of debt is indexed to two currencies, US$ dollars and Euro. Needless to say, the U.S. Dollar has been very volatile since the early the 1970s (see figure 3) and appreciated from 1995 to 2000.19
7 0 80 90
70 100 110 120 130
1975 1980 1985 1990 1995 2000
19All European currencies which index external debt in developing countries keep their purchasing
There is an unambiguous relationship between the composition of external debt and the U.S. Dollar dynamics for all periods of time since the early 1970s. We then have one more problem to take into account: not only the majority of the developing countries’ external debt is indexed to the U.S. Dollar, and the Dollar is volatile over time, but also the periods of time of appreciation of the U.S. Dollar are the same when the U.S. Dollar composition of the debt has increased20. Nevertheless, according to figure 6, there is a non-linear relationship between the amount of the debt and its composition across countries. The lower the external debt indicator is, the lower the U.S. Dollar currency-composition to total debt is, and countries with high external debt undergo more from the “debt-denomination problem”.
Table 3: U.S. Dollar -denominated Debt - % to Total - (1970-2002)
COUNTRY 1970 1975 1980 1985 1990 1995 2000 2001 2002
ARGENTINA 47.7 54.1 64.5 79.6 54.5 59.3 62.8 60.7 56
BOLIVIA 85.9 78.9 65.1 70.6 41.3 32.7 45 61.3 64.9
BRAZIL 72.1 76.2 67.8 70.7 60.3 68.2 71.5 70.9 73.7
CHILE 75.1 69.3 74.6 78 40.2 42.3 85.5 89.1 89
CHINA .. .. .. 23.8 29.1 58.1 71.5 74.1 72.5
COLOMBIA 66.1 61.7 60.4 53.4 44 53.3 80.3 78.5 77.8
ECUADOR 71.7 71.1 64.2 56.9 54.5 70.5 83.2 84.9 85
IDONESIA 46.3 58.6 43.5 31.2 20.9 21.5 50.5 57.3 55.6
MAYLASIA 14 39.6 36.7 50.4 31.8 48.5 62.8 70.9 71
MEXICO 51.2 76 78.7 83.1 64.3 65.2 85 88.1 89.7
PARAGUAY 66.4 62.9 56.2 47.1 17.2 28.8 60.2 62.7 63.1
PERU 59 61 44.1 56.7 48 41.9 73.6 75.3 74.9
POLAND .. .. .. .. 32.2 45.9 47.7 41.7 36.2
RUSSIA .. .. .. .. .. 52.1 72.3 73.4 69.5
THAILAND 21.6 14.2 41 24.7 15.8 27.2 46.2 48.1 38.1
TURKEY 49.3 51.1 43.5 47.2 40 38.3 57.3 63.1 64.9
URUGUAY 62.9 80.4 77.9 84 64.9 53.8 80.9 78.3 81.1
VENEZUELA 54.3 46.2 82.8 89.6 78.2 69 83.8 80.6 77.1
Source: World Bank (2004).
In the recent period, from the 1980s (debt crises) to the 1990s (approximately after the Brady Plan had been implemented), the total external debt has increased
following the upward movement of the U.S. dollar. On the other hand, the average interest rate on the external debt is always higher than the average of the domestic interest rate. There is a gap between interest rates across countries and it is very important to analyze which factors could explain this gap. There are most likely more “other factors” than the history of inflation and default.
Figure 4: Latin American Economies (Selected Countries): Currency Denomination of External Debt – U.S. Dollar Participation (1970-2002)
Source: World Bank (2004).
Figure 5: Asian Economies (Selected Countries): Currency Denomination of External Debt – U.S. Dollar Participation (1970-2002)
Source: World Bank (2004).
10 20 30 40 50 60 70 80
1975 1980 1985 1990 1995 2000
10
MYS THA
TUR IDN 40
50 60 70 80 90 100
1970 1975 1980 1985 1990 1995 2000
30
ARG BRA
Figure 6: Debt-Composition and Indebtedness
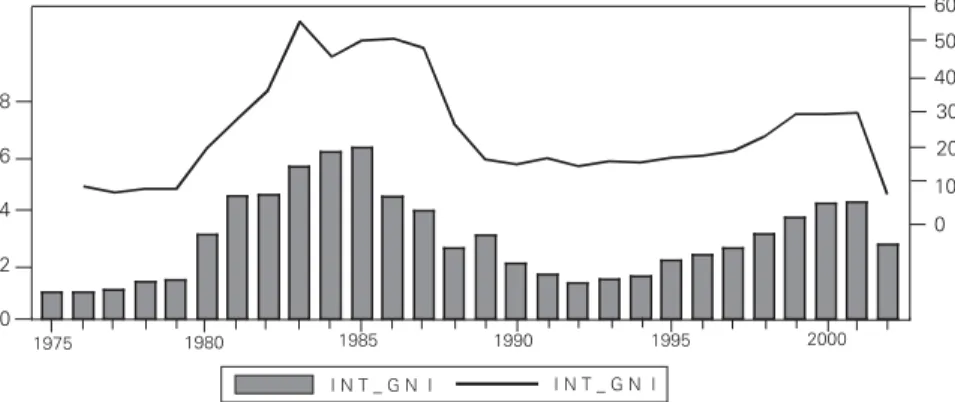
As a consequence of the profile of external debt in terms of its currency composition, its interest payments (relative to GNI) follow the country’s export dynamics. That is, while there is an increase in the country’s exports its external debt’s interest payments increase as well, and vice-verse. Then, even if developing countries show a good performance in their external sector, they will be paying more interest on external debts. This contradictory fact is easily explained by the movement of the U.S. Dollar. Certainly, when the U.S. Dollar appreciates, the export competitiveness of developing countries improves; however, the external debt in U.S. Dollar increases. Figures 7-11 present an illustration for selected countries.
Figure 7 - Argentina: Interest Payment of External Debt per GNI and Exports (1975-2002)
Source: World Bank (2004).
0 2 4 6 8
0 10 20 30 40 50 60
1975 1980 1985 1990 1995 2000
I N T _ G N I I N T _ G N I
0 40 80 120 160 200 240
10 20 30 40 50 60 70 80 90 100
0
P D V
Figure 8: Brazil: Interest Payment of External Debt per GNI and Exports (1975-2002)
Source: World Bank (2004).
Figure 9: Mexico: Interest Payment of External Debt per GNI and Exports 1979-2002)
Source: World Bank (2004).
Figure 10: Malaysia: Interest Payment of External Debt per GNI and Exports (1975-2002)
Source: World Bank (2004). 3
4 5 6
8 10
0
6
4 2
0
1 2
1975 1980 1985 1990 1995 2000
I N T _ G N I I N T _ X G S
2 4 6 8
0 10 20 30 40
0
1980 1985 1990 1995 2000
I N T _ G N I I N T _ X G S
10 20
0 1 2 3 4 5 6
0
1975 1980 1985 1990 1995 2000
I N T _ X G S I N T _ G N I
Figure 11: Thailand: Interest Payment of External Debt per GNI and Exports (1975-2002)
Source: World Bank (2004).
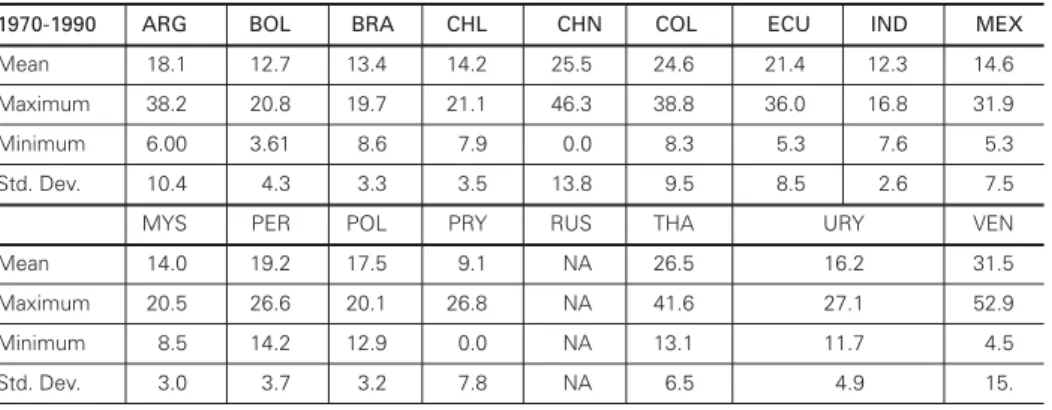
On the other hand, does external debt maturity matter? According to table 4, some countries experienced increases in their short-term debt, such as Brazil, Indonesia, Mexico, Malaysia, Paraguay, Thailand and Uruguay, and others kept the same level, such as Argentina and Peru21. It is important to highlight that short-term debt is defined as the debt that has an original or extended maturity of one year or less. Then, there is one more element concerning the profile of the external debt. Not only the debts shows a strong concentration in terms of currency-composition and, consequently, they are vulnerable to the U.S. Dollar fluctuations over time, but also short-term debts to total debts has increased enough to become a serious factor in the analysis of debt sustainability.
Table 4: Selected Countries: Short-Term External Debt relative to Total External Debt Basic Statistics (1970-2002)
1970-1990 ARG BOL BRA CHL CHN COL ECU IND MEX
Mean 18.1 12.7 13.4 14.2 25.5 24.6 21.4 12.3 14.6
Maximum 38.2 20.8 19.7 21.1 46.3 38.8 36.0 16.8 31.9
Minimum 6.00 3.61 8.6 7.9 0.0 8.3 5.3 7.6 5.3
Std. Dev. 10.4 4.3 3.3 3.5 13.8 9.5 8.5 2.6 7.5
MYS PER POL PRY RUS THA URY VEN
Mean 14.0 19.2 17.5 9.1 NA 26.5 16.2 31.5
Maximum 20.5 26.6 20.1 26.8 NA 41.6 27.1 52.9
Minimum 8.5 14.2 12.9 0.0 NA 13.1 11.7 4.5
Std. Dev. 3.0 3.7 3.2 7.8 NA 6.5 4.9 15.
3 4 5 6
0 1 2
8 16
4
0
1975 1980 1985 1990 1995 2000
I N T _ G N I I N T _ X G S
12
21This is a short sample of countries, but the remarks remain when we take all middle income per
1990-2002 ARG BOL BRA CHL CHN COL ECU IND MEX
Mean 18.3 6.2 16.9 11.1 17.9 14.9 14.6 18.3 17.9
Maximum 24.9 8.2 21.7 17.5 28.4 22.1 27.2 25.0 28.3
Minimum 9.5 3.5 10.2 3.4 8.9 8.3 5.8 13.2 7.0
Std. Dev. 4.8 1.6 4.2 5.3 5.4 5.0 6.7 3.6 6.3
MYS PER POL PRY RUS THA URY VEN
Mean 19.0 20.1 9.8 21.1 9.6 32.1 26.0 9.3
Maximum 31.6 31.3 19.4 30.4 16.7 44.5 30.1 13.9
Minimum 11.0 8.2 1.9 15.1 4.6 18.6 14.9 5.4
Std. Dev. 6.4 6.5 4.4 5.3 3.1 9.56 3.9 2.7
Source: World Bank (2004).
HOW DO THE INTERNATIONAL
INSTITUTIONS THINK ABOUT THE PROBLEM?
From the standpoint of the multilateral international institutions, the external debt can be expressed both as a “classification problem” and “sustainability assessment”.22 The World Bank addresses this phenomenon by classifying developing countries. On the other hand, the IMF (2002 and 2003) has widely published reports and methodologies about how to analyze debt sustainability. In this paper one can find direct and indirect evidence that leads to some reservations on both directions assumed by these international institutions.
According to the World Bank’s Classification by level of external indebtedness, only two variables are important to classify a country as “Severely Indebted”, “Moderately Indebted” or “Less Indebted” (World Bank, 2004a). They are the following:
• The present value of the debt service (henceforth PVD);
• The exports of goods and services (XGS) or the gross national income (GNI);
Most importantly, there are two key indicators of external debt to classify these countries (see table 5 and figure 14 for selected countries)23. As if, for example, the present value of debt service to exports of goods and services is higher than 220%, or the present value of the debt service to gross domestic income is higher than 80%, the country is classified as severely indebted.
According to these indicators one can conclude that Colombia has the same income level as Brazil (middle income per capita), but Colombia is moderately
22See Holland (2005) for detail on this problem.
indebted, or countries such as Bolivia, Costa Rica, Guatemala, Paraguay, and El Salvador are less indebted middle per capita income economies. The majority of the Latin American and Caribbean countries (LAC) are classified as severely indebted, including countries like Nicaragua, Jamaica, Peru and Brazil.
How can countries like Brazil, Argentina, Chile and Mexico be ranked in the same per capita income level such as Costa Rica, Guatemala, Ecuador, while Brazil and Argentina are as indebted as Jamaica and Panama or have higher indebtedness than Haiti?
As we can see in the World Bank “these indicators do not represent an exhaustive set of useful indicators of external debt. (…) Thus, these indicators should be used in the broader context of country-specific analysis of debt sustainability” (2004a: xxxi).
Table 5: Income and Indebtedness Criteria
Indebtedness classification
Income classification PVD/XGS higher than 220 PVD/XGS higher than PVD/XGS less than percent or PVD/GNI than 80% (find) 220% but higher than 132% or PVD/GNI less
higher 132% or PVD/GNI less than 48%
than 80% but higher than 48%
Low-income: GNI per Severely indebted low- Moderately indebted low Less indebted low-capita less than $735 income countries -income countries income countries
Middle-income: GNI Severely indebted middle Moderately indebted middle Less indebted middle per capita between -income countries -income countries -income countries $736 and $9,075
Note: PVD/GXS is present value of debt service to exports of goods and services. PVD/GNI is present value of debt service to GNI.
Source: World Bank (2004a).
Considering that this international institution has an important role in financing external debt, what kind of consequences can be associated with this second best classification? How sound is the World Bank’s classification? First, it is expected that the high external indebted country has experienced high external vulnerability, high domestic public debt and low credibility in its monetary policy, and most likely high risk of expropriation of contracts and high credit risk. But, have the highly indebted countries really experienced these scenarios? Second, is it possible for a country to change its classification if it shows either fast economic and/or export growth or considerable reduction in its external debt? Finally, do currency-denomination and the maturity structure of debt not matter?
diverse countries. The discount rates are specified for 14 currencies, but as we could see in the table 2, the range of the currency composition of the debt can vary from 17% to 93% in terms of U.S. Dollar composition.
But, if it is really possible to classify countries in terms of external debt according to the World Bank Classification, can some countries achieve significant reductions in their debt burden through sustained growth and lower interest rates? Do indebted countries change their classification for the better by implementing domestic (monetary or fiscal) policies in an economically relevant period of time? In other words, can developing countries move into a sustainable trajectory to relieve external debt by themselves?
Figure 12: Selected Countries: Total External Debt and PVD (Average 2000-2002)
Source: World Bank (2004)
Figure 13: Selected Countries: Key-Indicators of External Debt (Average 2000-2002)
Source: World Bank (2004) 100.00 Brazil Russia Mexico Argen tina Indonesia Turkey Thaila nd Malaysia Colom bia Peru Ecuado r Uruguay
Bulgaria Bolivia Paragu
ay Chile TED_GNI PVD_GNI 90.00 80.00 70.00 60.00 50.00 40.00 30.00 20.00 10.00 300,000.00 250,000.00 200,000.00 150,000.00 100,000.00 50,000.00 Brazil Russia Mexico Argen tina Indone sia Turkey Thailan d Malaysia Colom bia Peru Ecuado r
Uruguay Bulgaria Bolivia Paragu ay Chile
Figure 14: Selected Countries: External Indebtedness WB Classification (2002)
Source: World Bank (2004)
REFLECTION ON ECONOMIC POLICY
We benefited from exhaustive discussions about the external indebtedness in developing economies. The economic literature has provided us with a lot of conceptual and theoretical elements to understand the debt crises problem. From “debt intolerant” authors, even serial default is such a pervasive phenomenon, and it is also understandable with sustainability assessment, that this sad fact can be overcome, but “policymakers need to be prepared to keep debt levels – especially government debt levels — low for extended periods while undertaking more basic structural reforms to ensure that the country can eventually digest a heavier debt burden” (Reinhart, Rogoff and Savastano, 2003, p. 62).
Focusing on the reflections on policies for debt-intolerant countries, the sad fact that the analysis reveals is that once a country slips into being a serial defaulter, it retains a high level of debt intolerance that is difficult to shed. Otherwise, economic growth alone is not sufficient to allow countries to substantially reduce their debt burden, which constitutes another reason to be skeptical about sustainability analysis for debt-intolerant countries. That is, debt-intolerant countries not only need to grow but also to borrow less. Then, “constrained access to international capital markets is best viewed as a symptom, not the cause, of the disease” (Reinhart, Rogoff and Savastano, 2003, p. 59).
Alternatively, the inability of some countries, especially developing ones, to borrow abroad in their own currencies, “implies the absence of adequate opportunities for international risk sharing and renders the world a riskier financial
450.00
Brazil Mexico
Argentina Tu Indonesia rkey
Thailand Malaysia Colom
bia Peru
Ecuador Uruguay Venezuela Paraguay Chile
400.00
350.00
300.00
250.00
200.00
150.00
100.00
50..00
PVD_XGS PVD_GNI
Poland Russia Bolivia China Severely Indebted
Severely Indebted
Moderately Indebted
Less Indebted
Moderately Indebted
place” (Eichengreen and Hausmann, 2003, p. 2). In the same direction assumed here, even with different treatments, the empirical analysis of these authors suggests that domestic reforms, by themselves, “are unlikely to eliminate original sin”. So, they propose the creation of a synthetic unit of account of an inflation-indexed basket of currencies of emerging countries and, in addition, the institutional mechanisms to encourage the development of financial instruments linked to that unit of account, and, therefore, incentives for investors to add it to their portfolios.
Taking the external debt as a management problem, the IMF staff provides a very accurate sustainability assessment, a plethora of information, such as baseline scenario including the set of macroeconomic projections in a surveillance context, a series of model-independent sensibility tests applied to the baseline scenario, and concerns about the inevitable judgments and, hence, an agenda of endless sensitivity tests using evidence from previous crises events and simulation techniques. However, neither the history of inflation and default nor the global imbalance seems to play an important role in the sustainability analysis.
It is remarkable throughout our empirical investigation how vulnerable a country that borrows abroad in a foreign currency can be, not only because of the foreign-currency denominated obligations, but also because this feature comes with two others, which are the maturity structure of the debts and the short-term interest rates. The findings shown here can ensure that domestic authorities have little to do; besides trying credible monetary and fiscal policies. The external debts are not indexed in domestic currency, neither in domestic inflation nor in the domestic interest rates. They are small countries unable to persuade international investors to buy positions in their domestic currency. Some middle income countries, such as Brazil and Argentina, can handle with this external debt dynamics improving exports and economic growth rates. Most middle income countries do not.
This definitely does not imply adopting some comfortable role for the domestic authorities in emerging market economies. They really need to find the way to borrow lessabroad and to implement fiscal and monetary discipline at home to build credibility in their monetary and financial system, and, needless to say, certainly to introduce very accurate sustainability analyses for domestic and foreign public debt, even though these are steps to ameliorate and seldom solve the problem.
REFERENCES
BUBULA, A. and ÖTKER-ROBER, I. (2002). “The evolution of exchange rate regimes since 1990: evidence from De Facto policies”. IMF Working Paper 02/155. Washington: International Monetary Fund.
CALVO, G. and REINHART, C. (2002). “Fear of floating”. Quarterly Journal of Economics. Vol. 113(3).
CHAMON, M. (2001). Why cannot developing countries borrow from abroad in their currency? (unpublished manuscript). Harvard University.
CORSETTI, G. and MACKOWIAK, B. (2002). Nominal debt and currency crises. (unpublished manuscript). Yale University: Yale.
EICHENGREEN, B, HAUSMANN, R and PaNizza, U. (2003). Original Sin: the pain, the mystery. University of California, Berkeley. August 2003 (unpublished manuscript).
EICHENGREEN, B, HAUSMANN, R and PANIZZA, U. (2003b). Currency mismatches, debt intolerance and original sin: why they are not the same and why it matters. University of California, Berkeley. October 2003 (unpublished manuscript).
EICHENGREEN, B, HAUSMANN, R (2003). Original Sin: the road of redemption. University of California, Berkeley. August 2003 (unpublished manuscript).
EICHENGREEN, B. and HAUSMANN, R. (1999). “Exchange rate and financial fragility”. NBER Working Paper7418. November 1999.
ESTEVES, R. P. (2005). Sovereign debt and bondholder’s protection in the European capital market before 1914. Berkeley, UC. (mimeo).
FLANDREAU, M. and SUSSMAN, N. (2003). “Old sins”. In B. Eichengreen and R. Hausmann (eds.). Debt denomination and Financial Instability in Emerging Market Economies.University of Chicago Press: Chicago (forthcoming).
FRANKEL, J. and WEI, Shang-Jei. Managing macroeconomic crises; policy lessons.(Draft Chapter for Managing volatility and crises: a practitioner’s guide). March 2004. (unpublished manuscript). HAUSMANN, R. and PANIZZA, U. (2003). “On the determinants of Original Sin: an empirical
investigation”. Journal of International Money and Finance.22 (2003) 957-90.
HAUSMANN, R. (2003). “Good credit ratios, bad credit ratings: the role of debt denomination”. G. Kopis (ed.). Rules-based fiscal policy in emerging markets: background, analysis and prospects. Macmillan: London. (Forthcoming).
HOLLAND, M. (2005). External debt and debt intolerance: an empirical analysis. Berkeley: University of California, Center for Latin American Studies (Unpublished Manuscript).
IMF (2002). Assessing sustainability. IMF: Washington, D.C. May 2002.
IMF (2003). Sustainability assessments: review of application and methodological refinements. IMF: Washington, D.C. June 2003.
JEANNE, O. (2002). Why do emerging economies borrow in foreign currency?IMF: Washington, D.C. November 2002. (Unpublished Manuscript).
REINHART, C., ROGOFF, K and SAVASTANO, M. (2003). “Debt Intolerance”. NBER Working Paper9908. Cambridge, MA: NBER. August 2003.
REINHART, C., ROGOFF, K (2004). Serial default and the “paradox” of rich to poor capital flows. NBER Working Paper 10296. Cambridge, MA: NBER. February 2004.
REINHART, C. (2002). “Default, currency crises and sovereign credit ratings”. NBER Working Paper 8738. Cambridge, MA: NBER. January 2002.
WORLD Bank (2004). World Economic Indicators. (On Line). Washington, D.C: World Bank. WORLD Bank (2004a). Global Development Finance: harnessing cyclical for development.