Water for Life: The Impact of the
Privatization of Water Services on Child Mortality
Sebastian Galiani
Universidad de San Andres
Paul Gertler
University of California at Berkeley and NBER
and
Ernesto Schargrodsky
*Universidad Torcuato Di Tella
January 6, 2003
Abstract: While most countries are committed to increasing access to safe water and thereby reducing child mortality, there is little consensus on how to actually improve water services. One important proposal under discussion is whether to privatize water provision. In the 1990s Argentina embarked on one of the largest privatization campaigns in the world including the privatization of local water companies covering approximately 30 percent of the country’s municipalities. Using the varia tion in ownership of water provision across time and space generated by the privatization process, we find that child mortality fell 8 percent in the areas that privatized their water services; and that the effect was largest (26 percent) in the poorest areas. We check the robustness of these estimates using cause specific mortality. While privatization is associated with significant reductions in deaths from infectious and parasitic diseases, it is uncorrelated with deaths from causes unrelated to water conditions.
JEL: D60, H51, I10, I30, L33, O12
Keywords: privatization, child mortality, water provision, and poverty.
* Sebastian Galiani, Universidad de San Andres, Vito Dumas 284, (B1644BID) Victoria, Provincia de
At the 2000 Millennium Summit, member countries of the United Nations unanimously agreed on
a set of eight goals to reduce poverty by 2015; among which are reducing child mortality by
two-thirds and cutting in half the number of households that do not have access to safe water. These
two goals are interrelated in that clean water is critical to containing the spread of infectious and
parasitic diseases. Indeed, each year more than 3 million children die from preventable
water-related diseases (World Bank, 2002a), and a number of studies have found that access to safe
water is associated with better child health (Merrick, 1985; Behrman and Wolfe, 1987; the Cebu
Team, 1991; Esrey et al, 1991; Lavy et al, 1996; Lee et al, 1997; Jalan and Ravallion, 2002; inter
alia).
While most countries have committed to increasing access to safe water, there is little
consensus on how to actually achieve this goal. One proposal under consideration by many
governments is to turn water provision over to a regulated private sector. Governments who want
to privatize water systems are typically motivated by potential efficiency gains. They hope that
these efficie ncy gains will be translated into expanded access and enhanced service quality, and
thereby improve health outcomes. While there has been little privatization of water services
(World Bank, 2002a), a number of authors have reported large gains in productivity and
profitability associated with privatization in other sectors (Megginson et al, 1994; Barberis et al,
1996; Frydman et al, 1999; La Porta and Lopez-de-Silanes, 1999; inter alia).
In the water sector, however, it is not clear whether any efficiency gains from
privatization would necessarily be translated into improved health outcomes or help to alleviate
poverty. Indeed, recent public opinion polls and press articles report widespread discontent with
privatization in general in Latin America (Finnegan, 2002; IDB, 2002; McKenzie and Mookerjee,
2002; Tagliabue, 2002). Private water companies may provide sub-optimal service quality levels
because they fail to take into account the significant health externalities that are present in this
industry (Shir ley, 2000). In this case, privatization of water services may affect health outcomes
enforcement, and investment only in lucrative high-income areas (Estache et al, 2001; Birdsall
and Nellis, 2002). In this case, efficiency gains from privatization might be obtained at the cost of
excluding the poor from access to water services, and thus health outcomes of the poor may
actually deteriorate under privatization.
In this paper, we examine the impact of the privatization of water services on child
mortality in Argentina. Our study focuses on young children because they are particularly
vulnerable to water-related diseases due to weak body defenses, higher susceptibility, and greater
exposure from inadequate knowledge of how to avoid risks (WHO, 2002a). There are two main
disease transmission mechanisms generated by the lack of appropriate water systems: waterborne
diseases that occur by drinking contaminated water, and water-washed diseases that occur when
there is a lack of water and sanitation for household hygiene. Young children worldwide suffer
from several deadly diseases that could easily be prevented through the interruption of these
transmission mechanisms by access to safe and sufficient water supply and provision for the
hygienic removal of sewage (WHO, 2000). For example, diarrhea alone accounts for
approximately 15 percent of all child deaths worldwide (UNICEF, 2001). In Argentina, diarrhea,
septicemia, and gastrointestinal infections are three of the top ten causes of death for children
under five (Ministerio de Salud, 1999).
Our analysis takes advantage of the fact that local governments are responsible for
delivering water services and only some municipalities privatized those services. Between 1991
and 1999, about 30 percent of municipalities covering approximately 60 percent of the population
privatized their water services. This variation in ownership across time and space provides a
potential instrument to identify the causal effect of privatization on child mortality.
A major methodological concern, however, is that local governments choose to privatize
water services, and that choice may not be orthogonal to unobservable factors that also affect
In the end, despite the concerns about potential negative health effects, we find that the
privatization of water services is actually associated with a reduction in child mortality of 8
percent. Moreover, we find that most of the reduction in mortality occurred in low-income areas
(26 percent), where the network expansion was greatest. Finally, we check the robustness of
these estimates using cause specific mortality. While privatization is associated with significant
reductions in deaths from infectious and parasitic diseases, it is uncorrelated with deaths from
causes unrelated to water conditions.
1. THE ECONOMICS OF WATER SERVICE DELIVERY
Water systems include both the supply of clean water and the treatment and removal of sewage.
These services are a natural monopoly involving large fixed costs and significant economies of
scale (Noll et al, 2000).1 There is typically little competition to a well functioning water system from alternative sources (Foster, 1999; Estache et al, 2001). The main alternative is household
self-provision through pumped wells, rainwater catchments, cesspools, and septic tanks.
Self-provision suffers from low quality and high cost (Abdala and Spiller, 1999). Similarly, the sale of
drinkable water from private vendors is substantially more costly and therefore does not present
serious competition either. Finally, the average asset life of water systems’ physical plant is very
long and therefore impedes any potential dynamic competition.
The water sector is also characterized by the presence of significant externalities. Most
water-related diseases are contagious. This generates positive externalities in the provision of
clean water across society. Similarly, the proper elimination of sanitation residuals and treated
industrial waste prevents negative externalities through the pollution of natural bodies of water
and other natural resources.
1
Another special feature of water supply is that, as human life depends on access to
drinkable water, the demand for water is perfectly price inelastic at survival levels. Of course,
demand exhibits some price elasticity at levels for which water is used for other non-survival
household and productive uses.
These features -natural monopoly, presence of significant externalities, and inelasticity of
demand- have historically justified public intervention in the water sector. Most countries supply
water services through the public sector, and private entry into water provision has been limited.
However, there are growing calls to consider allowing a regulated private sector to deliver water
services (World Bank, 2002a).
Private supply has the advantage of providing strong incentives for cost reductions and
other productivity enhancements. In contrast, these incentives are weak under public ownership,
where typically agents cannot reap the results of their effort and innovation. In fact, empirical
evidence from several sectors strongly suggests that service quality, productivity and profitability
rise significantly following privatization (Megginson et al, 1994; Barberis et al, 1996; Frydman et
al, 1999; La Porta and Lopez-de-Silanes, 1999).
Nonetheless, the weak efficiency incentives in public firms might be tolerable when cost
reductions by private suppliers come at the expense of undesirable quality deterioration or
reductions in access by the poor. In particular, unregulated private providers may undersupply the
socially optimal quality of water in the presence of externalities because they fail to take into
account the marginal social benefits in their decisions. Similarly, private owners may exclude
low-income households from the network by raising prices, strictly enforcing payment, and
concentrating their investments in high-income areas.
However, the fear of quality deterioration or access exclusion can only be genuine when
supply conditions are non-contractible (Shleifer, 1998). In the water industry, information
water quality, pressure, repair delays, and shortages. Network expansions and universal coverage
can also be enforced through regulation.
The arguments in favor of private provision are even stronger when we consider
non-benevolent governments. Politicians may use the control of state firms to channel benefits for
themselves and their supporters (Shleifer and Vishny, 1994). Excess employment, corruption,
subsidies, and pork barreling are typical of state owned enterprises (SOEs) around the world. As
Shleifer (1998) explains it, state companies not only are unproductive because of the lack of
managerial incentives, but also because inefficiency results from the political use of SOE
resources.
Finally, the process of resource allocation within the aggregated public sector does not
guarantee the assignment of funds to the most profitable projects. The chronic under-investment
in physical capital that plagues many SOEs is aggravated for debt-ridden governments with large
fiscal deficits. Privatization can significantly improve the access of firms to capital markets and
therefore boost their ability to invest.
2. THE ARGENTINE PRIVATIZATION PROGRAM
The privatization of public water systems in Argentina represented a small part of a massive
program that transferred almost all SOEs to private hands during the 1990s. The privatization
process was, in turn, a part of a larger program of structural reform intended to revert decades of
economic decline.
In the late 1980s Argentina was experiencing growing inflation driven in large part by
printing money to finance huge fiscal deficits. The deficit averaged approximately 9% of GDP
during the decade (Heymann and Navajas, 1989). While federal and provincial overspending
generated the lion’s share of these deficits, a non-trivial portion was due to significant SOE
losses. By the end of the decade the ruling Radical government was unable to balance the budget.
1989 the country entered a period of hyperinflation that lead the Radical government to resign six
months before the official end of their administration.
The newly appointed Peronist government immediately launched an ambitious structural
reform program designed to reduce the budget deficit, control inflation and put the country back
on a positive growth path. The program consisted of financial and trade liberalization, a
monetary currency board, the decentralization of health and educational services, the reform and
privatization of the national pension system, the emancipation of the Central Bank, a general
deregulation of economic activities, and the privatization of SOEs.
The privatizations were intended to reduce the budget deficit (Galiani and Petrecolla,
1996; Gerchunoff, 1992; Heymann and Kosacoff, 2000). The acquiring firms paid the
government substantial sums for the privatized companies in the form of cash and Argentine
external debt bonds. In addition to the revenues from privatization, the government no longer
needed to cover SOE losses from the budget.
The privatization was also intended to reverse a long period of physical infrastructure
neglect (Chisari et al, 1999). During the 1970s and 1980s there was little capital investment in
most public utilities and indeed much of the physical infrastructure had seriously depreciated.
After this long period of negative net investments, huge capital inflows were needed to improve
both the quality and access to SOE services. While the public sector had no capacity to finance
those capital investments, private firms generating positive cash-flows were able to obtain private
financing. Indeed, the transfer of the SOEs to the private sector, mostly to large foreign
companies, greatly improved the firms’ investment and access to credit markets (Heymann and
Kosacoff, 2000; Galiani et al, 2002). Most of the privatized firms sold equity and bonds in
international capital markets.
Argentina implemented one of most ambitious privatization programs in the world.
monopolies in sectors such as electricity, oil and natural gas, telecommunications, transportation,
mail service and water systems. According to the official statistics (CEP, 1998), 154 privatization
contracts were signed during the 1990s. The privatization revenues collected by the federal
government reached more than 19 Billion US dollars. This figure understates the true amount of
revenues obtained from privatization, as it does not include revenues from royalties received from
SOEs that were privatized as concessions, and revenues from the privatization of provincial and
local SOEs. As a percentage of public resources, privatization revenues were particularly
important during the initial years of 1991 and 1992, when they represented more than 1% of GDP
and approximately 10% of public revenues (Heymann and Kosacoff, 2000).
The privatization of the water sector was but a very small portion of the overall
privatization program. In fact, the water companies represented only a small fraction of the total
SOE production (3.5 percent) and a tiny share of GDP (0.3 percent).
3. THE PRIVATIZATION OF WATER SERVICES
From 1870 through 1980, water services in Argentina were provided by the federal company
Obras Sanitarias de la Nación (OSN) and a number of not-for-profit cooperatives. In 1980, OSN’s
jurisdiction was restricted to the federal district and 17 municipalities of the suburban Greater
Buenos Aires area. While OSN remained under control of the federal government, the
responsibility for public water services in the rest of the country was transferred to local
governments (Artana et al, 2000). Most of the companies provided both water and sanitation;
however, a few supplied only water. In these cases, there was no sewage service in the
community.
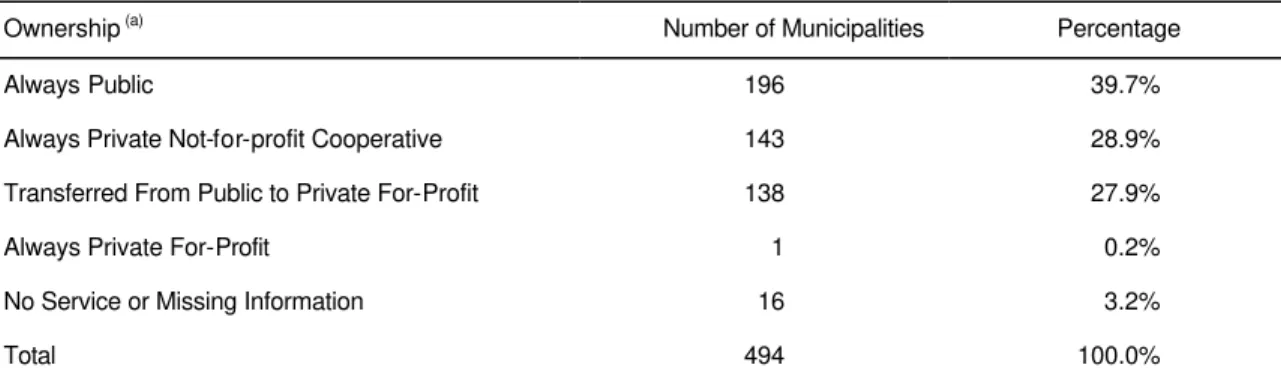
In 1990, before privatization, public companies provided water services in two-thirds of
the municipalities while not-for-profit cooperatives provided services in the remaining one-third.
Between 1991 and 1999, about half of the public water companies servicing 28 percent of the
transferred to private for-profit control (see Table 2). The remaining municipalities continued
receiving water services from either public companies or nonprofit cooperatives.2
In section 2, we argued that the privatization of water services was a small part of a
political response to the macro-economic crisis around the turn of the decade. Unlike most
sectors that were privatized, the water sector is controlled at the local level, and therefore, the
decision to privatize is a local one. In the early 1990s, the newly installed federal government
focused its efforts on privatizing the larger centrally controlled SOEs and did not put pressure on
local governments to privatize their SOEs until later. Indeed, the privatization of water services
accelerated after the elections in 1995, in which the ruling Peronist government was re-elected.
This is reflected in Figure 1, which depicts the percentage of municipalities served by private
water companies over time. Notice that the rate of privatization of municipalities was slow in the
first half of the decade, but accelerated in the second half.
Another hypothesis, which is not incons istent with the political story, is that poorer
municipalities with a lower tax base or underdeveloped infrastructure choose to privatize. These
are the municipalities that may have had the most to gain from privatization. This hypothesis
states that when the whole country started privatizing all SOEs, the municipalities that jumped on
the bandwagon were the poorer ones.
However, the hypothesis that poor areas jumped on the privatization bandwagon is
different from the hypothesis that the decision to privatize was in response to an economic shock.
Whether privatization is driven by time varying shocks is important to the subsequent impact
analysis. We propose to exploit the variability in firm ownership across time and space to identify
the causal effect of privatization on child mortality using a difference in difference approach in
regression form. While this approach controls for time invariant heterogeneity, one of the main
threats to its validity is the existence of time-varying unobserved covariates that are correlated
with both privatization and mortality. For example, local economic shocks may affect both the
privatization decision and child mortality. While we cannot test this directly, if we find that the
decision to privatize is uncorrelated with observed time-varying covariates, then it is less likely to
be correlated with unobserved ones.
In order to better understand why some local governments choose to privatize, we
estimate a discrete time hazard model of the probability of transiting from public to private water
service provision using methods described in Prentice and Gloeckler (1978) and Jenkins (1995).
We model the probability that a public water system in a given municipality and period of time is
privatized as a function of a set of municipality time-invariant and time-varying covariates, and
allow for duration dependence.3
First, we include a set of political variables that indicate whether the privatization
decision was taken by the central government or by a local government of a particular political
affiliation. One would expect that the public water systems controlled by the federal government
and local governments controlled by the party in power (Peronist) or provincial parties allied with
the Peronists, would be more likely to privatize than municipalities controlled by the opposition
Radical party.
One also might expect that poorer regions are more likely to privatize. We measure the
socio-economic status of the areas using time-invariant covariates including GDP per capita,
income inequality, and unemployment, and a set of characteristics from the 1991 Census such as
the proportion of households who have unmet basic needs, housing characteristics, and
demographic characteristics of the heads of households.
Another hypothesis is that it is not the level of socio-economic status that matters, but
rather socio-economic shocks that cause institutional change. We test this hypothesis by
3
including changes in GDP per capita, income inequality, and unemployment lagged one year.
We use lagged shocks for two reasons. First, the privatization itself may have affected these
time-varying variables, and, second, the long length of time required by privatization processes
suggests that the privatization decisions could not have been a response to contemporaneous
shocks.
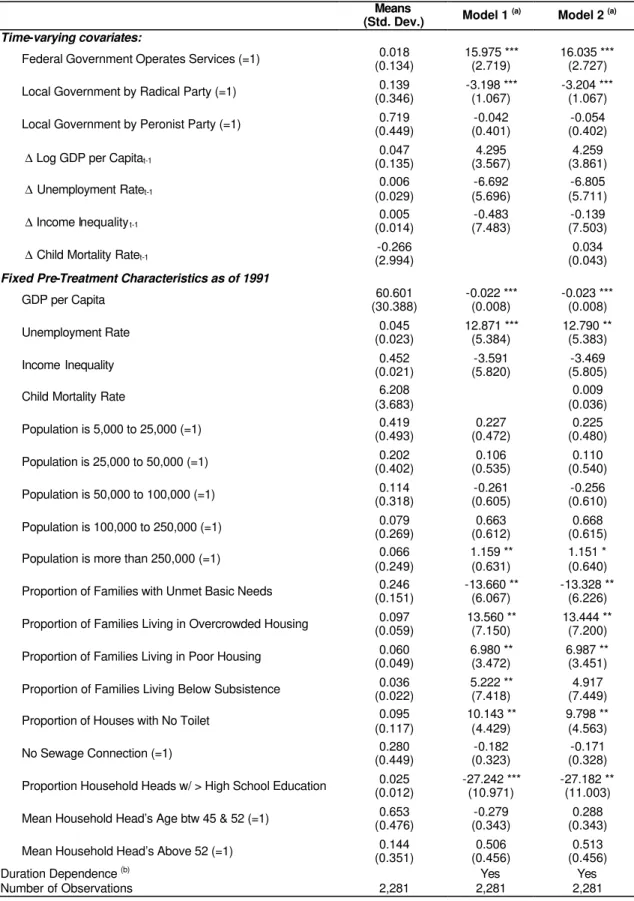
The results are reported in the second column of Table 3. First, as expected, we find that
the likelihood of privatization is higher when the federal government or a local government run
by the Peronist (or a provincial allied) party administers the public company than when the
Radical party controls local government. This is consistent with the fact that the federal
government launched the privatization wave of all SOEs, when the Peronists were the party in
power and the Radic als were loyal opposition. Second, we used a fifth order polynomial to
control for duration dependence, which shows that the likelihood of privatization increased over
time. This is consistent with the sequencing of the overall privatization program where the
transfer of water systems to private operation occurred later in the decade. Third, the fixed
baseline municipality socio-economic characteristics are individually and jointly significantly
different from zero, and explain a good portion of the decis ion to privatize. Larger and less well
off municipalities appear to be more likely to privatize. Fourth, and more importantly, none of the
economic shocks are statistically significant.
While the results discussed above suggest that the decision to privatize is uncorrelated
with economic shocks, it might be correlated with mortality for other reasons. Therefore, in the
third column of Table 3 we include both the 1991 mortality rate and lagged changes to mortality.
In this model we find that both baseline mortality and lagged mortality are not correlated with the
4. PATHWAYS
There are a number of potential pathways by which the privatization of water systems might have
affected child mortality. First, privatization may have expanded the water supply and sewage
network providing access to service to households that were not previously connected to water
and sewage. Second, there may have been improvements in service quality in terms of reduced
water and sewage spillage, faster repa ir rates, fewer shortages, cleaner water, and better water
pressure and sewage treatment. All of these quality enhancements improve the epidemiological
environment (WHO, 2002b). Finally, prices may have changed and the enforcement of service
payment cutoffs may have tightened, potentially reducing the access to service by low-income
households. In this section, we present evidence that privatization affected these pathways.
4.1. A Case Study
The largest privatization was the transfer of the federal company OSN to a private
consortium, Aguas Argentinas. The analysis of this privatization, described in Abdala and Spiller
(1999), Artana et al (2000), Shirley (2000), and Noll et al (2000), illustrates the changes
experienced by water systems in Argentina after the transfer to private operation.
Rather than selling the assets to the private firms, water services were transferred to the
private sector through concessions.4 In some cases, such as OSN in Buenos Aires, the royalty was set at zero and firms competed for the concession by offering the lowest tariff. In other cases, the
privatized companies paid a canon to the government for the use of the public assets. For
example, in the provinces of Cordoba and Corrientes, where a canon is paid on an annual basis,
the royalty payments represented about 0.4% and 0.1% of the fiscal revenues in 1999,
respectively. Thus, the revenue from the water service privatization royalties constituted at best a
very small share of the public budget.
4
In May 1993 Aguas Argentinas, a consortium lead by the French company Lyonnaise des
Eaux, won a 35-year concession to provide water services previously provided by OSN. The
terms of the concession stipulated that 100% of households had to be connected to water service
and 95% to sewage service by the end of the 35-year period. It also established service quality
and waste treatment standards.
Water use fees in Buenos Aires were initially lowered by 26.9 percent as a result of the
privatization bid. However, thirteen months after privatization, the regulator authorized a 13.5
percent increase in the usage fee, and a significant increase in connection fees. The increase in the
connection fee was controversial as it was very close to the monthly household earnings level for
the official poverty line. In response to protests, the connection fee was quickly lowered and
replaced with a small fixed charge that was added to the water use bills for all clients. This
explicit cross-subsidy allowed the firm to reduce the connection fees to about one tenth of the
previous levels.
The enforcement of service payment was toughened after privatization. While
delinquency was high for OSN, the private operator was allowed to cut service to customers with
three unpaid bills (although it could be reconnected under the regulator’s request). According to
Artana et al (2000) and Water World Vision (2000), over 90 percent of customers regularly pay
the service fees, although only about 60 percent do it on time.
Privatization drastically increased efficiency and profitability. Before privatization, OSN
was overstaffed as indicated by the fact that employees’ average age was above 50 years and
absenteeism was high. During the first year under private management, the number of employees
was reduced from 7365 to 3800. The employment reduction, together with the increase in
coverage and production, resulted in large productivity increases. In fact, soon after the
privatization, the financial performance of Aguas Argentinas became outstanding. After a first
A major question was whether these efficiency gains were translated into service quality
improvements. OSN had invested very little in infrastructure during the decade prior to
privatization (Galiani et al, 2002). Low revenues and inefficiencies led to such low investment
levels that they were not even sufficient to replace depreciating assets and maintain current
supply. In 1985 OSN investment was 67.8 percent of what was needed to maintain current
supply, and only 19.5 percent in 1990.5 In the late 1980s, water coverage as a share of population was contracting, spilled water rates were very high, pressure and service quality were low, and
summer shortages were frequent (Artana et al, 2000).
Things improved dramatically after the privatization. The private company was able to
invest a substantial amount in physical infrastructure and service quality. For the ten years before
the privatization, OSN invested an average of 25 Million US dollars annually. From 1993 through
2000, Aguas Argentinas’s investment jumped to around 200 Million per year. Table 4 shows
large increases in water and sewage production, reductions in spillage, and significant service
enhancements. In addition, summer water shortages disappeared, repair delays shortened, and
water pressure and cleanliness improved.
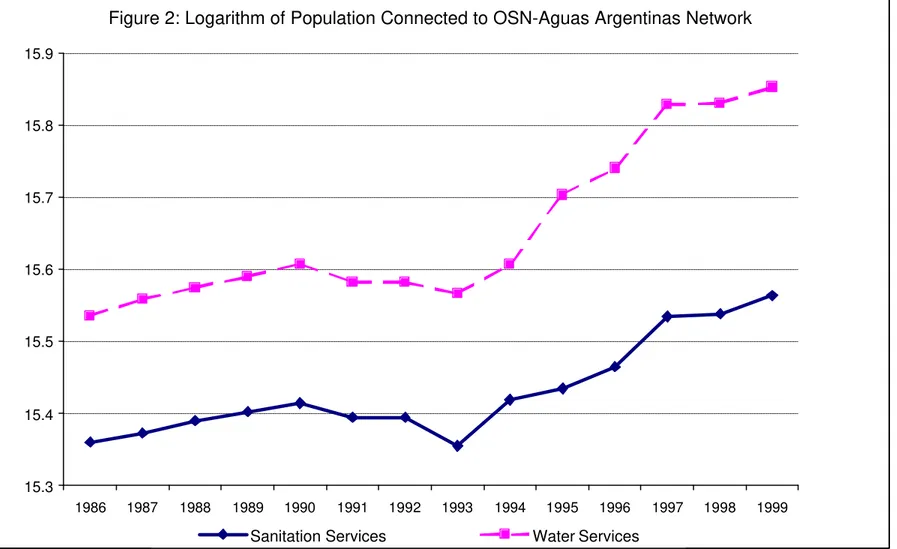
The investments also paid off in terms of increased access to the network. The number of
connections to the water and sewage networks in Buenos Aires expanded by 30 percent and 20
percent, respectively, after privatization. Figure 2 pictures the log of the number of households
connected to the OSN-Aguas Argentinas water and sewage network by year from 1986 through
1999. While the number of households connected was relatively flat from 1986 to 1993, the
network grew rapidly each year after privatization.
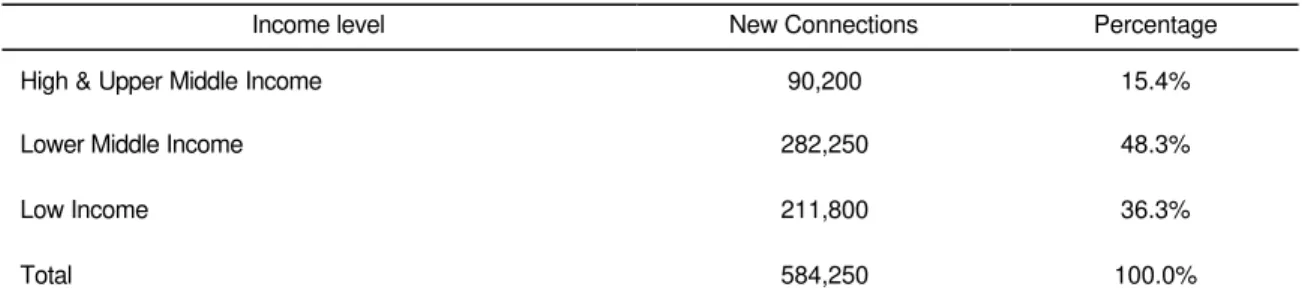
Moreover, the network expansion was concentrated in the poorer suburban areas of
Greater Buenos Aires. Since 98% percent of households in the city of Buenos Aires were already
connected to water services before privatization, most of the expansion in access necessarily had
5
to be among lower income households in the suburban areas. Indeed, Table 5 shows that 84.6
percent of the new connections were to lower-middle and low-income households.
4.2. Access to Water Services
While the data for Buenos Aires show that the privatization improved service quality and
expanded access to water services, we are unable to similarly assess the impact of privatization
for the rest of the country. We are, however, able to say something about the effect of
privatization on access to water services. Even though increased access may not be the only
mechanism through which privatization can affect child mortality, it is probably one of the most
important causal channels. Indeed, acquiring water services for the first time is likely to imply a
more important change in access to safe water relative to service improvements to households
with existing water and sewage connections.
We evaluate the impact of privatization on access to water services using data from the
1991 Census and the 1997 Encuesta de Desarrollo Social (EDS). The EDS was a stratified
random survey of about 30,000 households from urban municipalities with more than 5,000
inhabitants, and asked questions about household connections to water services identical to those
asked in the Census.
To identify the effect of privatization on access to water, we exploit the fact that by 1997
a number of municipalities had already privatized their water services (Figure 1). Using the data
from municipalities in the EDS survey, we calculate the difference-in-differences estimate of the
impact of privatization on the proportion of households who had access to the water network. The
difference-in-differences estimator compares the change in the proportion of households
connected to water services in municipalities that privatized to the change in the proportion
connected in municipalities that did not privatize water services. For this exercise, a municipality
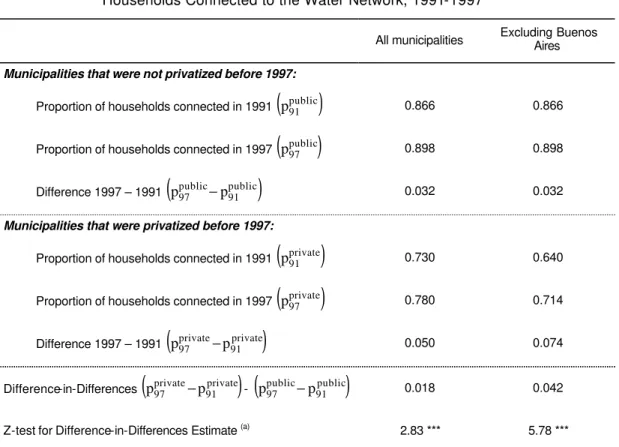
The results, reported in Table 6, show a significantly larger increase in the proportion of
households connected to water services in the municipalities that privatized than in municipalities
that did not. The estimated impact is even higher when we exclude the capital city, where 98
percent of households were already connected to water service before privatization. Specifically,
the results suggest that the number of households connected to the water network increased by 4.2
percentage points as an outcome of privatization.
This estimate, however, most likely underestimates the impact of privatization on access
for two reasons. First, it only includes the impact of privatization through 1997. In Cordoba, for
example, water services were privatized in that year and coverage increased by more than 10
percentage points in the first three years of concession. Second, the EDS grossly under-sampled
poor areas, and access expanded most in poor areas where fewer households were connected at
baseline.6 Indeed, Table 5 showed that connections increased the most among the poor in Greater Buenos Aires. And Artana et al (2000) reports that after privatization in Corrientes, one of the
poorest provinces in the country, the number of connections to the water network in the province
rose by 22 percent and the number of sewerage connections increased by 50 percent.
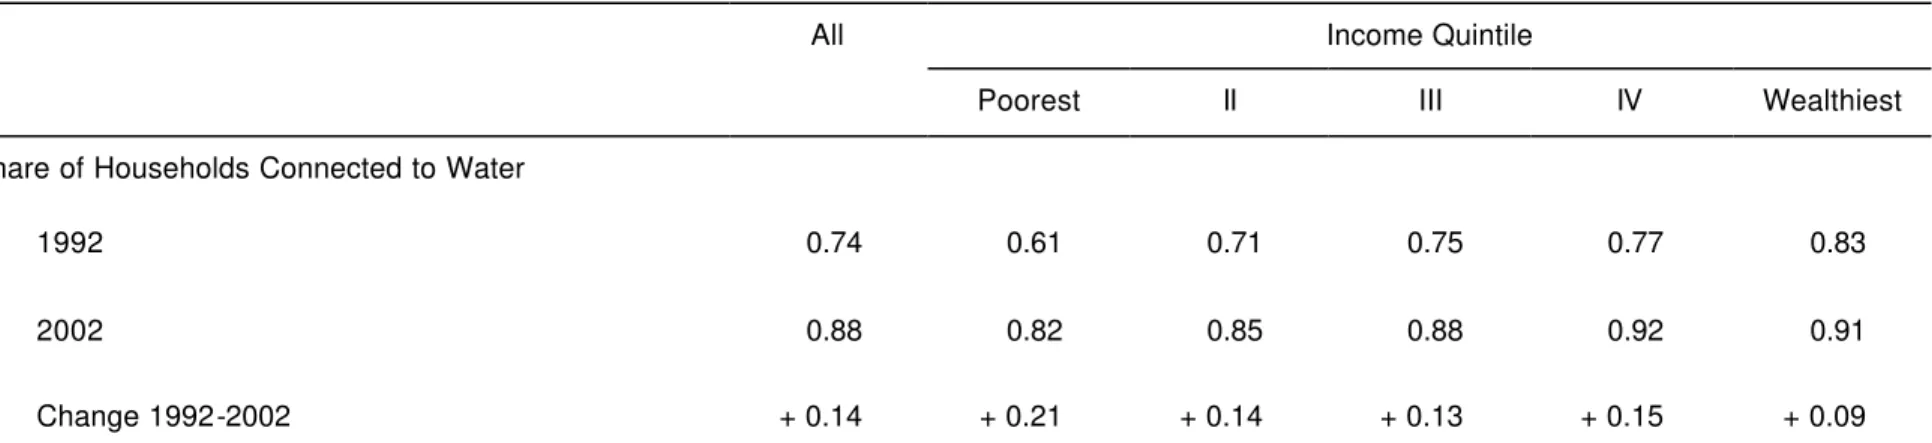
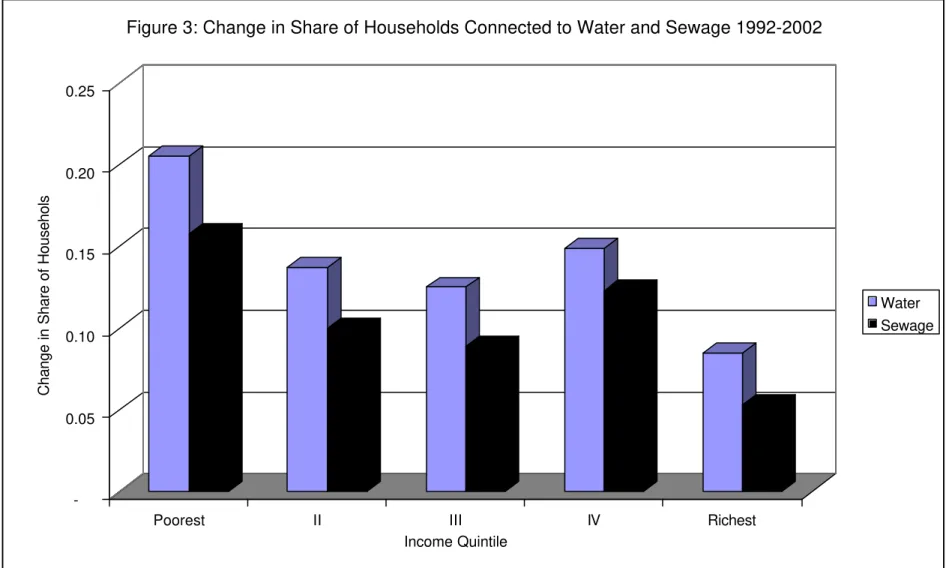
Finally, results from a recent World Bank household survey (2002b) confirm that
network expansions during the privatization period were concentrated in the poorer income
groups. The survey inquires about connections to water and sewage services in 1992 (prior to
almost all water privatizations) and again in 2002 (well after privatization). Table 7 reports the
share of households connected to the water and sewage networks in both years. Overall
household connection to the water network increased by 14 percentage points and to the sewage
network by 10 percentage points. However, most of the increase came from households in the
6
lower income groups. Indeed, connections to the water network increased by 21 percentage points
and to the sewage network by 16 percentage points among households living in the poorest
quintile of the income distribution (see Figure 3). Table 7 demonstrates that while the poor still
suffer the lowest connection rates, they have had the largest gains in access after 1993.
5. THE EFFECT OF PRIVATIZATION ON CHILD MORTALITY
In this section, we evaluate the impact of the privatization of water services on the mortality of
children under five. We focus on young children because they are particularly vulnerable to
water-related diseases due to weak body defenses, higher susceptibility, and greater exposure
from inadequate knowledge of how to avoid risks; and because water related diseases can easily
be prevented through access to clean drinking water, better hygiene and better sanitation (WHO,
2000).
5.1. Methods
Our objective is to identify the average effect of privatization on child mortality rates in
the municipalities where the water supply system has been privatized (i.e. the average impact of
treatment on the treated). Specifically, we are interested in comparing mortality when water
services are privately provided compared to the counterfactual—i.e. mortality when services are
publicly provided in the treatment areas at the same point in time. Since the counterfactual is
never observed, we must estimate it. In princip le, we would like to randomly assign private and
public ownership across municipalities and compare the average outcomes of the two groups. In
the absence of a controlled randomized-trial we are forced to turn to non-experimental methods
that mimic it under reasonable conditions.
A major concern is that the municipalities that chose to privatize could be different from
ones that privatize. In this case, the correlation between privatization and mortality would be
confounded with the wealth effect. In principle, many of the types of (unobservable)
characteristics that may confound identification are those that vary across municipalities, but are
fixed over time. A common method of controlling for time invariant unobserved heterogeneity is
to use panel data and estimate difference in differences models.
Therefore, without the benefit of a controlled randomized trail, we turn to a difference in
differences approach, which compares the change in outcomes in the treatment group before and
after the intervention to the change in outcomes in the control group.7 By comparing changes, we control for observed and unobserved time-invariant municipality characteristics that might be
correlated with the privatization decision as well as with mortality. The change in the control
group is an estimate of the true counterfactual—i.e. what would have happened to the treatment
group if there was no intervention. Another way to state this is that the change in outcomes in
treatment areas controls for fixed characteristics and the change in outcomes in the control areas
controls for time varying factors that are common to both control and treatment areas.
This difference-in-differences model can be specified as a two-way fixed effect linear
regression model:
it i t it it
it
a
dI
x
?
µ
e
y
=
+
β
+
+
+
(1)whereyit is the mortality rate in municipalit y i in year t, dIitis an indicator variable that takes on
the value one if municipality i´s water services are privately provided in year t and 0 otherwise,
xit is a vector of control variables that vary both across municipalities and time, µi is a fixed-effect
unique to municipality i, λt is a time effect common to all municipalities in period t, and εit is a
municipality time-varying error distributed independently across municipalities and time and
independently of all µi and λt (see Chamberlain, 1984; and Heckman and Robb, 1985). In this
7
model, α is the difference in difference estimate of the (average) effect of privatization of water
services on mortality.
There are three critical assumptions for α to be an unbiased estimate of the program
impact. The first is the assumption that the change in mortality in control areas is an unbiased
estimate of the counterfactual—i.e. what would have happened to mortality in the treatment areas
if water services had not been privatized. While we cannot directly test this assumption, we can
test whether the secular time trends in the control and treatment municipalities were the same in
the pre-intervention periods (Heckman and Hotz, 1989). If the secular trends are the same in the
pre-intervention periods, then it is likely that they would have been the same in the post
intervention period if the treated municipalities had not privatized.
The second concern is that there may be unobserved characteristics that vary across time
and space, and that are correlated with both mortality and privatization. For example, it could be
that the areas that privatized were also hit by positive economic shocks or there were
improvements in the health care system or increases in public welfare programs at the time they
privatized.
We address this concern in three ways. First, the analysis in section 3 provided evidence
consistent with the notion that privatization is driven by fixed characteristics and not by the
observed time-varying variables. This suggests that privatization is also less likely to be
correlated with time-varying location-specific unobserved shocks. Second, we directly control
for a number of observed time-varying economic and political characteristics such as GDP per
capita, unemployment, income inequality and local public spending. Finally, we investigate the
impact of privatization on mortality by cause of death. The privatization of water should affect
only mortality caused by infectious and parasitic diseases and not affect mortality from other
The third concern is that the impact of treatment on the treated may not be homogenous
across municipalities, but rather vary as a function of the characteristics of the municipalities.
For example, the impact of the privatization may matter more in areas where families are better
educated. In this case, simple difference in difference estimates may suffer from two additional
sources of bias (Heckman et al, 1997, and Heckman et al, 1998a). The first bias arises when there
are some municipalities where privatization has taken place, but there are no comparable
municipalities for which privatization did not occur and vice versa. The second bias may arise
from different distributions of the vector of observable variables that affect mortality (x)within
the two groups of municipalities.8,9
Matching methods eliminate these two potential sources of bias by pairing privatized
municipalities (treatments) with non-privatized municipalities (controls) that have similar
observed attributes. Using observations in the treatment and control groups over the region of
common support in the distribution of x eliminates the first source of concern, while the bias due
to different distributions of x between treated and untreated municipalities within this common
support is eliminated by reweighting the control group observations.
In general, conventional matching methods assume that, conditional on the observed
variables x, the counterfactual outcome distribution of the treated units is the same as the
observed outcome distribution of the units in the control group. This assumes that there is no
selection into treatment on the basis of unobservables. To avoid the necessity of this assumption,
Heckman et al (1998b) propose a generalized difference in differences matching estimator that
extends conventional matching methods to longitudinal data. By conditioning on fixed-effects,
the generalized difference-in-differences estimator identifies the parameter of interest without
ruling out selection into treatment on the basis of time-invariant unobservables.
8
The vector x includes variables that vary only across municipalities and also across time and municipalities.
9
The objective, then, is to construct a control group by finding controls that have similar
observed x’s as the treatments. Rosenbaum and Rubin (1983) show that to match treated and
untreated units on the basis of x is equivalent to match them using a balancing score B(x). The
coarsest balancing score is the propensity score which gives the conditional probability of
receiving treatment given the pre-treatment values of the vector x, i.e. P(x) = Pr(D = 1 | x). Then,
the method of matching assumes that conditional on P(x), the counterfactual outcome distribution
of the treated units is the same as the observed outcome distribution of the controls. This result is
very important in practice since it reduces the potential problem of matching on a high
dimensional vector x to matching on a scalar.
We estimate propensity scores from a logit model of the probability that a municipal
water system that was public in 1990 was privatized sometime before the year 2000 as a function
of the pre-intervention characteristics used in Column 2 of Table 3. These models are then used
to predict the propensity (probability) that a municipality will privatize.
We identify control and treatment observations on a common support as follows. We
exclude all control observations whose propensity scores are less than the propensity score of the
treatment municipality at the first percentile of the treatment propensity score distribution, and
exclude all treatment observations whose propensity score is greater than the propensity score of
the control observation at the 99th percentile of the control distribution. Then, our second set of estimates is obtained as difference-in-differences on the observations that lie on this common
support. Finally, we use a kernel density weighting procedure to obtain the generalized
difference-in-differences matching estimator (see Heckman et al, 1997).10
5.2. Measuring Mortality
The dependent variable in our analysis is the child mortality rate constructed from
information contained in vital statistics registries compiled by the Argentine Ministry of Health.
The database includes the 165,542 child deaths that occurred from 1990 through 1999,11 and is aggregated to the municipality level on an annual basis for 20 pathology groups
Mortality rates are traditionally defined as the probability a child dies before she reaches
age five, and is usually approximated by the number of deaths of children less than five years old
divided by the number of kids born that year. Applying this definition of child mortality to vital
statistics, the mortality rate in Argentina has fallen from 72 per 1,000 live births in 1960 to 22 in
1999.
Rather than using the probability that a child dies before she reaches age five, we prefer
to use the probability that a child less than five years old dies in a given year. Therefore, we
measure our dependent variable as the ratio of number of deaths of children less than five years
old to the total number of children less than five alive at the beginning of the year. We estimate
the total number of children using census data and the vital statistics records. Our results do not
change when we use the more traditional definition. In that case, the estimated coefficients are
equal to five times ours.
5.3. Control Groups
Our main result is evident in Figure 4, which depicts the evolution of the mortality rates
per 1,000 for privatized and non-privatized water companies. Until 1995, the mortality rates of
the municipalities that privatized their water systems decreased at the same rate as the mortality
rates of the municipalities that did not privatize. However, after 1995 the mortality rates of the
municipalities that privatized decreased faster than the mortality rates of those that did not
11
privatize. This timing is commensurate with the timing of privatization (Figure 1). Before 1995
only a few municipalities had privatized; whereas the bulk of privatizations occurred after 1995.
The fact that the levels and trends in mortality rates in both groups of municipalities were
the same before privatization is important. One of the threats to the validity of the
difference-in-difference approach is that the post intervention trend in the control group could be a poor
estimate of the counterfactual—i.e. what would have happened to the treatment group if there had
not been an intervention. Since the control and treatment group time trends are the same in the
pre-intervention period, it is hard to believe that they would be different in the post-intervention
period had there been no intervention. Moreover, not only do both groups have the same trends in
the pre-intervention period, they also have the same levels.
We formally test that the pre-intervention time trends for the control and treatment
groups are not different by estimating a slightly modified version of equation (1). We use only
the observations of the control municipalities and the treatment municipalities in the pretreatment
period—i.e. we use 1990-98 for all of the control municipalities and only the pre-intervention
years for the treatments municipalities. This covers nine of the ten years since a number of
treatment municipalities were not privatized until 1999, the last year of our sample. We modify
equation (1) by excluding the privatization dummy variable and including separate year dummies
for (eventual) treatments and controls. In this model, we cannot statistically reject the hypothesis
that the pre-intervention year dummies are the same for both the control and (eventual) treatment
municipalities at any conventional level of significance. This implies that the mortality rates in
treatment and control groups had identical time trends in the “pre-treatment” period and validates
our difference-in-differences identification strategy (Heckman and Hotz, 1989).
A related issue is that we are using both the municipalities that always had public
provision of water services and the municipalities that had nonprofit cooperatives as controls.
estimate separate year dummies for the always-public and cooperative municipalities in a
mortality model for the whole sample period, we do not reject the hypothesis that these year
dummies are the same at any conventional level of significance. This implies that the mortality
trends of the always public and cooperative municipalities were the same over the sample period,
and therefore they are equally as good in predicting the counterfactual. However, while the
cooperatives serve as valid controls for secular trends, our results can only be interpreted as the
impact of privatization of public companies on mortality and says nothing about the possible
privatization of cooperatives, as we observe no cooperatives converting to for-profit private
companies in the sample.
5.4. Main Results
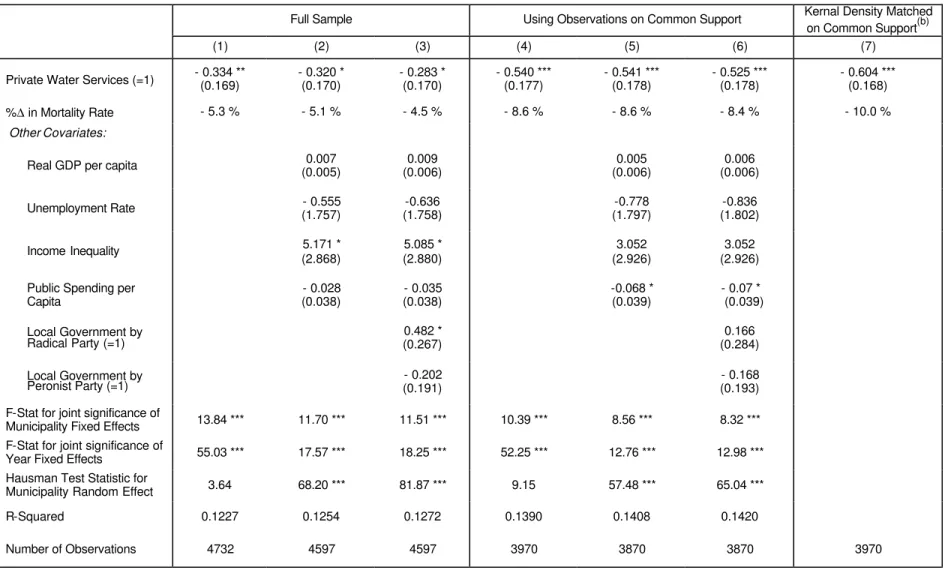
We present the estimation results for child mortality from all causes of death in Table 8.
Each column reports the results from a different specification using the same dependent variable.
The first three columns report the results for the whole sample, while the last four columns report
the results using municipalities only with observable characteristics on the common support of
the distribution of propensity scores.
The first column reports the results for a model using the whole sample and includes no
covariates except for municipality fixed effects and year dummies. We find that the privatization
of water services is associated with a 0.33 reduction in the mortality rate, which amounts to a 5.3
percent reduction of the baseline rate. Both the year and municipality fixed effects are jointly
significantly different from zero. However, a Hausman test cannot reject the hypothesis that the
fixed effect and random effect estimates are the same. This suggests that the treatment variable is
uncorrelated with the fixed municipality unobservables.
One concern with these results is that there may have been positive economic shocks to
municipalities that privatized, which caused the reduction in mortality. In order to test this
per capita in a model reported in column 2. The public spending variable controls for the
possibility that the impact of privatization is coming from correlated improvements in the local
public programs. However, only inequality appears to be significantly correlated with child
mortality at the ten percent le vel. More importantly, the estimated impact of privatization is
unchanged.
A related concern is that the same political parties that choose to privatize might, in
general, run better administrations or have stronger preferences for child mortality reduction in
ways not properly captured by the public spending variable. In model 3, we add dummy variables
for the political party that controlled the local government. While it appears that mortality rates
were marginally higher when the Radical party took over, the estimated impact of privatization
was unaffected. Overall, we find that privatization is associated with a significant reduction in
the child mortality rate of about 5 percent using the full sample regardless of the choice of
controls.
However, the estimated impact of privatization on mortality increases when we restrict
the sample to observations only on the common support of the propensity score. In columns 4
through 6 we report the results of estimating models 1 through 3 restricting the sample to
observations on the common support. In the basic model of column 4, privatization is associated
with an 8.6 percent fall in the child mortality rate. This estimate does not change when we control
for socio-economic characteristics in column 5 and for political variables in column 6. While
there is no longer a statistical difference in mortality by political party, increases in public
spending now appear to be significantly associated with lower mortality.
Finally, the generalized difference in difference estimate, which uses kernel density
weighted matches on the common support, is reported in the last column. The model estimates
that privatization is associated with a 10 percent reduction in the child mortality rate.
percent to 10.0 percent of the baseline mortality rate. While the addition of time-varying controls
does not change the estimated impact, conditioning on control and treatment observations that
have common support increases the estimated impact by over 60 percent. However, adding kernel
density weighted matching only increases the estimated impact by less than 20 percent. This is
consistent with the results in Heckman et al (1998a) where they evaluated matching estimates
using data from a controlled randomized experiment and found that the main source of bias
comes from not restricting the estimates to the observations on the common support.
5.5. Results by Cause of Death
In spite of the robustness of our results to the inclusion of the economic and political
controls, it is still possible that at the time of privatization there may have been some other
unobserved changes in the municipalities that privatized that are correlated with mortality in
general. For example, there may have been enhancements in the health care system or increases
in public welfare programs not captured by the public spending or political variables. It is also
possible that that there were different migratory trends among treated and untreated
municipalities.
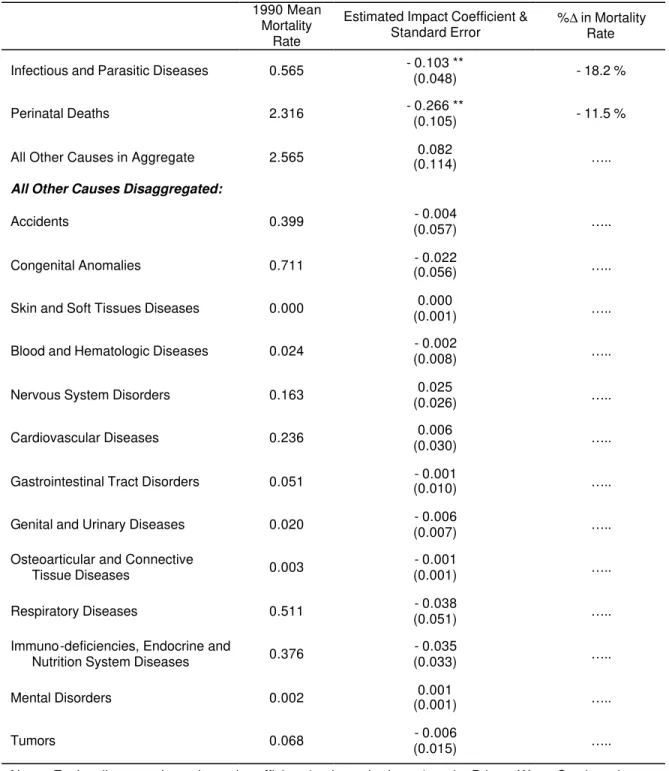
In order to rule out possible unobserved changes correlated with privatization, we
examine the impact of privatization on mortality by cause of death. The mortality data is
disaggregated for 20 specific pathology groups. The privatization of water provision on child
mortality should mainly operate by affecting deaths from infectious and parasitic diseases. These
deaths are classified into two of the pathology groups. If the death occurred after the first 28 days
of life, it is classified in the Infectious and Parasitic Diseases group. However, all deaths that
occurred during the first 28 days of life are placed into the Perinatal Deaths category, regardless
of the cause. Thus, even if the death occurred from an infectious or parasitic disease it is assigned
to the Perinatal Deaths during the first 28 days of life, and not to the Infectious and Parasitic
improved access and quality of water, then we should see significant negative effects on deaths in
the Perinatal Deaths and Infectious and Parasitic Diseases categories, and negligible effects on
deaths from other causes such as accidents, cardiovascular diseases, or cancer.
We estimate the difference in difference models using municipalities with common
support and all socio-economic and political controls for mortality rates for each cause of death.12
The results are reported in Table 9. As predicted, we find a statistically significant effect on
mortality from infectious and parasitic diseases (and perinatal deaths), but no statistically
significant effect on mortality from any other cause either separately or in aggregate. In fact, the
estimated impact is higher for infectious and parasitic diseases (18.2 percent) than for perinatal
deaths (11.5 percent). This is consistent with the fact that safe water potentially affects more of
the deaths in infectious and parasitic diseases category than it does for the perinatal category, in
which other non-water related diseases are also included.
The importance of this result cannot be overemphasized. Privatization could only be
spuriously capturing the effect of unobservables if those uncontrolled variables are correlated
with deaths from infectious and parasitic diseases, but not with deaths from any other cause. This
result rules out the presence of almost any other plausible explanation of our main results and
leads us to believe in their causal interpretation.
5.6. Impact by Socioeconomic Status
We hypothesize that privatization should have had a higher impact on child mortality in
poor municipalities than in wealthier ones. Middle and high-income groups already had a high
rate of connection to the water network prior to privatization. Even when they were not connected
or when service quality was unsatisfactory, these income groups enjoyed better access to
12
substitutes such as pumped wells, septic tanks, or bottled water than poor households. The main
beneficiaries of network expansions and service enhancements, therefore, were low-income
households who also are the groups most vulnerable to child mortality.
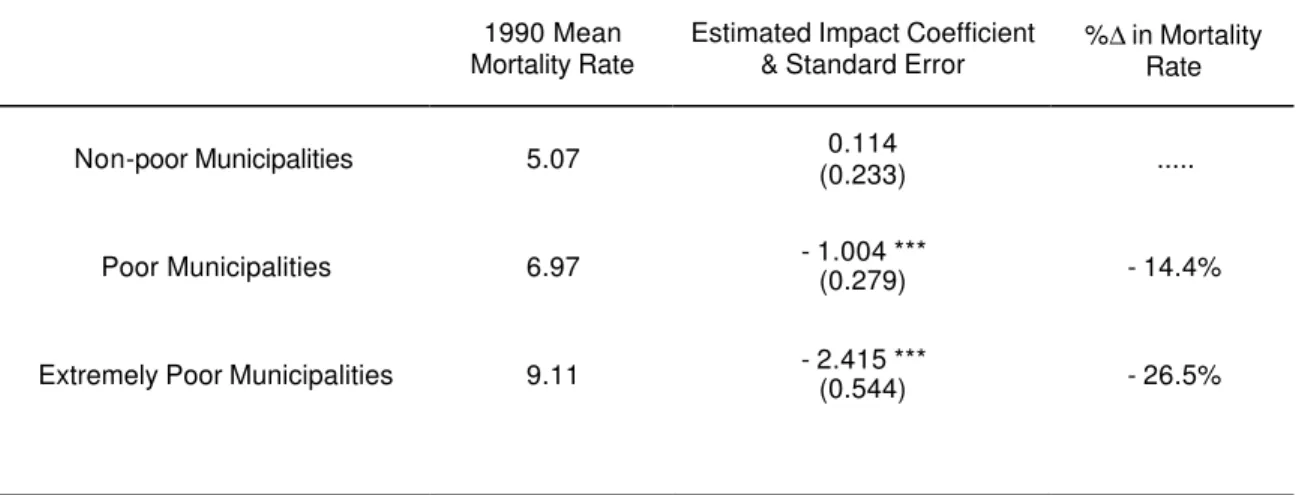
In Table 10 we report the estimated impact of water privatization on child mortality at
three different ranges of poverty at the municipality level. To estimate these heterogeneous
impacts of privatization on child mortality, we interact the treatment dummy variable with a
poverty indicator function from the 1991 Census. We construct three ranges of poverty:
municipalities with a percent of households suffering from Unmet Basic Needs (UBN) lower to
25%, municipalities with UBN between 25 and 50%, and municipalities with UBN higher than
50%.
We find that the privatization of water systems does not affect mortality in those
municipalities with low levels of poverty (UBN lower than 25%). The effect on the remaining
treated municipalities is increasing in the level of poverty and highly significant. In fact, the
privatization of water systems is associated with a 26.5 percent reduction in child mortality in
municipalities with high levels of poverty (UBN greater than 50%). This result is consistent with
the predictions of our causal model. The effect of privatization on child mortality should be
stronger for the groups that are more vulnerable to water related diseases.
6. CONCLUSIONS
During the 1990s Argentina launched a massive privatization program as part of a large plan of
structural reforms. The program included the privatization of local water companies providing
service to approximately 30 percent of the municipalities and 60 percent of the population.
Available information from a number of case studies demonstrates that the newly privatized
water firms were more efficient, invested more in physical infrastructure, and provided better
service quality than their previous public incarnations. Indeed, our evidence on access to service
We hypothesized that increased access to the water and sanitation network, and potential
changes in service quality, improved health outcomes of young children. Using a combination of
methods, we find that child mortality fell by approximately 8 percent in the areas where water
systems were privatized. A number of factors lead us to believe that the link between the
privatization of water systems and the decrease in child mortality is causal. First, privatization
decisions across municipalities and time do not depend on time-varying variables that may also
affect mortality rates. Second, the treatment and control groups showed similar trends in the
pre-intervention period. Third, water privatization affected child mortality from water-related diseases
but it showed no effect on deaths from other causes. Fourth, the impact of privatization was
largest in poorest areas.
Our results shed light on a number of important policy debates. First, while the previous
literature demonstrates that privatization raises firms’ productivity and profitability, it does not
address the question of whether privatization actually increases social welfare. We show that
privatization reduces child mortality, a direct and tangible welfare indicator.
Second, many fear that private operators would fail to take into account the significant
health externalities that are present in this industry, and therefore under-invest and supply
suboptimal service quality. On the contrary, our evidence suggests that the deterioration in
performance of water systems in Argentina under public management was so large that it allowed
for a privatization that generated private profits, improved access, expanded service, and reduced
child mortality. While the regulated private sector may not be providing first best services, they
seem to be doing a much better job than the public sector.
Finally, there is a growing public perception that privatization hurts the poor. This
perception is driven by the belief that privatized companies raise prices, enforce service payment,
and invest only in lucrative high-income areas. In contrast, we find that the poorest population
DATA APPENDIX: DEFINITIONS AND SOURCES
Variable Definition Source
Child Deaths Number of deaths of children less than 5 years old by
municipality by year by cause of death.
Ministerio de Salud de la República Argentina, 1990-99.
Child Population Number of children less than 5 years old by municipality by
year. Obtained by linear extrapolation from the 1991 Census using the 1990-2000 INDEC estimates of total municipality population.
INDEC, Censo Nacional de Población y Vivienda 1991. INDEC, Proyecciones de Población por Localidad 1990-2000.
Child Mortality Rate
=Child Deaths/ Child Population.
Private Water Services
Dummy variable = 1 if the largest fraction of the population in the municipality is supplied by a private water company, and 0 otherwise.
Sistema Permanente de
Información de Saneamiento, Ente Nacional de Obras Hídricas de Saneamiento, www.enohsa.gov.ar. Unemployment
Rate
Unemployment rate (Ma y and October average) for households in the surveyed cities of the province in which the municipality is located.
Permanent Household Survey (EPH), INDEC 1990-1999.
Income Inequality Gini Index (May and October average) for households in
the surveyed cities of the province in which the municipality is located.
See Unemployment Rate.
GDP Per Capita Per capita gross geographic product in hundreds of
constant pesos in the province in which the municipality is located.
Consejo Federal de Inversiones and INDEC.
Population Total population in the municipality in 1991. INDEC, Censo Nacional de
Población y Vivienda 1991. Overcrowded
Housing
Fraction of municipality’s households with an average of more than three people per room in 1991.
See Population.
No Toilet Fraction of municipality’s households with no fecal
evacuation system in 1991.
See Population.
Poor Housing Fraction of municipality’s households living in poor housing
in 1991.
See Population.
Below Subsistence
Fraction of municipality’s households with 4 or more members per working member and low household-head education in 1991.
See Population.
Unmet Basic Needs
Fraction of municipality’s households with Unmet Basic Needs (i.e. at least one of the following: Overcrowded Housing, No Toilet, Poor Housing, or Below Subsistence) in 1991.
See Population.
Household Head Age
Mean age of household heads in the municipality in 1991. See Population.
No Sewage Dummy variable = 1 if sewage was not provided in
municipality in 1991, and 0 otherwise.
See Population.
Unemployment 1991
Municipality unemployment rate in 1991. See Population.
Head Education above High School
Fraction of households where head has educational level above high school in 1991.
See Population.
Federal Government Operates Services
Dummy variable = 1 if the company providing water services depends on the federal government, and 0 otherwise.
See Private Water Services.
Local Government by Radical Party
Dummy variable = 1 if the Union Civica Radical party governs province in which the municipality is located, and 0 otherwise.
Jones et al (2000).
Local Government by Peronist Party
Dummy variable = 1 if the Peronist party governs province in which the municipality is located, and 0 otherwise.
See Local Government by Radical
Party.
Pub lic Spending Per Capita
Public spending per capita in hundreds of constant pesos in the province in which the municipality is located.
References
Abdala, M. and P. Spiller (1999): “Agua y Saneamiento”, in Instituciones, Contratos y Regulación en Argentina, Buenos Aires: TEMAS.
Angrist, J. (1995): “Introduction to the JBES Symposium on Program and Policy Evaluation”,
Journal of Business and Economic Statistics 13, pp. 249-88.
Armstrong, M., S. Cowan, and J. Vickers (1994): Regulatory Reform: Economic Analysis and British Experience, Cambridge: MIT Press.
Artana, D., F. Navajas and S. Urbiztondo (2000): “Governance and Regulation in Argentina”, in Savedoff, W. and P. Spiller (eds.), Spilled Water, Washington D.C.: IDB Press.
Barberis N., M. Boycko, A. Shleifer and N. Tsukanova (1996): “How Does Privatization Work? Evidence from the Russian Shops”, Journal of Political Economy 104 (4), pp. 764-90. Behrman, J. and B. Wolfe (1987): “How Does Mother’s Schooling Affect Family Health,
Nutrition, Medical Care Usage and Household Sanitation?”, Journal of Econometrics 36, pp. 185-204.
Bertrand, M., E. Duflo and S. Mullainathan (2001) “How Much Should We Trust Differences-in-Differences Estimates?”, mimeo.
Birdsall, N. and J. Nellis (2002): “Winners and Losers: Assessing the Distributional Impact of Privatization”, Working Paper Number 6, Center for Global Development.
Cebu Team (1991): “Underlying and Proximate Determinants of Child Health: The Cebu Longitudinal Health and Nutrition Survey”, American Journal of Epidemiology 33 (2), pp. 185-201.
CEP (1998): “Privatizaciones: Un Balance Cuantitativo”, Buenos Aires, Ministerio de Economía, www.minproduccion.gov.ar/cep_anteriores/notas/notas8/nota3.htm.
Chamberlain, G. (1984): “Panel Data”, in Griliches, Z. and M. Intriligator (eds.), Handbook of Econometrics, Volume 2, Amsterdam: North-Holland.
Chisari, O., A. Estache, and C. Romero (1999): “Winners and Losers from the Privatization and Regulation of Utilities: Lessons from a General Equilibrium Model of Argentina”, World Bank Economic Review, 13 (2), pp. 357-78.
Esrey, S., J. Potash, L. Roberts, and C. Shiff (1991): “Effects of Improved Water Supply and Sanitation on Ascariasis, Diarrhea, Dracunculiasis, Hookworm Infection, Schistosomiasis and Trachoma”, Bulletin of the World Health Organization, 69 (5), 609-21.
Estache, A. , A. Gomez-Lobo, and D. Leipziger (2001): “Utilities Privatization and the Poor: Lessons and Evidence from Latin America”, World Development, 29 (7), pp. 1179-98. Foster, V. (1999): “Literature Review for Regional Studies Project on Privatization and
Infraestructure Services of the Urban Poor”, mimeo, World Bank.
Finnegan, W. (2002): “Letter from Boliv ia: Leasing the Rain”, The New Yorker, April 8, pp. 43-53.
Frydman, R., C. Gray, M. Hessel, and A. Rapaczynsku (1999): “When Does Privatization Work? The Impact of Private Ownership on Corporate Performance in the Transition
Galiani, S. and D. Petrecolla (1996): “The Changing Role of the Public Sector: An Ex-post View of the Privatization Process in Argentina”, Quarterly Review of Economics and Finance
36 (2), pp. 131-52.
Galiani, S., P. Gertler, E. Schargrodsky and F. Sturzenegger (2002): “The Benefits and Costs of Privatization in Argentina: A Microeconomic Analysis”, forthcomingin Chong, A. and F. Lopez-de-Silanes (eds.), The Benefits and Costs of Privatizations.
Gerchunoff, P., editor (1992): Las Privatizaciones en Argentina - Primera Etapa, Buenos Aires: Instituto Torcuato Di Tella.
Heckman, J. and V. Hotz (1989): “Choosing among Alternative Non-experimental Methods for Estimating the Impact of Social Programs: The Case of Manpower Trainin g”, Journal of the American Statistical Association 84 (408), pp. 862-74.
Heckman, J., H. Ichimura and P. Todd (1997): “Matching as an Econometric Evaluation Estimator: Evidence from Evaluating a Job Training Program”, Review of Economic Studies 64 (4), pp. 605-54.
Heckman, J., H. Ichimura, J. Smith and P. Todd (1998a): “Characterizing Selection Bias using Experimental Data”, Econometrica 66 (5), pp. 1017-98.
Heckman, J., H. Ichimura and P. Todd (1998b): “Matching as an Econometric Evaluation Estimator”, Review of Economic Studies 65 (2), pp. 261-94.
Heckman, J., R. LaLonde and J. Smith (2000): “The Economics and Econometrics of Active Labor Market Programs”, in Ashenfelter, O. and D. Card (eds.), Handbook of Labor Economics, Volume 3A, Amsterdam: North-Holland.
Heckman, J. and R. Robb Jr. (1985): “Alternative Methods for Evaluating the Impact of Interventions: An Overview”, Journal of Econometrics 30 (1-2), pp. 239-67.
Heymann, D. and B. Kosacoff (2000): La Argentina de los Noventa. Desempeño Económico en un Entorno de Reformas, Buenos Aires: EUDEBA.
Heymann, D. and F. Navajas (1989): “Conflicto Distributivo y Déficit Fiscal. Notas sobre la Experiencia Argentina, 1970-1987”, Desarrollo Económico 29 (115), pp. 309-29. IDB (2002): “The Privatization Paradox”, Latin American Economic Policies 18.
Jalan, J. and M. Ravallion (2002): “Does Piped Water Reduce Diarrhea for Children in Rural India?”, forthcoming in Journal of Econometrics.
Jenkins, S. (1995): “Easy Estimation Methods for Discrete-time Duration Models”, Oxford Bulletin of Economics and Statistics 57 (1), pp. 129-138.
Jones, M., P. Sanguinetti and M. Tommasi (2000): “Voters as Fiscal Liberals”, mimeo, Centro de Estudios para el Desarrollo Institucional (CEDI).
La Porta, R. and F. Lopez-De-Silanes (1999): “The Benefits of Privatization: Evidence from Mexico”, Quarterly Journal of Economics 114 (4), pp. 1193-1242.
Lavy, V., J. Strauss, D. Thomas, and P. de Vreyer (1996): “Quality of Health Care, Survival and Health Outcomes in Ghana”, Journal of Health Economics 15, pp. 333-57.
Lee, L., M. Rosenzweig, and M. Pitt (1997): “The Effects of Improved Nutrition, Sanitation, and Water Quality on Child Health in High-Mortality Populations”, Journal of Econometrics