EAESP-FGV
RELATÓRIO DE PESQUISA - NPP
HOW MUCH DOES COUNTRY MATTER?
Prof. Flávio C. Vasconcelos
Professor Adjunto do Departamento de Administração Geral e Recursos Humanos
da FGV-EAESP, Doutor em Administração pela Ecole des Hautes Etudes
Commerciales de Paris, Mestre em Sociologia pelo Institut d’Etudes Politiques de
Paris, Bacharel em Administração Pública pela FGV-EAESP e em Direito pela
How much does country matter?
Abstract
Several factors affect firms’ performance. Components of variance technique has been used to identify and quantify industry, firm and corporate effects using data of US business environment establishing an active debate between the structure-conduct-performance model and the resource-based view in strategy. Using data from the COMPUSTAT global database, covering 78 countries, this paper proposes and analyzes a new type of effect: the country effect. An empirical study with 60,092 observations, 12,592 firms, and 448 industry sectors shows that country effects do exist, and quantifies them for different economic sectors. The research also estimates the country-industry interaction that could be linked to the phenomenon of clusters and reassesses the composition of performance variance for an international environment identifying similarities and differences to previous studies using US data only.
Introduction
Variance components technique can offer interesting insight on the assessment of the several types of effects that determine performance in a descriptive approach. After the original works of Schmalensee (1985) and Rumelt (1991), several authors studied the structure of performance variance, decomposing it into firm, corporate, industry and year effects (Roquebert, Phillips and Westfall, 1996; Mauri and Michaels, 1998; Brush, Bromiley and Hendrickx, 1999; McGahan, 1999; Chang and Singh, 2000; Hawawini, Subramanian and Verdin, 2003; McGahan and Porter, 1997, 2002; McNamara, Vaaler and Devers, 2003;).
The vast majority of these studies indicate firm effects as the dominant component of explained variance. This has fueled the debate between the industrial organization derived approach to strategy and the resource-based view. The importance of corporate effects has had contradictory findings and seems to be sensitive to the sample and period analyzed. Year effects were, normally, found to be very small or non-existent. All the studies previously cited were done on US data and depict the business environment of US economy. One of the few, perhaps, the only paper published on this subject, analyzing the performance variance of firms outside the US, was done by Claver, Molina and Tarí (2002) and the results, analyzing a set of Spanish firms, have shown a performance variance composition similar to what was found in the US. There is very little evidence to support that it is possible to generalize the findings from US data to the rest of the world. In the globalized economic environment of today, it is unnecessary to stress the importance of this shortcoming.
This paper intends to contribute the effort of reducing the above mentioned shortcomings of current knowledge. The first objective is to detect the country influence in the heterogeneity of performance. Drawing from previous research on variance components, a new type of effect, the country effect, was conceived. The country effect captures the influence of particular countries in all firms belonging to it. It should represent factors in that country economy that influence performance in a positive or negative way like severe recessions or extreme prosperity and growth, specific to that country. In other words, our first objective is to answer the question: does country matter? A significant country effect will mean that these factors do explain part of the total observed variance in performance. The second objective is to answer the logical follow up question: how much does country matter? This will be done by quantifying the magnitude of this effect in different economic sectors.
Country effects, however, may not be independent from other effects. Country related factors may affect only a few industries and be neutral to others. The third objective is thus to expand the findings of the first and second objectives by identifying and quantifying the country – industry interaction with a model that includes this interaction as a variance component.
Finally, this paper will assess the performance variance composition of firms in 78 different countries. The fourth objective is then to assess the performance variance composition in a truly international environment, expanding what was done by previous studies that used mainly US data. The COMPUSTAT global database was used as a source of data. A subset of this database covering results of 12,592 firms during 1997 to 2001, operating in 78 countries, with a total of 60,092 observations was selected.
in a positive or negative way the performance. Understanding and mapping the performance distribution is, however, useful. If a large proportion of variance in attributable to a certain factor it is logical that specific aspects encompassed by that factor are worth studying and the opposite is true.
Initially, previous studies on performance variance components are reviewed. The main theoretical streams relating performance and location are then covered. The variance components method, the choice of performance measurement used, and the characteristics of the database are described in the Method and Data section. Results and the discussion follow and a section on conclusions is presented. A final section on directions for future research proposes possible links of this line of strategy research with the new institutional economics and development economics fields.
Reviewing previous studies on variance components
Schmalensee (1985) published a seminal paper using data from the Federal Trade Commission (FTC), year of 1975, analyzing the results of 1,775 business units. Industry effects accounted for 19-20% of total variance. One of the important points of the research resided, however, in what was not found rather than what was unveiled. Recognizing that the model could not explain 80% of the variance of business profitability, the author mentions:
“While industry differences matter, they are clearly not all that matters” (Schmalensee, 1985, p. 350).
interaction year x industry separating fixed and transient industry influences. The model was able to explain 63.33% of the variance. Industry membership explained 16.2% of total variance, but half of that was associated with transient effects through industry x year interaction, so permanent industry effects were only 8.3%. Firm effects, or persistent factors associated with each individual business unit accounted for 46.4% of total variance.
Although these two papers provided consistent findings, they have been used to support different views. Schmalensee´s (1985) work was used to support the strategic analysis based on industry structure (Montgomery and Porter, 1991) while Rumelt´s results were used to question this view since he found a large, significant influence of permanent factors associated with the business unit itself. This emphasized the importance of the resource-based approach (Roquebert, Phillips and Westfall, 1996).
Roquebert, Phillips and Westfall (1996) published a similar research using the COMPUSTAT database. The data covered the period of 1985 to 1991, using 16,596 observations. Findings were similar to the two previous studies with one notable exception, the corporate effect. They found a significant corporate effect explaining 17.9% of the total variance. The model was able to explain 68.0% of total variance leaving 32% unexplained.
In other broad economic sectors, like Mining and Agriculture, Retailing, Transport, Services, Lodging and Entertainment, variance composition was significantly different from Manufacturing and industry influence was much greater so that when the aggregate results were examined industry accounted for over 17% of the variance (McGahan and Porter, 1997).
A comparison of these studies, showing results for manufacturing data only, is presented in Table 1. Although there are discrepancies related to corporation effects there is remarkable coincidence in the other components of the variance given the differences in the data and method used. The largest component of variance has always been the individual business unit characteristics accounting from a third to half of the total variance. Industry is significant, but its influence is somewhere between 10 and 20% of the total variance, and part of that is due to interaction with year.
Location was not considered as a factor influencing performance variance.
Location and performance
Geography has been linked with firms’ economic performance since early days of economic thinking. Adam Smith (1776) introduced the idea of absolute advantage by which a region with a lower cost could dominate the market exporting to others. Ricardo (1817) further developed the subject with the notion of comparative advantage. International trade is based on the existence of inequalities in production factors among countries. Countries enjoying abundance of certain production factors can exploit a comparative advantage when producing goods that demand intense use of these factors. Countries where labor cost is low should have a comparative advantage in the production of good that require high labor intensity in the production process.
Kogut (1991) examined the notion of country competitiveness as countries do differ in their prevailing technological and organizational capabilities. These differences influence the performance of firms based in those countries and part of the observed heterogeneity in performance can be attributable to the effects of a firm’s country of origin. The persistence of these competitive differences among countries is a function of the relative permeability of country borders versus firms’ borders. The slower rate of diffusion of organizational capabilities in relation to technological capabilities is an additional reason for the persistence of these competitive differences.
Michael Porter (1990, 1994, 1998, 2000) developed a whole theory of competition based on clusters. Clusters affect competition in three broad ways: they increase the productivity of constituent firms or industries; they increase their capacity for innovation; and they stimulate new business formation that supports innovation and expands the cluster (Porter, 1998, p.213). The cluster approach offers thus a dynamic influence of location in competition as opposed to a static one associated with the basic economic analysis. Porter (1990) offered the “diamond” framework to analyze the determinants of a competitive advantage of a nation. The diamond consists of four interrelated sets of attributes linked to location: factor (input) conditions; demand conditions; related and supporting industries; and the context for firm strategy and rivalry.
The “country effect” proposed in this paper is related to country specific factors that affect all firms in a given country in a similar way. It captures most of the argument proposed by Kogut (1991), but only part of the influence of clusters as developed by Porter (1994). The influence of the actual cluster is not simple to capture since it involves some firms of a certain industry, not all of them. It also involves some firms of related industries and finally, the geographical definition may not coincide with national borders. Firms located in neighboring countries may be part of a cluster. Some of this “cluster” effect can be captured in the interaction between country and industry, but it must be recognized that this is not the definition of a cluster. The major benefit of the approach is that it looks at the variance as it occurs in the real world and estimates all the components simultaneously allowing the researcher to compare magnitudes and assess one in perspective of the others.
Method and data
Components of variance
The components of variance technique is widely used in other fields like genetics, but its application to business has been limited (Rumelt, 1991). It attempts to decompose the variance observed in a specific variable into the components (or variances) that represent the contribution of each random effect causing that final variance. Searle, Casella and McCulloch (1992) provide a comprehensive treatment of the technique. In the case in study, firm, industry sector, year and country are taken as random effects, each contributing to the total variance of the observable variable. The basic model, without considering possible interactions is:
Where ri,j,k,t is the performance measure of an individual company in the sample. The index t
represents the different years considered; i the different industry sectors; j the country where the firm is located; and k the individual firms. The term µ is the average result of all companies taken as one group. The term γt is the year effect, αi is the industry sector effect, βj
accounts for the country effect and, finally, φk is the individual contribution of the company k
to its results, or the firm effect. The error term εi,j,k,t is the residual, not explained by the
model. This simple model can be extended including the possible interactions of country, industry sector and year by adding another three terms accounting for country-industry, country-year and industry-year interactions.
The variance of the term ri,j,k,tis given by:
σr2=σγ2 + σα2 + σβ2 + σφ2 + σε2 (2)
These variances can be estimated by several methods. This paper uses MINQUE (Minimum Norm Quadratic Estimation) since it is recognized as unbiased and requires no iteration, reducing the computational power required.
Performance measurement
performance is being measured. Most of previous studies on performance variance composition used the ratio of accounting profit to total firm assets. Some authors, however, explored different financial measures of performance as Tobin’s q, economic profit, market value, hybrid measures and even surveys among managers reaching similar conclusions (Wernerfelt and Montgomery, 1988; Powell, 1996; McGahan, 1999; Hawawini, Subramanian and Verdin, 2003). Recognizing all these limitations, as a first approach to measure country effects, this research used return on assets as a measure of performance. The definition of ROA (Return on Assets) of the Compustat Global Database was used. It is calculated as the income before extraordinary items divided by the average of the most recent two years total assets.
Data
Data selection for this study started with four basic databases: industrial active, industrial research, financial active, and financial research. Only firms with revenues and total assets of more than USD 10 million, and with reported results in at least four of the five years considered (1997-2001), were included. In total, 12,592 firms met these criteria, providing 60,092 observations, covering 78 countries and 448 different four-digit SIC codes. The analysis was done grouping SIC codes by broad economic sector or divisions. Division A included Agriculture, Forestry and Fishing (SIC codes below 1000); division B was Mining (SIC codes 1000-1499); division C was Construction (SIC codes 1500-1799); division D, the largest one, was Manufacturing (SIC codes 2000-3999); division E covered Transportation, Communications, Electric, Gas and Sanitary Service (SIC codes 4000-4971); divisions F and G were analyzed together covering Wholesale trade and Retail Trade (SIC 5000-5999); division H was Finance, Insurance, and Real Estate (SIC 6000-6799); division I was Services (SIC 7000-8999).
Results and Discussion
characteristic, indicated by the high kurtosis coefficient of 176.14. Intuitively this distribution represents a situation where the shoulders of the normal curve have been shaved off and this material has been added to the peak and the tails (Spanos, 1999). Firms tend to group their results around the mean closer than one would expect in a normal distribution and, at the same time, show more frequent large deviations (positive and negative) from the mean than would be expected if the distribution were normal. Table 2 shows the descriptive results for each economic sector or division.
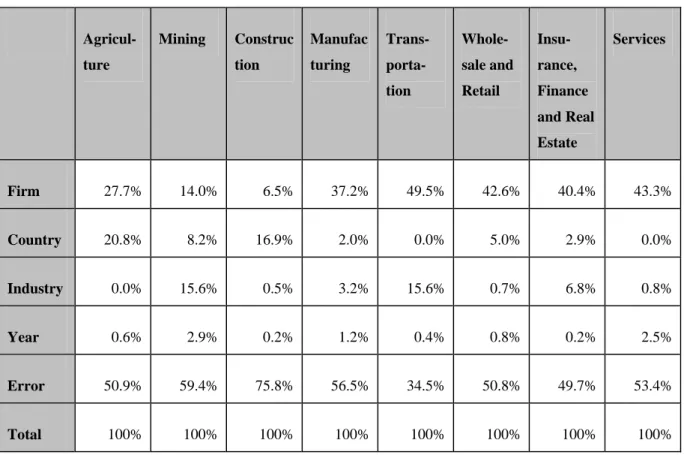
The analysis of variance components was done for each economic sector and results presented wide variations in variance composition as McGahan and Porter (1997) have found analyzing US data only. Table 3 shows the variance composition of each economic sector using a simple model where no interaction in the factors is accounted for.
In most cases, the simple model could explain 40 to 50% of the total variance, which is consistent with previous studies reviewed. Firm effects were the most important class of effects in most economic sectors with the exception of Construction and Mining where they were the second most influential factor. Industry effects ranged from nil to 15.6% in Mining. They were surprisingly low in most economic sectors when compared with previous studies. Year effects were always below 3% consistently with all previous studies. Country effects did appear and exhibited a non-systematic variation across the different economic sectors ranging from non-existent to 20.8% in Agriculture.
with Rumelt (1991) model cannot be properly made since he used a model including year x industry interaction, but figure was clearly smaller. Rumelt (1991) found a fixed industry effect of 8.32% and a transient one (the interaction with year) of 7.84%. Since the sample of this study included US and non-US firms, and the previous studies were done with US data only, one of the possibilities was that the variance composition outside the US would be very different. This was checked performing the analysis separately for US and non-US countries, but the results did not show any significant differences for the two sub-samples. Another possible explanation could be the different periods of sample collection and the occurrence of a change in the variance composition with time. McNamara, Vaaler and Devers (2003) presented an analysis showing the variance composition in 17 four-year windows from 1978 to 1997, using the Compustat US database. The industry effect showed a clear and steady pattern of reduction since its peak in 1983-1986 of 13.1% to 3.5% for the last time window analyzed, 1994-1997. Claver, Molina and Tari (2002), using a model similar to Rumelt (1991) applied it to Spanish firms during 1994-1998, found a fixed industry effect of 2.06% and a transient one of 2.78%.Under this perspective, the figure of 3.2% for the period 1998-2001 seems quite reasonable. Another aspect that could explain the lower percentage of industry effects is that the Compustat Global database assigns the whole company to its most representative SIC code while the US database company’s results are split by significant business lines and reported separately. This leads to a pooling of results that could reduce industry effects in diversified companies. Country effects were found to be 2.0% of total variance.
Still analyzing the results of the simple model in Table 3, country effects were largest in Agriculture and Construction economic sectors, accounting for 20.8% and 16.9% of total variance. They also reached 8.2% in Mining. This is not surprising since in all these economic sectors geography should have an important effect in production factors economies. Firm effects seem to be less important in Mining and Construction where they are not the leading factors in explaining the variance composition. McGahan and Porter (1997) grouped the results of all these three economic sector into one they called Agriculture, Mining. They found firm effects accounting for 5.02% of total variance, industry effects for 29.35% and corporate effects accounting for 22.35%. The model also found year effects of 2.35% and a negative covariance between corporation and industry of -9.45%. The model was able to explain 49.52% of total variance. Results are not directly comparable given the different grouping of data used. It is clear, however, that firm effects were less important.
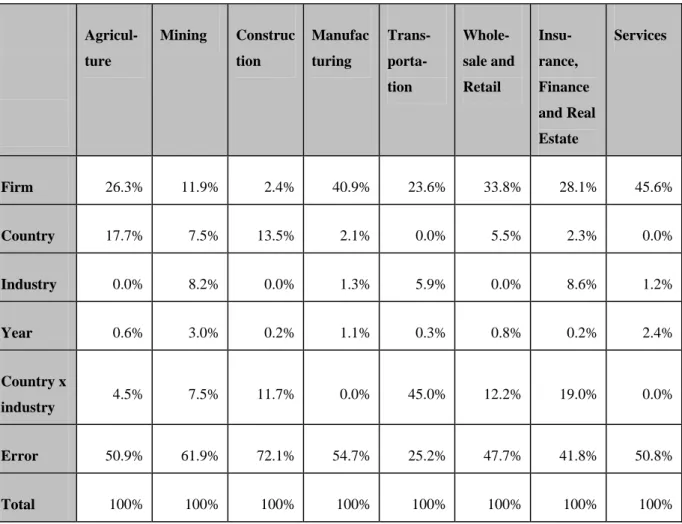
The model with interaction, shown in Table 4, identified relevant percentages of variance explainable through the interaction country x industry for these three economic sectors. This indicates effects of specific countries in specific industry sectors and could be taken as an imperfect indication of a kind of a “cluster effect”. In fact, the definition of a cluster is much stricter since it does not need to include all companies of a given industrial sector in a country, so the fact that part of the variance can be explained through this interaction is highly significant.
differences in sample and model, but the results indicate the need for future research in the area. When these economic sectors were analyzed with the model including the interaction country x industry, a surprisingly strong explanatory power due to this interaction could be seen. In Transportation the interaction accounted for 45.0% of total variance becoming the dominant effect since firm effects dropped to 23.6%.Similar, however less marked, impacts could be seen in Wholesale and Retail and Insurance, Finance and Real Estate. Performance in these economic sectors seems to be strongly linked to factors associated to country and industry, leaving less variance explainable by firm idiosyncratic factors than what happens in other economic sectors.
Finally, in the services sector, country effects did not show up in neither the simple nor the interaction models.
Conclusions
This research investigated the existence and the magnitude of a new class of factor in explaining firms’ performance using variance components analysis. Its main finding is that location does have a saying in explaining part of the observed variance of performance among firms in different economic and industry sectors, throughout the world. Country does matter when it comes to explaining the dispersion of performance. Although this has been indicated as an important factor in the economic literature (Krugman, 1994), explored in several case studies in the strategy literature (Porter, 1998, p. 197-287), linked to competition at theoretical level (Kogut, 1991; Porter, 1998, p. 309-346), this is the first broad statistical assessment of this influence covering 12,592 different firms in 78 different countries.
that country effects are not the main factor in explaining performance variance. Factors associated with the individual firm are still the most important source of explanation of performance dispersion. Country effects compete in the second rank of factors like industry membership. The variance composition varies by different economic sectors. Economic sectors were defined as broad groups of industries (four-digit SIC codes) with some sort of similarity like Mining, Agriculture, Manufacturing, and Retail. McGahan and Porter (1997) also highlighted the fact that the variance composition is significantly different among the different economic sectors. Country seems to matter most in economic sectors where production factors are logically more closely associated with geography like Agriculture, Mining and Construction. In Agriculture, country effects were able to explain 20.8% of total observed variance. In Construction, country effects were the most important identifiable factor with 16.9% of total variance surpassing firm effects. In Mining, country effects accounted for 8.2% of total variance while industry and firm effects were at 15.6% and 14.0% respectively. In Manufacturing, by far the largest economic sector considered, encompassing 223 industries, and where most of previous studies were made, country effects accounted for only 2.0% of total performance variance. Manufacturing seems to be dominated by firm effects that were able to explain 37.2% of total variance while industry accounted for 3.2% and year effects for 1.2% of total variance. In economic sectors where the activity is more closely related to service and intangibles (like Transportation, Wholesale and Retail, Finance and Services) country seems to matter less. Only in Wholesale and Retail, country accounted for 5.0% of total variance and in Finance for 2.9%, in the other economic sectors no effect related to country could be identified.
world, this variation in performance would be assigned to this interaction factor. Two aspects must be kept in mind when interpreting the results of this interaction and relating them to the cluster concept. The first relates to the extension of the phenomena. Finding a large percentage of variance assigned to the interaction means that the country combines with industry to give a unique effect extensively, it occurs, in this case, very frequently in the sample of 78 countries and 448 industries. If the interaction phenomenon occurs in just some specific cases, even if it may be very important when it happens, only a small percentage of variance will be explained through the factor. The second aspect relates to the definition of cluster. A cluster is not the interaction of industry and country. Not all firms of the same industry in a certain country need to be members of the cluster. The cluster can also cross borders and include firms of neighboring countries. In addition, the cluster concept includes several related industries. The interaction country and industry captures, thus, only part of the cluster concept. Any percentage of total variance attributable to it should be regarded as highly indicative of a type of “cluster effect”.
In manufacturing, where the country effect itself was found to be small, the interaction country x industry could not de detected by the model. In Agriculture, Mining and Construction the interaction was clearly noticeable ranging from 4.5% in Agriculture to 11.7% in Construction. If total country influence is considered, summing the percentages of country itself and country-industry interaction, quite significant proportions of total variance were found. In Agriculture, it reached 22.2%, close to firm effects with 26.3%. In Mining and Construction, it became the most important influence, explaining 15.0% and 25.2% of total variance respectively. This gives even more support to the statement that country does matter.
were left with 23.6%. The total explained variance, that was 49.2% with the simple model, jumped to 74.8% when the interaction effect was included. In Retail and Finance the interaction country x industry also showed up as relevant with 12.2% and 19.0% respectively.
Besides the identification and preliminary quantification of the country effect and its interaction with industry, this research also offered the opportunity to observe the performance variance composition outside the US in an extensive way since 78 countries were included. In general terms, the findings support the view that the variance of performance on a global basis is not radically different from what was found with US data. Firm effects dominate the explanation of performance variance. It was not possible to confirm, however, the strong industry influence in economic sectors outside Manufacturing as was found by McGahan and Porter (1997). Given the differences in sample and method, this highlights the need of extensive further research in the area to reconcile and generalize the findings.
as an indicator of performance has well-known limitations and other dimensions and measurements can be investigated. Despite the fact that some clear and relevant conclusions were drawn and can be of use in guiding and giving relevance to different streams of strategy research, there is clear opportunity for further study in the area.
Directions for Future Research
provide other important insights on how to deal with strategy making in different countries. The first generation of economists that targeted development economic processes created models of high mathematical complexity, aiming at structural transformations in the economy, starting from the involvement of the government as planning agent and as catalyst of a change process encompassing economic, social and institutional aspects. These early models focused the growth of actual the per capita income, taking into account that the population was growing and that in many of these countries inflationary phenomena were also persistent. The logical consequence of these models was that the capital accumulation was the first priority (Solow, 2000) and that the state was the key agent in the development process. However, a second generation of development economists focused on a new idea, that economic development depends essentially on individual productive agents that through their abilities, values and resources actively adapt to the local conditions to increase their personal wealth and the general productivity of the economic system (Sen, 1997). This perspective opens new possibilities of dialogue between economics and the strategic management, from a different perspective, investigating how human capital, resources competencies, entrepreneurship, institutions, development and prosperity are linked in a pluralistic national setting.
References
Brush, T. H.; Bromiley, P. and Hendrickx, M. (1999). ‘The relative influence of industry and corporation on business segment performance: an alternative estimate’, Strategic Management Journal, 20, pp. 519 – 547.
Carroll, G.R. (1993). ‘A sociological view on why firms differ’, Strategic Management Journal, 14, pp. 237 – 249.
Chakravarthy, B. S. (1986). ‘Measuring strategic performance’, Strategic Management Journal, 7, pp. 437-458.
Chang, S. and Singh, H. (2000). ‘Corporate and industry effects on business unit competitive position’, Strategic Management Journal, 21, pp.739 – 752.
Donaldson, T. and Preston, L. E. (1995). ‘The stakeholder theory of the corporation: concepts, evidence, and implications’, Academy of Management Review, 20 (1), pp. 65-91.
Hansen, G. S.and Wernerfelt, B. (1989). ‘Determinants of firm performance: The relative importance of economic and organizational factors’, Strategic Management Journal, 10, pp. 399 – 411.
Kaplan, R. S.and Norton, D. P. (1996). The balanced scorecard: translating strategy into action. Harvard Business School Press, Boston.
Kogut, B. (1991). ‘Country capabilities and the permeability of borders’, Strategic Management Journal, 12, pp. 33-47.
Krugman, P. (1994). ‘Location and competition: notes on economic geography’. In: Rumelt, R.; Schendel, D. E. and Teece, D. J. (1994). Fundamental issues in strategy – a research agenda. Harvard Business School Press.
Jensen, M. C. (2001). ‘Value maximization, stakeholder theory, and the corporate objective function’, European Financial Management, 7(3), pp. 297-317.
March, J.G.and Sutton, R.I. (1997). ‘Organizational performance as a dependent variable’,
Organization Science, 8(6), pp. 698 – 706.
Mauri, A. J.and Michaels, M. P. (1998). ‘Firm and industry effects within strategic management: An empirical examination’, Strategic Management Journal, 19, pp. 211 – 219.
McGahan, A. M. (1999). ‘The performance of US corporations: 1981 – 1994’, The Journal of Industrial Economics, XLVII(4), pp. 373 – 398.
McGahan, A. M. and Porter, M. E. (1997). ‘How much does industry matter, really?’,
Strategic Management Journal, 18, Summer Special Issue, pp. 15-30.
McGahan, A. M. and Porter, M. E. (1999). ‘The persistence of shocks to profitability’, The Review of Economics and Statistics, 81(1), pp. 143 – 153.
profitability?’, Management Science, 48, pp. 834-851.
McNamara, G.; Vaaler, P. M. and Devers, C. (2003). ‘Same as it ever was: the search for evidence of increasing hypercompetition’, Strategic Management Journal, 24, pp. 261-278.
Meier, G.and Stiglitz, J. (2001). Frontiers of Development Economics – The Future in Perspective. Oxford University Press-World Bank, Oxford.
Montgomery, C. A. and Porter, M. E. (1991). Strategy: seeking and securing competitive advantage. Harvard Business School Publishing, Boston.
Nelson, R.R. (1991). ‘Why do firms differ, and how does it matter?’, Strategic Management Journal, 12, pp. 61 – 74.
North, D. C. (1992). ‘Institutions and Economic Theory’, The American Economist 36(1), pp.3-6.
Porter, M. (2000). ‘Location, competition, and economic development: local cluster in a global economy’, Economic Development Quarterly, 14(1), pp. 15-34.
Porter, M. (1998). On competition. Harvard Business School Publishing, Boston.
Porter, M. (1990). The competitive advantage of nations. The Free Press, New York.
Porter, M. ‘The role of location on competition’, Journal of the Economics of Business,.1(1), pp. 35-39.
Powell, T. C. (1996). ‘How much does industry matter? An alternative empirical test’,
Ricardo, D. (1817). Principles of Political Economy and Taxation. Prometheus Books, Amherst NY, printed in 1996.
Roquebert, J. A., Phillips, R. L., and Westfall, P. A. (1996). ‘Markets vs. management: what drives profitability?’, Strategic Management Journal, 17, pp. 653-664.
Rumelt, R. P. (1991). ‘How much does industry matter?’, Strategic Management Journal, 12, pp. 167-185.
Schmalensee, R. (1985). ‘Do markets differ much?’, The American Economic Review, 75(3), pp. 341-351.
Searle, S.R., Casella, G. and McCulloch, C.E. (1992). Variance components. John Wiley and Sons Inc, New York.
Sen, A. K. (1997). Resources, Values and Development. Harvard University Press, Cambridge MA.
Simon, H. (1945). Administrative Behavior. Free Press, New York.
Smith, A. (1776). The Wealth of Nations. Penguin Books, London, reprinted in 2000.
Solow, R. M. (2000). Growth Theory - An Exposition. Oxford University Press, Oxford.
Spanos, A. (1999). Probability theory and statistical inference: econometric modeling with observational data. Cambridge University Press, Cambridge.
Table 1 - Comparative summary of previous studies on variance composition of performance
(manufacturing firms)
Schmalensee Rumelt Roquebert et al.
McGahan and
Porter, using
Rumelt model
McGahan and
Porter
Year n.a. 0% 0.5% 0.40% 2.34%
Industrial sector x year n.a. 7.84% 2.3% 4.44% n.a.
Industrial sector, fixed n.a. 8.32% 10.2% 7.20% 10.81%
Industrial sector, total 19.59% 16.16% 12.5% 11.64% 10.81%
Corporation n.a. 0.80% 17.9% 2.05% n.a.
Corporation - industry
covariance -0.62% 0% n.a. -1.42% -2.27%
Market share 0.62% n.a. n.a. n.a. n.a.
Business unit/segment n.a. 46.37% 37.1% 33.79% 35.45%
Model 19.59% 63.33% 68.0% 46.46% 46.33%
Unexplained variance,
error 80.41% 36.67% 32.0% 53.54% 53.67%
Source: McGahan and Porter, 1997; Roquebert, Phillips and Westfall, 1996; Rumelt, 1991; Schmalensee,
ROA
38. 8 26.
3 13
.8 1.
3 -1
1.3 -23.
8 -36.
3 -48.
8
ROA
F
req
ue
nc
y
20000
10000
0
Std. Dev = 13.72 Mean = 1.7 N = 60092.00
Table 2 - Descriptive analysis of the sample by economic sector
Economic
Sector
Obser-vations
Firms
Coun-tries
Industry
sectors
Mean
Vari-ance
Skew-ness
Kur-tosis
Agriculture,
Forestry and
Fishing
400 88 24 5 1.66 83.96 -2.07 8.26
Mining 1594 351 47 11 2.01 237.37 -2.57 15.25
Construction 2446 516 39 8 0.92 84.22 -2.56 102.17
Manufacturing 27928 5940 61 223 2.05 173.11 -9.157 263.98
Transportation 5368 1141 56 37 1.59 180.26 -10.14 203.63
Wholesale and
Retail 7493 1573 47 63 2.48 91.08 -3.27 30.65
Insurance,
Finance and
Real Estate
8128 1816 62 40 1.99 85.95 -3.53 97.89
Services 6735 1167 44 61 -0.6 509.26 -5.39 56.93
Total 60092 12592 78 448 1.71 188.18 -7.86 176.14
Table 3 - Variance composition, simple model
Agricul-ture
Mining Construc
tion
Manufac
turing
Trans-
porta-tion
Whole-sale and
Retail
Insu-rance,
Finance
and Real
Estate
Services
Firm 27.7% 14.0% 6.5% 37.2% 49.5% 42.6% 40.4% 43.3%
Country 20.8% 8.2% 16.9% 2.0% 0.0% 5.0% 2.9% 0.0%
Industry 0.0% 15.6% 0.5% 3.2% 15.6% 0.7% 6.8% 0.8%
Year 0.6% 2.9% 0.2% 1.2% 0.4% 0.8% 0.2% 2.5%
Error 50.9% 59.4% 75.8% 56.5% 34.5% 50.8% 49.7% 53.4%
Total 100% 100% 100% 100% 100% 100% 100% 100%
Table 4 - Variance composition - model with interaction country and industry
Agricul-ture
Mining Construc
tion
Manufac
turing
Trans-
porta-tion
Whole-sale and
Retail
Insu-rance,
Finance
and Real
Estate
Services
Firm 26.3% 11.9% 2.4% 40.9% 23.6% 33.8% 28.1% 45.6%
Country 17.7% 7.5% 13.5% 2.1% 0.0% 5.5% 2.3% 0.0%
Industry 0.0% 8.2% 0.0% 1.3% 5.9% 0.0% 8.6% 1.2%
Year 0.6% 3.0% 0.2% 1.1% 0.3% 0.8% 0.2% 2.4%
Country x
industry 4.5% 7.5% 11.7% 0.0% 45.0% 12.2% 19.0% 0.0%
Error 50.9% 61.9% 72.1% 54.7% 25.2% 47.7% 41.8% 50.8%
Total 100% 100% 100% 100% 100% 100% 100% 100%