Transfer RNAs Mediate the Rapid Adaptation
of
Escherichia coli
to Oxidative Stress
Jiayong Zhong1☯, Chuanle Xiao1,2☯, Wei Gu1☯, Gaofei Du1, Xuesong Sun1, Qing-Yu He1 *, Gong Zhang1*
1Key Laboratory of Functional Protein Research of Guangdong Higher Education Institutes, Institute of Life and Health Engineering, College of Life Science and Technology, Jinan University, Guangzhou, China,
2State Key Laboratory of Ophthalmology, Zhongshan Ophthalmic Center, Sun Yat-Sen University, Guangzhou, China
☯These authors contributed equally to this work.
*[email protected](QYH);[email protected](GZ)
Abstract
Translational systems can respond promptly to sudden environmental changes to provide rapid adaptations to environmental stress. Unlike the well-studied translational responses to oxidative stress in eukaryotic systems, little is known regarding how prokaryotes respond rapidly to oxidative stress in terms of translation. In this study, we measured protein synthe-sis from the entireEscherichia coliproteome and found that protein synthesis was severely
slowed down under oxidative stress. With unchanged translation initiation, this slowdown was caused by decreased translation elongation speed. We further confirmed by tRNA sequencing and qRT-PCR that this deceleration was caused by a global, enzymatic down-regulation of almost all tRNA species shortly after exposure to oxidative agents. Elevation in tRNA levels accelerated translation and protectedE.coliagainst oxidative stress caused by
hydrogen peroxide and the antibiotic ciprofloxacin. Our results showed that the global regu-lation of tRNAs mediates the rapid adjustment of theE.colitranslation system for prompt
adaptation to oxidative stress.
Author Summary
All organisms need to respond quickly to sudden environmental changes. Translational regulation can occur in response to environmental stresses within minutes, which is much faster than transcriptional regulation, and thus normally provides immediate adaptation. Eukaryotic cells can manipulate their tRNA molecules, mainly in a reversible manner, to suppress translation. Here, we showed for the first time that bacteria respond to oxidative stress by adjusting the translational system in a manner that differs from that of eukary-otes. The bacteria nonspecifically, irreversibly, and enzymatically degrade tRNAs to block protein synthesis. Interestingly, we showed that elevated tRNA concentrations lead to opposing effects by causing increased protein aggregation, which impairs fitness under normal conditions but facilitates adaptation under oxidative stress, including that caused by antibiotics. Our results provide a new understanding of the role of global adjustments
OPEN ACCESS
Citation:Zhong J, Xiao C, Gu W, Du G, Sun X, He Q-Y, et al. (2015) Transfer RNAs Mediate the Rapid Adaptation ofEscherichia colito Oxidative Stress. PLoS Genet 11(6): e1005302. doi:10.1371/journal. pgen.1005302
Editor:Michael Ibba, The Ohio State University, UNITED STATES
Received:December 12, 2014
Accepted:May 27, 2015
Published:June 19, 2015
Copyright:© 2015 Zhong et al. This is an open access article distributed under the terms of the
Creative Commons Attribution License, which permits unrestricted use, distribution, and reproduction in any medium, provided the original author and source are credited.
Data Availability Statement:All next-generation sequencing data are available from the GEO databasehttp://www.ncbi.nlm.nih.gov/bioproject/? term=GSE62995(accession number GSE62995).
to the entire translation system during stress adaptation in bacteria. This mechanism may also be involved in the development of antibiotic resistance in bacteria.
Introduction
Reactive oxygen species (ROS), such as hydrogen peroxide (H2O2), the hydroxyl radical (OH),
and superoxide (O2-), are mainly generated as byproducts of the respiratory chain or
introduced on exposure to a hazardous environment [1]. These ROSs can damage proteins and nucleic acids by oxidation, leading to cellular oxidative stress (reviewed in [1–3]). To
counteract oxidative stress, bacteria have evolved diverse systems, such as theOxyRsystem and
SoxRSsystems, to activate the transcription of a series of enzymes including superoxide dismutases (reviewed in [3]). However, the transcription of the stress-response genes requires 10 min to reach maximal production levels, and protein translation requires additional time for synthesis [4,5], which takes ~20–30 min to take effect in bacteria and 45 min in yeast (reviewed in [6]). Thus, cells need an alternative mechanism(s) to response to environmental stresses within minutes, i.e., at the translation level (reviewed in [7]).
Translational regulation under oxidative stress has been intensively studied in eukaryotic cells. Early studies suggested that translation is globally inhibited in 5 min inSaccharomyces cerevisiaecells [8]. This process is mediated by specific tRNA and rRNA cleavage [9,10]. The same phenomenon has also been observed in mammalian cell lines [11–13]. Cleavage of tRNAs leads to the formation of small RNA fragments that can repress translation initiation and can regulate cellular functions, such as proliferation [14,15]. However, recent studies have provided increasing evidence that a considerable fraction of genes is more actively translated under oxidative stress in eukaryotic cells. In fission yeast, 26 genes were translationally upregu-lated in 15 min, and 191 genes were translationally upreguupregu-lated in 60 min [5]. Results from a time-resolved transcriptome and proteome study inS.cerevisiaerevealed that>80% of
pro-teins diverged from their mRNA expression profiles, suggesting a widespread translational control mechanism involving both upregulation and downregulation. Approximately 25% of the proteins were upregulated with their mRNA expression levels nearly unchanged[16]. The tRNALeu(CAA)hypermodified at the wobble position increases the translation of TTG codons after H2O2exposure and thus enhanced the protein expression of TTG-enriched genes [17].
In contrast, little is known about translational regulation in response to oxidative stress in prokaryotes, although the available data have provided clues suggesting that this response dif-fers substantially from that of eukaryotes. For example, specific endoribonucleases such as coli-cin and PrrC specifically cleave tRNA into 2 fragments at anticodon loop in prokaryotes; however, this phenomenon is not as universal in prokaryotes as it is in eukaryotes, occurring only under specific conditions with a select few tRNAs such as tRNA-Arg(ICG) [18] and tRNA-Lys [19,20].
Recent“omics”reports investigating alterations in bacteria have been focused on steady-state conditions. The translational fidelity is slightly lowered due to increased tRNA mischarg-ing [21]. However, the mild effects of mischarging can be easily overcome by an adequate sup-ply of amino acids [21]. ModifiedEscherichia colistrains can adapt to their oxidative
cytoplasmic environments to yield growth rates similar to those of the wild-type [22]. Such “oxidative”E.colistrains have been used in industrial applications to produce recombinant proteins that contain disulfide bonds, showing its strong fitness (reviewed in [23]). The chaper-one system (e.g., DnaK, Tig, and GroEL) remains nearly constant or only marginally decreased under oxidative stress, indicating that oxidative stress does not lead to as much protein analysis, decision to publish, or preparation of the
manuscript.
unfolding or damage as the heat stress[24], which is in sharp contrast to the effects observed following heat shock [25,26]. Although it has been proposed that polynucleotide phosphorylase may globally degrade oxidized RNAs containing 8-oxo-G to protectE.colifrom oxidative dam-age [27], results from multiple transcriptome and proteome studies have shown that transcrip-tomes and proteomes are nearly unchanged by such activity. For example, only 6 differentially expressed proteins were found inE.coliwhen exposed to oxidative stress, only 2 of which are transcriptionally regulated in response to oxidative stress [24]. Similar results were found in
Bacillus subtilis[28]. Notably, ~200 differentially expressed mRNAs were detected inB.subtilis
under oxidative stress, but only 16 of the corresponding proteins showed differential expres-sion. Discrepancies between the numbers of differentially expressed genes and proteins suggest that a remarkable translational regulation process occurs in response to oxidative stress in pro-karyotes. However, a general translational response remains elusive.
The protein synthesis rate is a critical index for representing the translational efficiency, especially for a nearly steady-state proteome, and can be measured using stable isotope labeling by amino acids in cell culture mass spectrometry (SILAC-MS) [29–31]. Briefly, cells are trans-ferred into SILAC media containing amino acids (usually lysine or arginine) labeled with heavy isotopes, and the newly synthesized proteins are labeled with the heavy isotopes. The ratio of heavy to light peptides can be accurately measured by mass spectrometry (reviewed in [32]). Thus, the protein synthesis rate can be deduced by monitoring the production of heavy peptides in a time-course assay. This strategy works well for higher eukaryotic systems, but is not applicable in prokaryotes due to their complex metabolic pathways that convert labeled lysine or arginine residues to other amino acids, which deviates from the principle of metabolic labeling [33]. Metabolic labeling of all nitrogen atoms with15N can label entire proteins very effectively (>99%) [34], but creates complexm/zshifts due to the large number of nitrogen
atoms present in peptides, which severely challenges data interpretation. Therefore, poor identification is expected, and the turnover of only 40 proteins in the green algaOstreococcus tauricould be analyzed using this method [35]. To bypass this disadvantage, Maieret al. used 30 external isotope-labeled peptides as references and determined half-lives of 231 proteins in
Mycoplasma pneumoniae[26], which is a more effective approach than those used in previous studies, but is relatively complicated.
In this study, we improved upon our previously developed ProVerB algorithm [36] to iden-tify and quaniden-tify15N-metabolically labeled proteins in time-course assays using MS. Thus, we could measure protein synthesis inE.coliunder normal conditions and oxidative stress at the proteome-wide level. Surprisingly, we found that translation elongation nearly halted, minutes after the oxidant was applied. We detected no specific tRNA and rRNA degradation, but levels of full-length tRNAs were rapidly reduced. Interestingly, eleva-ted tRNA concentrations promoted the fitness ofE.coliunder oxidative stress, making it more resistant to oxidation-generating antibiotics. These results depict a unique tRNA-centric scheme of global translational responses during oxidative stress in prokaryotes, which is different from the regulatory mechanisms used in eukaryotes.
Results
Optimal condition of oxidative stress
To determine optimal conditions for inducing oxidative stress, we measured the growth of the
E.coliBL21 strain in M9 minimal medium with various concentrations of H2O2, ranging from
0.2 mM to 2 mM. Exposing cells to 0.5 mM H2O2resulted in marked transient growth arrest
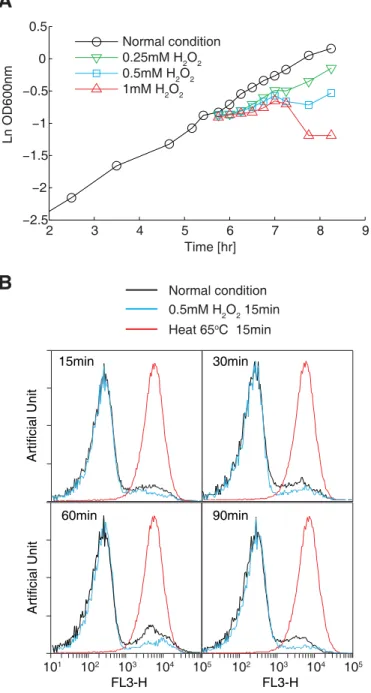
studies [37,38]. In parallel, we performed propidium iodide (PI) staining and flow cytometry to examine the degree of cell death caused by oxidative reagents. Treating cells with 0.5 mM H2O2resulted in a nearly identical profile of low-stained cells (representing live cells) under
normal conditions after at least 90 min following incubation with H2O2(Fig 1B). In contrast,
the cells killed at 65°C for 15 min showed a single peak with high PI staining. These results showed that treating cells with 0.5 mM H2O2does not cause detectable cell death.
Fig 1. Optimization of the oxidative stress conditions.(A) Cell growth in the presence of different concentrations of H2O2.E.coliBL21(DE3) cells were cultivated in M9 minimal medium. Cell growth in the
presence of 0.25–1 mM H2O2was monitored by measuring OD600values. (B) Cell viability assay using
propidium iodide staining and flow cytometry. Histograms showing cells exposed to 0.5 mM H2O2for 15, 30,
Proteome synthesis measured by
15N metabolic labeling
To study the translational response ofE.colicells under oxidative stress, we investigated pro-tein synthesis (amino acids incorporation) under normal and oxidative stress conditions. To achieve accurate quantification,15N metabolic labeling was used, as SILAC labeling is not applicable for bacterial studies [33]. However, it has been reported previously that15N
metabolic labeling can cause a significant decrease in growth rates and significant alterations in metabolite production in theE.coliBL21star strain. These findings indicate that the
metabolism is remarkably changed just because of the single extra neutron in heavy nitrogen atoms and that this method can thus introduce bias in analysis of protein synthesis [39]. To examine this effect in our system, we measured the growth curve of theE.coliBL21(DE3) strain in M9 minimal medium with14NH4Cl or15NH4Cl as the only nitrogen source.
Interestingly, we could not detect any significant differences in growth rates during log-phase growth using these two isotopes (P= 0.738, two-tailed Studentt-test;Fig 2A). This indicated that our15N metabolic-labeling protocol did not create any growth defects and that it can be used for analyzing protein synthesis.
To overcome the drawbacks of traditional MS identification and quantification algorithms in the context of15N metabolic labeling, we used our ProVerB algorithm [36], which is capable of handling complexm/zshifts caused by15N metabolic labeling, as described in the Materials and Methods section. Peptides were identified from spectra matches to our tandem MS/MS spectra. Two spectral matches are shown inS1 Fig. These spectra demonstrated the reliable identification of peptides, even when noise spectra peaks were present. The14N/15N ratios of peptides were determined based on the peak areas of the MS1 scans. Using a stringent criterion of the false discovery rate (FDR)<1% at the protein level, we quantified ~300–1000 proteins
from singleE.colisoluble protein samples (quantifications shown inS1 Table), which is markedly higher than results obtained using previous algorithms. This allowed us to assess the protein-synthesis rate ofE.colion a proteome-wide scale in high resolution for the first time.
We culturedE.coliBL21(DE3) cells until the optical density at 600 nm (OD600) reached 0.4
in14N M9 minimal medium and then quickly changed the medium to15N labeled minimal medium, with or without 0.5 mM H2O2. Next, we collected the cells at various time points and
analyzed their proteomes by MS (Fig 2B). We quantified the14N/15N ratios for each protein at each time point with our new algorithm. Without oxidative stress,15N-labeled proteins were continuously synthesized and replaced the14N proteins, resulting in a constant decrease of the
14N/15N ratio over time (Fig 2C, upper plot), indicating that the15N-labeled proteins gradually
substituted for their14N counterparts. This finding was confirmed by performing linear regression of the data points, which showed a very significant and negative slope (Pearson correlation coefficientr= -0.980,P= 3.59 × 10⁻⁶;Fig 2C, upper plot). In sharp contrast, the
14N/15N ratio of the proteome showed negligible differences over time under oxidative stress
(insignificant linear fit withP= 0.227;Fig 2C, lower plot).S2 Figshows the MS1 scans obtained for 2 peptides after 60 min growth under oxidative stress and normal conditions, as examples. Under normal condition, the quantity of the newly synthesized15N peptides exceeded their14N counterparts (S2A Fig). In contrast, under oxidative stress, the quantities of newly synthesized15N peptides were at least one order of magnitude lower than the
corresponding14N peptides (S2B Fig). These results indicate that protein synthesis is almost completely blocked under oxidative stress. We performed the same proteomic measurements in the wild-typeE.coliBW25113 strain and reproduced the same trend (Fig 2D).
Fig 2. Protein synthesis measurement under normal condition and oxidative stress using15N metabolic labeling and mass spectrometry.(A) Growth rate constant ofE.coliBL21(DE3) cells grown under normal conditions in M9 minimal medium containing14NH4Cl (14N) or15NH4Cl (15N). (B)
Experimental design for pulse labeling with15N under normal and oxidative stress conditions. (C) Bacterial cells were transferred to M9 medium containing 15N, after which the14N/15N ratio of theE.coliBL21(DE3) proteome was determined by mass spectrometry under normal conditions (upper plot) and
under oxidative stress was much lower than that observed under normal conditions. The 4 fits under normal conditions were all significant (P<0.05), while none of the fits under oxidative
stress were significant (P= ~0.237–0.457), indicating that we could not reliably detect the pro-tein synthesis rate of these propro-teins, i.e., the propro-tein synthesis was blocked. The linear fits (Eq 6) of most proteins yielded Pearson correlation coefficient (r)>0.6 in BL21(DE3) cells, and
approached 1 in the wild-type BW25113 strain, indicating a good linear fit. In sharp contrast, the Pearsonrvalues of most proteins were<0.2 in both strains (Fig 2F). Moreover, more than
half of the fits under normal conditions were statistically significant (P<0.05), while 95% of
the fits obtained under oxidative stress were insignificant (P>0.05), indicating that oxidative
stress caused an overall shutdown in proteome synthesis in both strains (Fig 2G).
We then calculated the half-lives for each protein usingEq 7. The average half-life of the proteome under normal conditions was 100.38 min, with>69% of the individual proteins
hav-ing a half-life<100 min (Fig 2H). In sharp contrast,>80% of the proteins showed a half-life
exceeding 500 min under oxidative stress, which significantly deviated from the half-life distri-butions under normal conditions (P= 3.9 × 10-149, Kolmogorov-Smirnov test;Fig 2H). Half-lives of>500 min could not be reliably detected (P>0.05) using the linear fit ofEq 6. The vast
majority of proteins were regenerated much more slowly under oxidative stress (Fig 2I). In sum, these data revealed that protein synthesis was inhibited or nearly abolished under conditions of oxidative stress.
Oxidative stress slows down translation elongation, but does not affect
translation initiation
To investigate whether inhibited protein synthesis occurs in the initiation or elongation phase, we measured polysome profiles inE.coligrown with and without oxidative stress. Cells under oxidative stress showed remarkably higher fractions of polysomes than observed under normal conditions, indicating that the translation initiation frequency may be unchanged, but that elongation was considerably decelerated (Fig 3A). This finding agreed with our previous data showing that an unchanged translation initiation and faster elongation speed results in a decrease in the polysome fraction [40].
To further validate this hypothesis, we performed cell-free translation of theE.coliprotein SufI expressed with a C-terminal His6-tag, in the presence or absence of 0.5 mM H2O2. The
reaction mixtures contained only the target gene and the necessary components required for translation, and no protease or ribonuclease was present. Therefore, the protein production rate is determined solely by translation initiation in this system. The SufI protein synthesized in the cell-free translation system was detected by western blot analysis, which showed that H2O2incubation did not inhibitin vitroprotein production (Fig 3B). This suggested that
trans-lation initiation is not hindered by oxidative reagents, i.e., the oxidative reagents used in this study did not cause significant oxidative damage to the proteins.
coefficient andP-value of the fit are indicated in green text. (D) The same experiment represented in (C) was repeated using the wild-typeE.coliBW25113
strain. (E) Examples showing changes in the14N/15N ratio of 4 randomly selected proteins (AtpA, GpmA, Eda, and PurA) in BL21(DE3) cells over time. The fit
was determined according toEq 6(Materials and Methodssection). The slope of the linear fit is the synthesis rate constant (ksyn). The black dots indicate the actual data points following protein quantification under normal condition, while the red dots indicate the data points measured under oxidative stress. Linear fits were determined for each dataset, and the Pearson correlation coefficients (r) are indicated in the diagram. (F) The Pearson correlation coefficients (r)
values of all proteins were fitted usingEq 6, under normal condition and oxidative stress. Data generated using the BL21(DE3) and wild-type BW25113 strains are shown. (G)Pvalues (in -log10scale) of linear fits of all proteins usingEq 6under normal and oxidative stress conditions. The green line denotes
the significance threshold (P= 0.05). The data generated using the BL21(DE3) and wild-type BW25113 strains are shown. (H) Histograms of protein half-lives under normal (blue) and oxidative stress (red) conditions. (I) Comparison of protein half-half-lives measured under normal and oxidative stress conditions. The grey line is at a 45° angle, which demarks the positions where the protein half-lives were unchanged. Half-lives longer than 500 min are shown as 500 min.
To test this postulation, we examined protein aggregation, as oxidative damage to proteins results in protein misfolding and aggregation in cells [41]. Under normal conditions, we observed a pattern of protein aggregation (Fig 3C) that was in agreement with results from a previous report [40]. Under the oxidative stress condition used in this study, we did not observe increased protein aggregation in eitherE.colistrain tested (Fig 3C). As a positive con-trol, we showed that heat stress at 47°C led to severe protein misfolding and aggregation. We also tested the molecular chaperones GroEL and DnaK, which serve as markers for heat shock and protein aggregation responses. The levels of these chaperones remained approximately equal under normal and oxidative stress conditions, but were remarkably elevated at a high temperature (Fig 4D). These results suggested that oxidative stress did not generate massive protein aggregation.
Given that the proteome was not damaged, we hypothesized that the inhibition of transla-tion elongatransla-tion may have been caused by the downregulatransla-tion of tRNA abundancesin vivo. Fig 3. Protein biogenesis under oxidative stress.(A) Polysome profiles under normal and oxidative stress conditions. (B) SufI synthesis in anin vitro
translation system, with or without oxidative stress. The SufI gene fused with a C-terminal His6-tag sequence constructed in a pET-28b plasmid (Novagen)
was used as a template in anin vitrotranslation reaction. The protein product was detected by western blotting with an anti-His6antibody. (C)
Detergent-insoluble proteins under normal (N) and oxidative stress (OS) conditions. Insoluble proteins extracted fromE.coliBL21(DE3) and wild-type BW25113 cells grown at 47°C for 10 min were used as positive controls (Heat). Soluble proteins (Sup) were loaded on the same gel as controls. (D) Western blot analysis of the molecular chaperones GroEL and DnaK inE.coliBL21(DE3) and wild-type BW25113 cells grown under normal (N) conditions, oxidative stress (OS) condition, or heat stress (heat) at 47°C for 30 min.
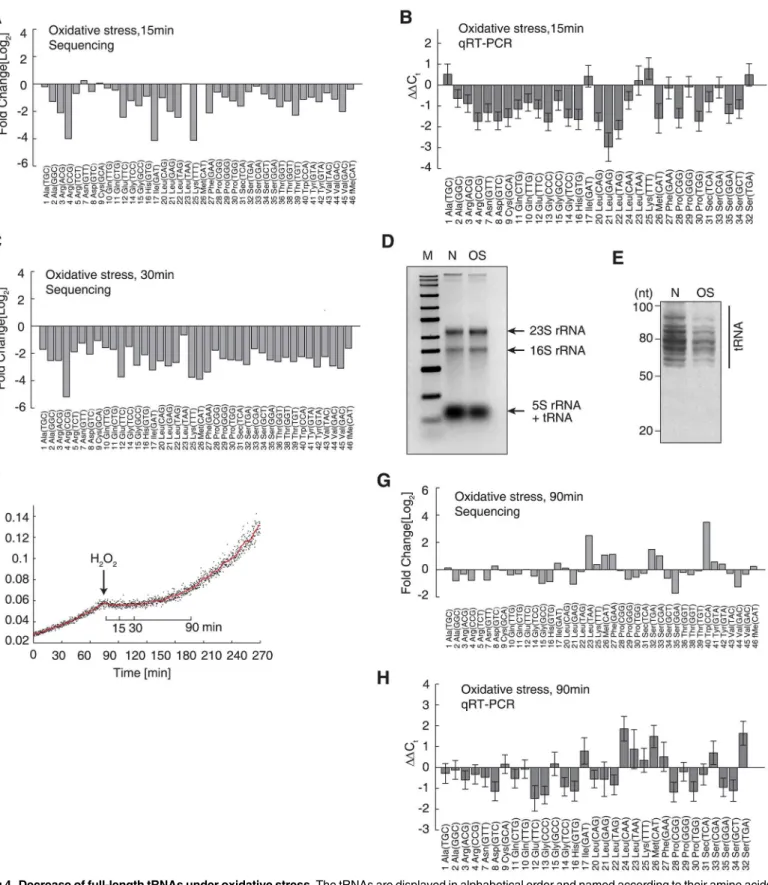
Fig 4. Decrease of full-length tRNAs under oxidative stress.The tRNAs are displayed in alphabetical order and named according to their amino acids and anticodons. (A) Decreased tRNA levels following 15 min of H2O2-induced oxidative stress, relative to tRNA levels observed under normal conditions.
Full-length tRNA levels are globally downregulated under oxidative
stress
in vivo
To studyin vivovariations in tRNA abundances upon oxidative stress, we quantitatively ana-lyzed the tRNA pool by next-generation sequencing and qRT-PCR. We added anin vitro tran-scribed single-stranded RNA as a spike-in RNA. This spike-in contained a 30-CCA tail like tRNA and deviates by least 3 nucleotides from anyE.colitRNA (S3 Fig). We obtained ~8–10 million sequencing reads for cells under normal and oxidative conditions. A total of 1.6~2.0 million reads were aligned to 47 tRNA species using a modified Smith–Waterman algorithm, which considered modified bases according to the Modomics database and allowed for a maxi-mum of 3 errors [42,43]. All 47 tRNA species were detected under both conditions with high reproducibility (R= 0.998, independent biological replicates;S4A Fig), except for 2 methionine tRNAs (S2 Table). The lack of detection of the 2 methionine tRNAs may have been due to the higher number of mismatches occurring in the sequencing reads. After normalization to the spike-in RNA, we detected a global downregulation of full-length tRNA (on average, a 2.47-fold decrease) 15 min after the application of oxidative stress (Fig 4A). This trend was in general validated by qRT-PCR performed using an independent biological replicate, with which 38 tRNA species were successfully and specifically amplified (Fig 4B). Notably, the qRT-PCR results obtained with independent biological replicates showed very high reproduc-ibility (R0.99;S4B Fig). These tRNA levels were further decreased after 30 min of oxidative stress (Fig 4C). With ribosomal RNA levels remaining constant under oxidative stress, the decrease in low molecular weight RNAs could be clearly seen (Fig 4D), indicating a decrease in tRNA levels. This global decrease in tRNA was then visually confirmed by polyacrylamide gel electrophoresis, which can resolve tRNAs into multiple bands (Fig 4E). To rule out possible technical artifacts, we collected the cells 90 min after the application of oxidative stress, during which time the cells adapted the new environment and cell growth was resumed (Fig 4F), implying that protein synthesis was restored. Both next-generation sequencing and qRT-PCR showed that tRNA production was restored to normal or even slightly higher levels (Fig4G and4H). To rule out a potential bias occurring during quantitative reverse-transcription reac-tions associated with the CCA-specific reverse-transcription method, we used a traditional method with random hexamers to prime the reverse-transcription reactions, which is not 3’ -CCA specific [44,45]. We could reproduce the global and significant downregulation of tRNAs 15 min after oxidative stress, which was reversed after 90 min (S5 Fig). To demonstrate that this trend was not strain-specific, we reproduced the effect of global tRNA downregulation after 15 min of oxidative stress (with reversal after 90 min) in the wild-typeE.coliBW25113 strain (S6 Fig). These results showed that the abundances of full-length tRNAs were indeed decreased under oxidative stress, and thus inhibited the translation elongation.
Enzymatic and nonspecific tRNA degradation decreases full-length
tRNA concentrations under oxidative stress
To determine how the full-length tRNAs were degraded, we first examined whether tRNAs were specifically cleaved into halves inE.coli, similar to the phenomenon observed in oxidative stress (OS). (E) Polyacrylamide gel electrophoresis of the sample represented in panel (D) to resolve the tRNAs. The size range of tRNAs is indicated. (F) Growth curves before and after the application of oxidative stress. The red line shows the moving average of the OD635observed over 5 min.
(G) The tRNA concentration after 90 min of oxidative stress, after which the bacteria had fully adapted to the stress and growth was resumed. (H) qRT-PCR validation of the results shown in panel (G), using an independent biological replicate. The data are shown as the mean±SD.
eukaryotes [9]. However, no bands or smears could be detected at ~30–40 nt in a polyacryl-amide gel, suggesting that specific tRNA degradation did not occur inE.coliunder oxidative stress (Fig 4E). The lack of smaller bands or smear below the tRNA bands also suggested that RNAs in general was not degraded.
We then investigated the non-full-length tRNA reads in the sequencing datasets. Three tRNAs, namely, 1-Ala(TGC), 7-Asn(GTT), and 12-Glu(TTC), possess tandem CCA sequences at their 30-end (i.e., CCACCA-30). Therefore, if the 30-CCA sequences were specifically cleaved,
the remaining sequence could be detected by our method. However, in contrast to eukaryotes, in which the 30-CCA tails can be reversibly cleaved to temporarily block translation [13], no
accumulation of 30-CCA cleavage intermediates was detected inE.colicells under oxidative stress. Reads that were ~1–10 nucleotides shorter than the full-length sequence were detected, and the versions without 30-CCA were not the most prevalent species for most tRNAs (Fig 5A). These results indicated that tRNA degradation under oxidative stress is nonspecific and irre-versible, which stands in contrast to the situation observed in eukaryotic cells.
The next open question was whether the observed nonspecific tRNA degradation relied upon cellular enzymes like RNases. To address this question, we added 0.5 mM H2O2in theE. colicell-freein vitrotranslation system with an RNase inhibitor and quantified 11 tRNAs by qRT-PCR. Compared to thein vitrotranslation results found without H2O2, none of the
tRNAs in the oxidative environment were degraded; their quantities remained unchanged (Fig 5Band5C). This conclusion was validated when qRT-PCR results were normalized according to the quantity of spike-in tRNA (without nucleotide modifications,Fig 5B) and 5S rRNA (with nucleotide modifications,Fig 5C), showing that the oxidation of the modified nucleotides did not affect the cDNA-based quantitation methods. Therefore, the nonspecific degradation observedin vivounder oxidative stress is dependent on cellular enzymes.
Elevated tRNA levels protects
E
.
coli
against oxidative stress
Translation elongation was remarkably inhibited due to nonspecific tRNA degradation. There-fore, we posited that excess tRNAs may rescue translation elongation under oxidative stress. To test this hypothesis, we elevated the levels of low-abundance tRNAs in the wild-typeE.coli
BW25113 strain and the BL21(DE3) strain by transforming them with the pRIL plasmid. This plasmid was isolated from theE.coliBL21(DE3)-CodonPlus RIL (BL21-RIL) strain, which car-ries extra copies of tRNAs that decode AGA, AGG, AUA, and CUA codons and, thus, can sig-nificantly accelerate translation elongation [40,45]. ControlE.colicells were transformed with the empty pBAD33 vector, which is chloramphenicol resistant like pRIL, to exclude any poten-tial influence caused by chloramphenicol selection [40]. The oxidative environment did not cause elevated cell death in BL21-RIL cells or control cells without tRNA supplementation (Fig 6A). The pRIL plasmid speed up the translation, resulting in augmented protein misfolding and aggregation [40], thus significantly impairing the fitness and growth rate, compared to control cells (P= 2.39 × 10⁻⁴, two-tailed Studentt-test;Fig 6B). In the wild-type BW25113 strain, tRNA supplementation also slightly decreased the growth rate, but this difference was not significant (P= 0.201, two-tailed Studentt-test;Fig 6B), perhaps because the wild-typeE.
colistrains expresses the OmpT and Lon proteases and can degrade the aggregated misfolded proteins more efficiently than the BL21 strain. In contrast, when oxidative stress was applied, both the wild-type BW25113 and the BL21 cells with augmented tRNAs grew significantly faster than the control cells (P =0.0154 and 1.96 × 10⁻³, respectively, two-tailed Studentt-test; Fig 6C), which supported our hypothesis.
~1–2 mM. In the presence of ~1–2 mM H2O2, the control BL21 cells died (Fig 6D), in
agree-ment with the results shown inFig 1A. In contrast, the tRNA-supplemented BL21-RIL cells continued to grow, although at a slower rate (Fig 6D). In the presence of 1 mM H2O2, the
BW25113 control cells died rapidly, while the tRNA-supplemented BW25113-RIL cells sur-vived (Fig 6D). These results showed that elevated tRNA concentrations alone could increase the resistance ofE.colicells to harsh oxidative stress.
To validate the phenomenon of tRNA-mediated resistance using another oxidative reagent, we incubatedE.colicells with ciprofloxacin, an antibiotic that induces extensive intracellular oxidative radical formation in prokaryotes [46,47], and examined whether increased tRNA concentrations improves the fitness ofE.coliin the presence of ciprofloxacin. We determined the minimal inhibitory concentration (MIC) of ciprofloxacin on controlE.coliBW25113 cells (carrying the pBAD33 plasmid) as 70 ng/ml. In the presence of low ciprofloxacin concentra-tions (<40 ng/ml), BW25113 cells carrying the pRIL plasmid grew slower under oxidative
stress than did the control cells (Fig 6E). The growth rate of the control cells decreased with the increasing antibiotic concentrations, while the BW25113-RIL cells grew faster under higher ciprofloxacin concentrations (Fig 6E). These results further validated our hypothesis that enhanced tRNA concentrations can help to maintain the translation elongation speed and thus increase resistance to oxidative stress.
Fig 5. Under oxidative stress, tRNAs are degradedin vivo, but not in the cell-freein vitrotranslation system.(A) Percentages of cleaved tRNA reads. X-axes indicate the number of bases cleaved from the 30-termini. The Y-axes denote the fraction of such tRNA reads among all tRNA reads relative to each
specific tRNA species. Three tRNAs are shown as examples. The observed distributions of the cleavage lengths were compared between normal (blue bars) and oxidative stress conditions (red bars). (B,C) The degradation of full-length tRNA inin vitrotranslation system. Eleven tRNAs were randomly selected and quantified by qRT-PCR. The difference observed between the oxidative stress and normal conditions are expressed in terms ofΔΔCTvalues, normalized
using spike-in RNA (B) or 5S rRNA (C). The data are shown as the mean±SD.
Fig 6. Higher tRNA concentrations improve adaptation under oxidative stress.(A) Cell viability testing results obtained using the PI staining method.E.coliBL21(DE3) cells carrying the empty vector pBAD33 and
the pRIL plasmid were tested. A histogram showing cells under 0.5 mM H2O2-induced oxidative stress for 15
Discussion
All organisms need to adapt environmental oxidative stress. The regulation of translational response is one of the fastest mechanisms whereby cells can guard against sudden environmen-tal stress factors before more specific, persistent mechanisms come into play, such as theOxyR
andSoxRSsystems. Although some previous studies have shown that the oxidation of certain aminoacyl-tRNA synthetases can affect the fidelity of translation (reviewed in [48]), a general translational response has remained elusive due to the nearly unchanged transcriptomes and translatomes observed under oxidative stress. Indeed, our results showed that no significant inhibition of protein synthesis could be detected in thein vitrotranslation system in the pres-ence of 0.5 mM H2O2. This finding suggests that the oxidation of translational machinery
com-ponents, such as initiation/elongation factors, tRNAs, ribosomes, and mRNAs, are not the direct causal factors in the immediate arrest of protein synthesisin vivoduring sudden oxida-tive stress, at least under the stress conditions employed in our study. Of note, this translational arrest was found for nearly all proteins examined, a phenomenon that cannot be caused by the stress translation machinery, which enhances the production of a small group of“leaderless” stress proteins (reviewed in [49]).
The main novelty of this study lays on our discovery of the direct causal factor leading to this rapid and global translation arrest: the enzymatic degradation of tRNA. Our results showed that bacteria respond differently from eukaryotes under oxidative stress in terms of tRNA manipulation. In eukaryotes, tRNAs can be retrotransported into the nucleus and cleaved into halves, or the 30-CCA tail can be reversibly digested. In contrast, bacteria degrade tRNAs rapidly, without the accumulation of residual tRNA fragments or CCA-lacking tRNAs. These findings indicated that bacteria have a simpler and more direct mechanism of tRNA manipulation than eukaryotes.
Technically, our modified ProVerB MS identification algorithm enabled the efficient identi-fication and quantiidenti-fication of peptides in the full15N metabolic-labeling experiments. We identified ~300–1000 proteins from singleE.colisoluble protein samples, which is at least one order of magnitude higher than previous studies. This improved algorithm provides a general tool for accurate and practical assessments of protein synthesis in prokaryotes and algae, a field, which has lagged far behind eukaryotic studies.
The reduction of tRNA levels under oxidative stress significantly slows down the translation elongation speed. This could be beneficial for prokaryotes because oxidative stress elevates the probability of protein misfolding, and the accumulation of misfolded proteins can be toxic [50,51]. This may be partially compensated by the deceleration of translation elongation, which coordinates protein synthesis and co-translational, domain-wise folding [45]. Further, oxidative stress increases the probability of amino-acid misincorporation (reviewed in [48]), and the slowdown of translation elongation effectively reduces the production rate of mis-syn-thesized proteins. In sum, tRNA degradation ensures the quality of protein production under oxidative stress, providing a prompt and basal persistence to the bacteria until more specific and effective adaptation mechanism begin to commence.
and BL21(DE3) carrying the pBAD33 and pRIL plasmids, under normal condition. The values shown are the mean±SD. (C) Growth rate constants ofE.coliBW25113 and BL21(DE3) carrying the pBAD33 and pRIL plasmids, under oxidative stress. The actual growth curves of BL21(DE3) carrying these two plasmids are shown respectively. The red line is the moving average observed over 5 min. (D) Cell growth-rate constant under harsh oxidative stress (~1–2 mM H2O2). A negative growth rate constant represents the occurrence of
Interestingly, tRNA supplementation has a dual impact on bacterial fitness. Under normal growth conditions, augmented tRNA levels globally accelerate translation elongation, thereby suppressing translational pausing. This leads to massive protein misfolding and thus impairs fitness [40]. However, under oxidative stress, the tRNA concentration is generally decreased, and the translation elongation is thus largely decelerated. Our results showed that the polysome fraction is remarkably increased under oxidative stress, indicating a much higher ribosome density and thus, an elevated probability of ribosome jamming. Yet, this slow elongation facili-tates co-translational folding and effectively rescues the fitness perturbation caused by tRNA augmentation. Higher tRNA concentration also protects cells by decreasing the probability of ribosome jamming that causes the pre-mature dissociation of RNAs from ribosomes [44]. Therefore, the elevated tRNA levels serves to protect against oxidative stress, resulting in enhanced cell growth under mild oxidative stress and survival under harsh oxidative stress.
A natural question is why cells do not increase their tRNA concentrations immediately after oxidative stress. This is unproductive because transcription and complex tRNA processing need a prolonged period of time [52,53]. Results from a previous study showed that the tRNA genes were transcriptionally regulated after 30 min inE.coliMG1655 cells under stimulus, while no tRNA changes could be detected after 10 min [54]. However, specific oxidation-coun-teracting systems, such as theOxyRandSoxRSsystems, can exert an effect ~20–30 min after oxidative stress, making tRNA upregulation shortly after oxidative stress less effective. In addi-tion, synthesizing proteins under oxidative stress may elevate the risk for producing oxidized proteins, thereby wasting valuable energy [1]. After cells adapt to oxidative stress, restoring tRNA levels (and thus protein synthesis) is beneficial for further growth. This is exactly what we observed after 90 min of oxidative stress, with many tRNAs reaching higher concentrations than observed under normal conditions (Fig 4,S5 FigandS6 Fig). In sum, it is an efficient strategy for bacteria to maintain tRNAs at low levels under normal growth conditions and degrade them shortly after encountering oxidative stress.
In addition, we showed that the protective effect of elevated tRNA concentrations also pro-tects bacteria against oxidative stress induced by the antibiotic ciprofloxacin. At a sub-MIC concentration of ciprofloxacin, tRNA-augmented bacteria grew significantly faster than control cells, thereby providing the bacteria with elevated tRNA concentrations a survival advantage in the presence of an antibiotic. Therefore, the global regulation of tRNAs may serve as a general mechanism of antibiotic resistance.
Another question of interest is why eukaryotes tend to reversibly manipulate tRNAs (including the retrotransport of tRNAs into the nucleus and the rapid and reversible cleavage of 30-CCA) under oxidative stress, while bacteria tend to simply degrade the tRNA irreversibly.
in yeast [62]). Collectively, these data indicate that regulation in eukaryotic cells involves a much higher energy cost and a much more complex system to produce tRNAsab initiothan do prokaryotic cells. Therefore, complex but reversible tRNA manipulation allows eukaryotes to save energy and resume translation elongation after full stress adaptation by avoiding syn-thesizing and processing tRNAsab initio. In contrast, prokaryotic cells can quickly produce tRNAs and thus tend to maintain a much simpler and irreversible degradation system.
In sum, we found that the global regulation of tRNA mediates rapid adaptation under oxi-dative stress. This general mechanism provides new insights into the translational responses of bacteria to stress conditions and may offer new views for understanding antibiotic resistance in bacteria.
Materials and Methods
Bacterial strains and plasmids
E.coliBL21(DE3) and wild-type BW25113 strains were used in this study. To increase the tRNA concentrations, bacteria were transformed with the pRIL plasmid that was isolated from theE.coliBL21(DE3)-CodonPlus-RIL strain (Stratagene). This plasmid confers chlorampheni-col resistance and encodes the tRNA genesargU,ileY, andleuWthat recognize AGA, AGG, AUA, and CUA codons. In this study, these three tRNAs were designated as 5-Arg(TCT), 17-Ile(GAT), and 22-Leu(TAG), respectively (Fig 4). We used the empty vector pBAD33, which also confers chloramphenicol resistance as a control for the pRIL plasmid.
Growth curve measurement
To accurately measure bacterial growth rates in batches, we assembled in house a fully auto-matic device to measure ODs. Bacteria were grown in rectangular, sterilized cuvettes, referred to here as“measuring units.”A narrow 635-nm laser beam was used as a light source, and the penetrating light was measured by a digital illuminometer connected to computer (S7A Fig). Optical densities were calculated according to the Beer-Lambert Law. Data were recorded auto-matically via the computer with a minimal interval of 10 s. During cell growth, measurements were continuously obtained without interfering with the shaker, which prevented temperature fluctuations caused by opening and closing the lid. Six such measuring units were fixed on a 30° slope and installed in an orbital shaker for culturing purposes (S7B Fig). No sedimentation ofE.colicells was noted after 12 h of culturing with shaking at 200 rpm.
We validated the measurements obtained with our in-house constructed device by compari-son with the Genesys 10S UV-Vis spectrophotometer (Thermo). Our device yielded compara-ble results compared to the Genesys 10S UV-Vis spectrophotometer between an OD range of ~0–0.45, with a correlation coefficient approaching 1 (S7C Fig).
For each growth curve measurement, theE.colicells were pre-cultured in LB medium at 37°C overnight and then collected by centrifugation, resuspended, and added in M9 minimal medium at a 1:1000 dilution, yielding an initial OD of<0.005. The measurements were
per-formed within the linear range of our device (OD = 0~0.45).
Cell viability assessments
Cell viabilities were determined via propidium iodide (PI) staining [63,64]. Briefly,E.colicells were harvested at OD = 0.05 by centrifugation and diluted in phosphate-buffered saline (PBS) to ~106cells/mL. A 100-μl suspension was supplemented with PI (Sigma) to a final
concentration of 10μg/mL and incubated for 30 min at 4°C. After centrifugation at 12,000 ×g
Flow cytometry was performed using a C6 flow cytometer (BD Accuri), using previously described settings [64].
Metabolic labeling with
15N
E.coliBL21(DE3) cells were cultivated in M9 minimal medium with 0.2% glucose at 37°C in an orbital shaker until the OD reached 0.6, and cells were harvested at room temperature by centri-fugation at 5000 ×gand washed twice with M9 minimal medium to remove any remaining
14NH
4Cl. The cells were then resuspended in an equal volume of15NH4Cl-containing M9
medium. To generate oxidative stress, H2O2(Sigma) was also added to a final concentration of
0.5 mM. Cells were further cultured, and samples were obtained at the indicated time points.
Mass spectrometry of proteins
Harvested cells were washed with PB) and resuspended in urea lysis buffer (8 M urea, 2 M thio-urea, 4% CHAPS, 15 mM DTT, and 1 mM PMSF). Cell lysates were sonicated in an ice bath for 5 min and centrifuged 15,000 ×gfor 15 min at 4°C to remove cell debris. In-gel digestion was performed, as described previously [65]. Briefly, 40μg of protein was resolved on a 12%
SDS-PAGE gel. The gel bands were cut into 4 slices and in-gel digestion was performed with MS-grade trypsin (Promega). MS was performed on an LTQ-Orbitrap mass spectrometer (Thermo Scientific), equipped with a nanospray source as described previously [66].
Protein identification and quantification
dta-format files were generated using BioWorks software, version 3.3.1 (Thermo-Finnigan, San Jose, CA) and searched against real and decoyE.colireference protein databases, using a modi-fied version of ProVerB software [36]. We modified the ProVerB program while considering the following terms: 1) the amino acid table contains 40 types of amino acids (2015N-labeled amino acids and 2014N (unlabeled) amino acids), 2) the theoretical peptide database contains
15N peptides and14N peptides, 3) candidate peptides for each spectrum were selected from the
theoreticalE.colipeptide database according to precursor ion mass, and 4) all candidates were assessed by determining ProVerB scoring functions. The following search criteria were employed: full tryptic specificity was required, 2 missed cleavages were allowed, and
carbamidomethylation was set as a fixed modification, whereas oxidation (M) was considered a variable modification. Precursor ion mass tolerances were set at 10 ppm for all MS spectra acquired in an LTQ-Orbitrap mass analyzer, and the fragment ion mass tolerance was 0.5 Da for all MS2spectra acquired. All top peptides from each spectrum were filtered using a FDR of 0.01, and the protein group was built as the set of all filtered peptides.
To quantify the14N/15N ratio for each protein, all filtered peptides and grouped proteins were converted to the dtaselect (version 1.9)-output format. The raw files from the
LTQ-Orbitrap instrument were converted to MS1 format using RawXtract software, version 1.93. Census software (version 1.7) was used to the calculate area ratio, defined as the ratio of the14N peptide peak area over the15N peptide peak area in a given chromatogram.
Protein synthesis and half-life calculations
After cells were transferred from14N medium to15N medium (time pointt0), the15N-labeled proteins began to be synthesized. The14N protein decay can be described as shown inEq 1
N14ðtÞ ¼N0e
kdegðt t0Þ ð1Þ
is the degradation rate constant. Given that the proteome is generally in steady state during exponential growth under normal and oxidative-stress conditions (see [24,28,67] and data in Fig 2Afrom this study), we haveN0=N14(t)+N15(t) andkdeg=ksyn, whereksynis the synthesis rate constant. Therefore,Eq 1can be reformulated as follows:
N14ðtÞ ¼ ½N14ðtÞ þN15ðtÞ e ksynðt t0Þ
Thus,
N14ðtÞ þN15ðtÞ
N14ðtÞ
¼eksynðt t0Þ ð2Þ
LetRbe the ratio between the14N and15N proteins:R¼N14ðtÞ
N15ðtÞ, which is the value measured
by MS.Eq 2can be then rewritten as follows:
1þ1 R¼e
ksynðt t0Þ ð3Þ
By letting
Y ¼ln 1þ1
R
ð4Þ
and substitute Y intoEq 3, we derive the equation:
Y ¼ksynðt t0Þ ð5Þ
Therefore,
dY
dt ¼ksyn ð6Þ
According toEq 6,ksyncan be fitted using the dataset ofYandt. Rapid protein synthesis is represented by a highksynvalue, which corresponds to a high slope fordY/dt.
The half-life time of the protein is then calculated as
T¼ln2
ksyn
ð7Þ
Cell-free expression
The S30 T7 High-Yield Cell-Free Protein Expression System (Promega) was used for cell-free expression tests under oxidative stress, according to the manufacturer’s recommended proto-col. TheE.coliSufI gene inserted into pET-28b plasmid with C-terminal His6tag was
expressed according to the manufacturer’s recommended protocol. The reactions were incu-bated for 20 min, stopped, and then assessed by western blot analysis.
Isolation of detergent-insoluble proteins
E.colicells were harvested at OD635nm= 0.05. The detergent-insoluble proteins (aggregated
proteins) were isolated as described in our previous report [40].
Polysome profiles
SW32Ti rotor (Beckman). Gradients were slowly pumped out and detected at 254 nm with a UV spectrophotometer.
Spike-in preparation and total RNA extraction
Spike-in RNA (50- CGAAAUUAAUACGACUCACUAUAGGGGAAUUGUGAGCG
GAUAACUGACUGACUGACUAAAUAAUUUUGUUUAACUUUAAGAAGGA
GAUAUACCA-30) was produced using the RiboMAX Large-Scale RNA Production
System-T7 (Promega) using a synthetic DNA template with a System-T7 promoter. The spike-in was purified using TRIzol (Ambion), according to the manual and quantified using a NanoDrop 2000 Spec-trophotometer (Thermo).
Cells were harvested by centrifugation 8000 ×gfor 15 min at 4°C and resuspended in 1 mL TRIzol (Ambion). Spike-in RNA was added to each sample at 500 ng/(OD•mL). RNA extrac-tion was then performed according to the product manual, with the modificaextrac-tion that the RNA was precipitated overnight in isopropanol at -20°C. The remaining DNA was removed by DNaseI treatment (Fermentas), according to the product manual.
qRT-PCR analysis of tRNAs
tRNA deacylation was performed as described previously [68], except that deacylation was per-formed at a pH of 10. A poly(A) tail was added to the deacylated 30-CCA terminus usingE.coli
poly(A) polymerase (New England BioLabs), according to the product manual. Prior to reverse transcription, polyadenylated tRNA were denatured for 5 min with a TG primer (50-T15GG-30;
100μM) and dNTPs (25 mM each) at 80°C and then chilled on ice. Reverse transcription was
performed with RevertAid Premium Reverse Transcriptase (Fermentas), according to the product manual.
Specific primers for amplifying 39E.colitRNAs were designed using Primer-Premier 5 soft-ware and are listed inS3 Table. The specificity of these primers was verified both byin silico
analysis (NCBI Primer-Blast) and melting-curve analysis after qPCR amplification. qPCR was then performed with each of the 39 tRNA-specific primer sets and SsoFast Evagreen Supermix (Bio-Rad) on a Bio-Rad MiniOpticon Real-Time PCR system (Bio-Rad), according to the man-ufacturer’s instructions.
Next-generation sequencing of tRNAs and data processing
After reverse transcribing tRNA to cDNA, second-strand synthesis was performed using RNase H, DNA Polymerase I, and T4 DNA Polymerase (Fermentas) according to the manufac-turer’s recommended procedure. The double-stranded cDNA was then purified using a HiPure PCR Kit (Magen). A sequencing library was constructed using the NEBNext Ultra DNA Library Prep Master Mix Set for Illumina (NEB). Next-generation sequencing was performed on an Illumina HiSeq-2000 sequencer for 100 cycles. High-quality reads passing the Illumina filter were kept for subsequent data analysis. The sequencing dataset was deposited in the Gene Expression Omnibus database under Accession Number GSE62995.
Supporting Information
S1 Fig. Identification of protein peptides.The representative MS2 spectra of FESEVYILSK of EF-Tu (A) and GGVIPGEYIPAVDK of EF-G (B) were identified by using modified ProVerB algorithm and shown with b and y ions indicated with cyan lines and red lines.
(TIF)
S2 Fig. Quantification of the14N/15N ratio of two peptides (FESEVYILSK and
GGVIPGEYIPAVDK) in normal condition and oxidative stress as examples.Samples were taken 60min after switching to15N M9 medium. Y-axes indicates the MS peaks intensity of the protein peptides. Signals of14N and15N protein peptides were indicated by blue and red lines. The relative abundance ratio of each14N and15N protein corresponds to the ratio of their peak area. Quantification of two protein peptides in normal condition (A) and under oxidative stress (B).
(TIF)
S3 Fig. Phylogenetic tree of spike-in RNA andE.colitRNA sequences, calculated using DNASTAR software.
(TIF)
S4 Fig. Reproducibility tests of three biological replicates ofE.colitRNA under normal con-dition using next-generation sequencing (A) and qRT-PCR (B).In all panels, the data were normalized using spike-in RNA. The read count ratio (A) is the tRNAs read count/spike-in RNA read count ration. Raw read counts were listed inS1B Table.ΔCT(B) indicates spike-in
RNA CT—tRNA CT. In all panels, the Pearson and Spearman correlation coefficients (rpand
rs) were indicated, respectively.
(TIF)
S5 Fig. tRNA quantification using random hexamer to prime reverse transcription.The tRNAs extracted 15min (left panel) and 90min (right panel) after oxidative stress were tested, respectively. Ct values were normalized using spike-in RNA. Data are shown in mean ± SD. (TIF)
S6 Fig. tRNA levels quantified using next-generation sequencing in wild-typeE.coli BW25113 strain, 15min and 90min after oxidative stress, respectively.Please refer toFig 4 for details.
(TIF)
S7 Fig. In-house made device to measure the bacterial growth curve continuously and auto-matically.(A) Design of one measuring unit of this device. (B) The device with 6 measuring units installed in a shaker. The Analogue-Digital Converters (ADCs) were placed outside of the shaker and connected to a computer to record data. When operating, the whole system was kept away from ambient light. (C) Comparison of the OD635nmmeasured by our in-house
made device and the Genesys 10S UV-Vis spectrophotometer. Pearson and Spearman correla-tion coefficients (rpandrs) were indicated in the diagrams, respectively.
(TIF)
S1 Table.14N/15N protein ratio of all identified proteins after the application of H2O2 under normal condition and oxidative stress, respectively.Data obtained inE.coliBL21 (DE3) and BW25113 strains are included.
S2 Table. The read counts of all tRNAs and spike-in RNA: (A) under normal condition and oxidative stresses (15min, 30min and 90min,E.coliBL21(DE3) and BW25113 strains); (B) three independent biological replicates of normal condition.
(XLSX)
S3 Table. Specific qPCR primers for 37E.colitRNAs. (DOCX)
Acknowledgments
We thank Xingfeng Yin and Yaxing Li (Jinan University) for their assistance in the MS analysis.
Author Contributions
Conceived and designed the experiments: GZ JZ WG. Performed the experiments: JZ WG GD. Analyzed the data: JZ CX WG GZ. Contributed reagents/materials/analysis tools: CX XS QYH. Wrote the paper: GZ XS QYH.
References
1. Cabiscol E, Tamarit J, Ros J (2000) Oxidative stress in bacteria and protein damage by reactive oxygen species. Int Microbiol 3: 3–8. PMID:10963327
2. Kryston TB, Georgiev AB, Pissis P, Georgakilas AG (2011) Role of oxidative stress and DNA damage in human carcinogenesis. Mutat Res 711: 193–201. doi:10.1016/j.mrfmmm.2010.12.016PMID: 21216256
3. Imlay JA (2013) The molecular mechanisms and physiological consequences of oxidative stress: les-sons from a model bacterium. Nat Rev Microbiol 11: 443–454. doi:10.1038/nrmicro3032PMID: 23712352
4. Jozefczuk S, Klie S, Catchpole G, Szymanski J, Cuadros-Inostroza A, et al. (2010) Metabolomic and transcriptomic stress response of Escherichia coli. Mol Syst Biol 6: 364. doi:10.1038/msb.2010.18
PMID:20461071
5. Lackner DH, Schmidt MW, Wu S, Wolf DA, Bahler J (2012) Regulation of transcriptome, translation, and proteome in response to environmental stress in fission yeast. Genome Biol 13: R25. doi:10.1186/ gb-2012-13-4-r25PMID:22512868
6. Davies KJ (1999) The broad spectrum of responses to oxidants in proliferating cells: a new paradigm for oxidative stress. IUBMB Life 48: 41–47. PMID:10791914
7. de Nadal E, Ammerer G, Posas F (2011) Controlling gene expression in response to stress. Nat Rev Genet 12: 833–845. doi:10.1038/nrg3055PMID:22048664
8. Shenton D, Smirnova JB, Selley JN, Carroll K, Hubbard SJ, et al. (2006) Global translational responses to oxidative stress impact upon multiple levels of protein synthesis. J Biol Chem 281: 29011–29021.
PMID:16849329
9. Thompson DM, Lu C, Green PJ, Parker R (2008) tRNA cleavage is a conserved response to oxidative stress in eukaryotes. RNA 14: 2095–2103. doi:10.1261/rna.1232808PMID:18719243
10. Yamasaki S, Ivanov P, Hu GF, Anderson P (2009) Angiogenin cleaves tRNA and promotes stress-induced translational repression. J Cell Biol 185: 35–42. doi:10.1083/jcb.200811106PMID:19332886 11. Fu H, Feng J, Liu Q, Sun F, Tie Y, et al. (2009) Stress induces tRNA cleavage by angiogenin in
mam-malian cells. FEBS Lett 583: 437–442. doi:10.1016/j.febslet.2008.12.043PMID:19114040 12. Saikia M, Krokowski D, Guan BJ, Ivanov P, Parisien M, et al. (2012) Genome-wide identification and
quantitative analysis of cleaved tRNA fragments induced by cellular stress. J Biol Chem 287: 42708–
42725. doi:10.1074/jbc.M112.371799PMID:23086926
13. Czech A, Wende S, Morl M, Pan T, Ignatova Z (2013) Reversible and rapid transfer-RNA deactivation as a mechanism of translational repression in stress. PLoS Genet 9: e1003767. doi:10.1371/journal. pgen.1003767PMID:24009533
15. Ivanov P, Emara MM, Villen J, Gygi SP, Anderson P (2011) Angiogenin-induced tRNA fragments inhibit translation initiation. Mol Cell 43: 613–623. doi:10.1016/j.molcel.2011.06.022PMID:21855800 16. Vogel C, Silva GM, Marcotte EM (2011) Protein expression regulation under oxidative stress. Mol Cell
Proteomics 10: M111 009217.
17. Chan CT, Pang YL, Deng W, Babu IR, Dyavaiah M, et al. (2012) Reprogramming of tRNA modifications controls the oxidative stress response by codon-biased translation of proteins. Nat Commun 3: 937. doi:10.1038/ncomms1938PMID:22760636
18. Tomita K, Ogawa T, Uozumi T, Watanabe K, Masaki H (2000) A cytotoxic ribonuclease which specifi-cally cleaves four isoaccepting arginine tRNAs at their anticodon loops. Proc Natl Acad Sci U S A 97: 8278–8283. PMID:10880568
19. Jiang Y, Meidler R, Amitsur M, Kaufmann G (2001) Specific interaction between anticodon nuclease and the tRNA(Lys) wobble base. J Mol Biol 305: 377–388. PMID:11152597
20. Meineke B, Shuman S (2012) Determinants of the cytotoxicity of PrrC anticodon nuclease and its ame-lioration by tRNA repair. RNA 18: 145–154. doi:10.1261/rna.030171.111PMID:22101242
21. Ling J, Soll D (2010) Severe oxidative stress induces protein mistranslation through impairment of an aminoacyl-tRNA synthetase editing site. Proc Natl Acad Sci U S A 107: 4028–4033. doi:10.1073/ pnas.1000315107PMID:20160114
22. Bessette PH, Aslund F, Beckwith J, Georgiou G (1999) Efficient folding of proteins with multiple disul-fide bonds in the Escherichia coli cytoplasm. Proc Natl Acad Sci U S A 96: 13703–13708. PMID: 10570136
23. Sorensen HP, Mortensen KK (2005) Advanced genetic strategies for recombinant protein expression in Escherichia coli. J Biotechnol 115: 113–128. PMID:15607230
24. Tang Y, Quail MA, Artymiuk PJ, Guest JR, Green J (2002) Escherichia coli aconitases and oxidative stress: post-transcriptional regulation of sodA expression. Microbiology 148: 1027–1037. PMID: 11932448
25. Luders S, Fallet C, Franco-Lara E (2009) Proteome analysis of the Escherichia coli heat shock response under steady-state conditions. Proteome Sci 7: 36. doi:10.1186/1477-5956-7-36PMID:
19772559
26. Maier T, Schmidt A, Guell M, Kuhner S, Gavin AC, et al. (2011) Quantification of mRNA and protein and integration with protein turnover in a bacterium. Mol Syst Biol 7: 511. doi:10.1038/msb.2011.38PMID:
21772259
27. Wu J, Jiang Z, Liu M, Gong X, Wu S, et al. (2009) Polynucleotide phosphorylase protects Escherichia coli against oxidative stress. Biochemistry 48: 2012–2020. doi:10.1021/bi801752pPMID:19219992 28. Mostertz J, Scharf C, Hecker M, Homuth G (2004) Transcriptome and proteome analysis of Bacillus
subtilis gene expression in response to superoxide and peroxide stress. Microbiology 150: 497–512.
PMID:14766928
29. Doherty MK, Hammond DE, Clague MJ, Gaskell SJ, Beynon RJ (2009) Turnover of the human prote-ome: determination of protein intracellular stability by dynamic SILAC. J Proteome Res 8: 104–112.
doi:10.1021/pr800641vPMID:18954100
30. Westman-Brinkmalm A, Abramsson A, Pannee J, Gang C, Gustavsson MK, et al. (2011) SILAC zebra-fish for quantitative analysis of protein turnover and tissue regeneration. J Proteomics 75: 425–434.
doi:10.1016/j.jprot.2011.08.008PMID:21890006
31. Cambridge SB, Gnad F, Nguyen C, Bermejo JL, Kruger M, et al. (2011) Systems-wide proteomic analy-sis in mammalian cells reveals conserved, functional protein turnover. J Proteome Res 10: 5275–
5284. doi:10.1021/pr101183kPMID:22050367
32. Mann M (2006) Functional and quantitative proteomics using SILAC. Nat Rev Mol Cell Biol 7: 952–
958. PMID:17139335
33. Hinkson IV, Elias JE (2011) The dynamic state of protein turnover: It's about time. Trends Cell Biol 21: 293–303. doi:10.1016/j.tcb.2011.02.002PMID:21474317
34. Snijders AP, de Koning B, Wright PC (2005) Perturbation and interpretation of nitrogen isotope distribu-tion patterns in proteomics. J Proteome Res 4: 2185–2191. PMID:16335965
35. Martin SF, Munagapati VS, Salvo-Chirnside E, Kerr LE, Le Bihan T (2012) Proteome turnover in the green alga Ostreococcus tauri by time course 15N metabolic labeling mass spectrometry. J Proteome Res 11: 476–486. doi:10.1021/pr2009302PMID:22077659
37. Imlay JA, Linn S (1986) Bimodal pattern of killing of DNA-repair-defective or anoxically grown Escheri-chia coli by hydrogen peroxide. J Bacteriol 166: 519–527. PMID:3516975
38. Imlay JA, Linn S (1987) Mutagenesis and stress responses induced in Escherichia coli by hydrogen peroxide. J Bacteriol 169: 2967–2976. PMID:3298208
39. Filiou MD, Varadarajulu J, Teplytska L, Reckow S, Maccarrone G, et al. (2012) The 15N isotope effect in Escherichia coli: a neutron can make the difference. Proteomics 12: 3121–3128. doi:10.1002/pmic. 201200209PMID:22887715
40. Fedyunin I, Lehnhardt L, Bohmer N, Kaufmann P, Zhang G, et al. (2012) tRNA concentration fine tunes protein solubility. FEBS Lett 586: 3336–3340. doi:10.1016/j.febslet.2012.07.012PMID:22819830 41. Tamarit J, Cabiscol E, Ros J (1998) Identification of the major oxidatively damaged proteins in
Escheri-chia coli cells exposed to oxidative stress. J Biol Chem 273: 3027–3032. PMID:9446617
42. Machnicka MA, Milanowska K, Osman Oglou O, Purta E, Kurkowska M, et al. (2013) MODOMICS: a database of RNA modification pathways–2013 update. Nucleic Acids Res 41: D262–267. doi:10. 1093/nar/gks1007PMID:23118484
43. Puri P, Wetzel C, Saffert P, Gaston KW, Russell SP, et al. (2014) Systematic identification of tRNAome and its dynamics in Lactococcus lactis. Mol Microbiol.
44. Zhang G, Fedyunin I, Miekley O, Valleriani A, Moura A, et al. (2010) Global and local depletion of ter-nary complex limits translational elongation. Nucleic Acids Res 38: 4778–4787. doi:10.1093/nar/ gkq196PMID:20360046
45. Zhang G, Hubalewska M, Ignatova Z (2009) Transient ribosomal attenuation coordinates protein syn-thesis and co-translational folding. Nat Struct Mol Biol 16: 274–280. doi:10.1038/nsmb.1554PMID: 19198590
46. Goswami M, Mangoli SH, Jawali N (2006) Involvement of reactive oxygen species in the action of cipro-floxacin against Escherichia coli. Antimicrob Agents Chemother 50: 949–954. PMID:16495256 47. Dwyer DJ, Kohanski MA, Hayete B, Collins JJ (2007) Gyrase inhibitors induce an oxidative damage
cel-lular death pathway in Escherichia coli. Mol Syst Biol 3: 91. PMID:17353933
48. Katz A, Orellana O (2012) Protein Synthesis and the Stress Response. In: Biyani M, editor. Cell-Free Protein Synthesis: InTech. pp. 111–134.
49. Moll I, Engelberg-Kulka H (2012) Selective translation during stress in Escherichia coli. Trends Bio-chem Sci 37: 493–498. doi:10.1016/j.tibs.2012.07.007PMID:22939840
50. Nakamura T, Cho DH, Lipton SA (2012) Redox regulation of protein misfolding, mitochondrial dysfunc-tion, synaptic damage, and cell death in neurodegenerative diseases. Exp Neurol 238: 12–21. doi:10. 1016/j.expneurol.2012.06.032PMID:22771760
51. Bhattacharya A, Wei R, Hamilton RT, Chaudhuri AR (2014) Neuronal cells but not muscle cells are resistant to oxidative stress mediated protein misfolding and cell death: role of molecular chaperones. Biochem Biophys Res Commun 446: 1250–1254. doi:10.1016/j.bbrc.2014.03.097PMID:24685484 52. Collins LJ, Biggs PJ (2011) RNA networks in prokaryotes II: tRNA processing and small RNAs. Adv
Exp Med Biol 722: 221–230. doi:10.1007/978-1-4614-0332-6_14PMID:21915792
53. Deutscher MP (1984) Processing of tRNA in prokaryotes and eukaryotes. CRC Crit Rev Biochem 17: 45–71. PMID:6094100
54. Durfee T, Hansen AM, Zhi H, Blattner FR, Jin DJ (2008) Transcription profiling of the stringent response in Escherichia coli. J Bacteriol 190: 1084–1096. PMID:18039766
55. Lowe TM, Eddy SR (1997) tRNAscan-SE: a program for improved detection of transfer RNA genes in genomic sequence. Nucleic Acids Res 25: 955–964. PMID:9023104
56. Chan PP, Lowe TM (2009) GtRNAdb: a database of transfer RNA genes detected in genomic sequence. Nucleic Acids Res 37: D93–97. doi:10.1093/nar/gkn787PMID:18984615
57. Zhang G, Lukoszek R, Mueller-Roeber B, Ignatova Z (2011) Different sequence signatures in the upstream regions of plant and animal tRNA genes shape distinct modes of regulation. Nucleic Acids Res 39: 3331–3339. doi:10.1093/nar/gkq1257PMID:21138970
58. Phizicky EM, Hopper AK (2010) tRNA biology charges to the front. Genes Dev 24: 1832–1860. doi:10. 1101/gad.1956510PMID:20810645
59. Chen P, Jager G, Zheng B (2010) Transfer RNA modifications and genes for modifying enzymes in Ara-bidopsis thaliana. BMC Plant Biol 10: 201. doi:10.1186/1471-2229-10-201PMID:20836892
60. Hopper AK, Phizicky EM (2003) tRNA transfers to the limelight. Genes Dev 17: 162–180. PMID: 12533506
61. Sneppen K, Dodd IB, Shearwin KE, Palmer AC, Schubert RA, et al. (2005) A mathematical model for transcriptional interference by RNA polymerase traffic in Escherichia coli. J Mol Biol 346: 399–409.
62. Perez-Ortin JE, Alepuz PM, Moreno J (2007) Genomics and gene transcription kinetics in yeast. Trends Genet 23: 250–257. PMID:17379352
63. Jepras RI, Carter J, Pearson SC, Paul FE, Wilkinson MJ (1995) Development of a robust flow cyto-metric assay for determining numbers of viable bacteria. Appl Environ Microbiol 61: 2696–2701. PMID: 16535078
64. Rault A, Beal C, Ghorbal S, Ogier JC, Bouix M (2007) Multiparametric flow cytometry allows rapid assessment and comparison of lactic acid bacteria viability after freezing and during frozen storage. Cryobiology 55: 35–43. PMID:17577587
65. Shevchenko A, Tomas H, Havlis J, Olsen JV, Mann M (2006) In-gel digestion for mass spectrometric characterization of proteins and proteomes. Nat Protoc 1: 2856–2860. PMID:17406544
66. Sun X, Jia HL, Xiao CL, Yin XF, Yang XY, et al. (2011) Bacterial proteome of streptococcus pneumo-niae through multidimensional separations coupled with LC-MS/MS. OMICS 15: 477–482. doi:10. 1089/omi.2010.0113PMID:21699404
67. Bore E, Hebraud M, Chafsey I, Chambon C, Skjaeret C, et al. (2007) Adapted tolerance to benzalko-nium chloride in Escherichia coli K-12 studied by transcriptome and proteome analyses. Microbiology 153: 935–946. PMID:17379704