PANOECONOMICUS, , Vol. , Issue , pp.
-Re eived: May ; A epted: Nove er . DOI: . UDC /PAN. : .A Origi al s ie tifi paper
Bernur Acikgoz
Corresponding author School of Applied Sciences, Celal Bayar University, Turkey
Anthony Amoah
University of East Anglia, UK;
Central University College, Ghana
Mine Yılmazer
School of Applied Sciences, Celal Bayar University, Turkey
Acknowledgements: The authors are grateful to Prof. P. G. Moffatt, David Cutting and Shiona Brereton all of UEA for their comments on an earlier draft of this paper. We are also grateful to the two anonymous referees as well as the editorial team for their insightful critiques. Errors remain the sole responsibility of the authors.
Economic Freedom and Growth:
A Panel Cointegration Approach
Summary: This study uses three-country group panel data from 1993 to 2011 in examining the long-run effect of tax burdens (fiscal freedom index) and gov-ernment regulations of business (business freedom index) on economic growth. The outcome of the panel cointegration approach suggests that the variables have a long-run relationship with economic growth. The study finds all the signs of the variables used to be consistent with theoretical expectations. Regarding the variables of interest, it is also found that the fiscal freedom has a positive and significant effect on economic growth for all three-country groups. In addition, the business freedom has a positive and significant effect for only two-country groups. The study finds that tax burdens and government regula-tions play an important role on economic growth for most countries in the sam-ple. To harness economic growth prospects, the study offers recommendations for policy makers to consider.
Key words:Business freedom, Fiscal freedom, Tax burden, Economic growth, Panel cointegration.
JEL: E02, E44, F41, H10, P12.
A sustained increase in Gross Domestic Product (GDP) per capita is an indication of
a rise in standard of living. As a result, economic growth has taken a center stage in development discourse. These discussions are normally associated with either free market or state intervention debates. These debates have existed for several decades in the development economics literature, albeit with no conclusive outcome. “Mar-kets versus the State has long been one of the central themes of the development economics discourse. Broadly speaking, development strategies lie on a continuum, with more regulation of economic activity, less integration into the world economy, greater role for public provision of social services, more redistribution etc., at one end, and the opposite at the other end. A policy package, or development strategy, will reveal its orientation by where it lands on this stretch between statist and market-oriented approaches. Those who come down on the more statist end stress ‘market failure’, while those who come down on the market end stress ‘government failure’ ” (Shantayanan Devarajan and Ravi Kanbur 2013, p. 1).
542 Bernur Acikgoz, Anthony Amoah and Mine Yılmazer
is used to determine the extent to which members of a society are involved in eco-nomic direction and actions. In broader sense, a higher Ecoeco-nomic Freedom Index suggests more economic direction and action by members of the society. For exam-ple, fiscal freedom and/or business freedom decisions can influence economic direc-tion and acdirec-tion that can ultimately affect economic growth, all else held constant.
According to Claudia R. Williamson and Rachel L. Mathers (2011) several empirical studies have found a positive relation between economic freedom and growth. Such evidences can be found in Marta Bengoa and Blanca Sanchez-Robles (2003); Martin Paldam, Allan Würtz, and Tue Gorgens (2003); Jakop de Haan, Su-sanna Lundström, and Jan-Egbert Sturm (2006). Some of these studies have used either one or two indicators of economic freedom in their analysis. Following exist-ing studies, we use two indicators to evaluate economic freedom’s long-run impact on Gross Domestic Product per capita (a proxy for economic growth). A robustness
check is also recommended by Fredrik Carlsson and Lundström (2001) for studies of this nature due to the sensitivity and fragility of model specification issues.
The contribution of this paper is primarily to apply Dynamic Ordinary Least Squares (DOLS) and Fully Modifies Ordinary Least Squares (FMOLS) to this da-taset and evaluate the effect of two economic freedom indicators (fiscal and business) on economic growth. The core of our claim is, ceteris paribus, more economic
free-dom is associated with higher levels of economic growth. Thus, we investigate how fiscal freedom (tax burdens) and business freedom (government regulations of busi-ness) affect economic growth. The paper is organized as follows: Section 1 outlines the theoretical framework, Section 2 submits our data definitions, Section 3 pre-sents the methodology, Section 4 discusses empirical results, and Section 5 prepre-sents the conclusion and policy suggestions.
1. The Theoretical Framework
1.1 Economic Growth Approaches
In development economics literature, several growth models are discussed and used for empirical estimations. This section discusses the literature on growth theory de-velopments up until recent literature. The issue of economic growth has attracted increasing attention and has rigorously been discussed in literature during the past six decades. There are numerous theories that discuss the role of various factors in de-termining economic growth. Oded Galor (2005) has presented the unified growth theory, which seeks to reveal the underlying micro foundations that are consistent with the growth process over the entire history of the human species. It still stands however, that there is no single standardized unique theory on economic growth yet. Generally, two main aspects of economic growth theories can be distinguished. First, the neoclassical theory developed in the 50s by Robert M. Solow (1956) and Trevor W. Swan (1956). Secondly, the endogenous growth developed by Paul M. Romer (1993) and Robert E. Lucas (1988) in the 80s. Each growth theory places emphasis on a set of different factors as the main determinants of economic growth.
con-543 Economic Freedom and Growth: A Panel Cointegration Approach
stant returns to scale, diminishing marginal productivity of capital, exogenously de-termined technical progress and substitutability between capital and labor. It is gener-ally acknowledged in literature that the neoclassical economists rejected the implicit assumption that allocative inefficiency due to market imperfections would always be larger than the inefficiency from government failures. Some economists have also argued against the neoclassical approach stressing that government intervention plays a vital role in the process of economic growth.
On the other hand, the new growth theories have passed beyond the limita-tions of the neoclassical approach. Galor and David N. Weil (2000), and additionally Galor (2005) have highlighted the views of Paul Romer and Robert Lucas as posited in their seminal studies on endogenous growth. They argue that Romer’s model was based on technological progress driven endogenously by either the role of research and development investments or knowledge spillover that includes research and de-velopment externalities and learning by doing. Lucas’ model was based on human capital accumulation. Here, human capital and innovation capacity plays a vital role in fostering economic growth (Panagiotis Artelaris, Paschalis Arvanitidis, and George Petrakos 2006; Klaus Prettner 2012).
Paul Romer and Robert Lucas’ work activated research on the way technolog-ical spillovers affect economic growth. Three main factors that can be identified as the main sources of economic growth include new knowledge, public infrastructure and innovation (Petrakos, Arvanitidis, and Sotiris Pavleas 2007).
1.2 Government and Economic Growth
544 Bernur Acikgoz, Anthony Amoah and Mine Yılmazer
capital formation and productive activities has positive and significant effects on economic growth in transitional economies and developing countries.
On the other hand, John F. Cogan et al. (2010) stated that government out-lays necessarily compete with private agents and interfere with natural market pro-cesses and prices by over-stimulating demand, potentially diverting resources through a “crowding-out” effect. Cogan and Taylor (2011); Hyunseung Oh and Ri-cardo Reis (2011) found that expanding government expenditures barely promote economic growth, and instead may cause damage to an economy, because of the crowding-out effect or the increase in taxes. Similar results were found by Sheng-Tung Chen and Chien-Chiang Lee (2005) when they adopted the non-linear ap-proach (Armey Curve). Similarly, Diego Romero-Ávila and Rolf Strauch (2008); António Afonso and Davide Furceri (2010); Andreas Bergh and Martin Karlsson (2010) discussed how government consumption and direct or indirect taxation has distortionary taxation effects on private capital, and hence economic growth, although public investment has a positive effect in developed countries. Atrayee Ghosh Roy (2012) expressed that government consumption reduces economic growth while government investments enhance growth. Small government size sup-ports private investment and increases growth through public goods. However, ex-cessively expanding government size puts pressure on taxe revenues and leads to crowding-out effect with negative consequences on economic growth.
545 Economic Freedom and Growth: A Panel Cointegration Approach
1.3 Government, Economic Freedom and Growth
This section discusses the literature that relates economic freedom as an indicator to determine the extent of government’s influence on businesses and its impact on eco-nomic growth. Recently, indicators of institutional systems have been used as fun-damental determinants of economic growth. For example, the effect of corruption, public bureaucracy, legal system, civil and political rights, democracy and economic freedom on economic growth has been analyzed in numerous researches. The Eco-nomic Freedom Index has been commonly used as an explanatory variable in the endogenous growth model. The basic definition of economic freedom is freedom of business entry, i.e. freedom to start a business, as well as freedom of business exit, i.e. freedom to close your business (Veselin Vukotić 2008). There have been three different definitions and measurements of economic freedom using different varia-bles. There are three different indices of economic freedom reported by three institu-tions, namely: The Heritage Foundation (THF), Fraser Institute and Freedom House. Several authors that include but are not limited to De Haan and Sturm (2000); Jac C. Heckelman (2000); Heckelman and Michael D. Stroup (2000); Abdiweli M. Ali and Mark W. Crain (2001); Sturm and De Haan (2001); Hans Pitlik (2002); Niclas Berggren (2003); John W. Dawson (2003); James D. Gwartney, Randall G. Holcombe, and Robert A. Lawson (2004); Chris Doucouliagos and Mehmet Ali Ulubasoglu (2006, 2008); Williamson and Mathers (2011); Ari Aisen and Francisco J. Veiga (2013) have found a positive relationship between the Eco-nomic Freedom Index and ecoEco-nomic growth. Richard J. Cebula (2011) investigated respectively the effect of ten forms of THF Index of Economic Freedom on eco-nomic growth. Hatem Derbel, Rami Abdelkafi, and Ali Chkir (2011) showed the positive effect of economic freedom on economic growth, but this does not imply the need for a total disengagement of the government in the economy.
In literature, a positive relation between economic freedom and economic growth has been found by many studies and a number of empirical studies suggest that economic freedom may be essential in clarifying cross-country differences in economic performance (e.g.Heckelman 2000; Lundström 2003; Rode Martin, Bodo Knoll and Pitlik 2013). Although many of them used different economic freedom indices, sometimes one or two of the indices, they found similar results that show a positive relation between economic freedom and growth.
In this study, we test the hypothesis that, ceteris paribus more economic freedom
is associated with higher levels of economic growth. Using two indicators from the In-dex of Economic Freedom, this study analyses the effects of tax burden and government regulation of business on economic growth. Our analysis includes countries ranked in the Index of Economic Freedom rather than from a list of developed and developing countries.
2. Data Definition
546 Bernur Acikgoz, Anthony Amoah and Mine Yılmazer
Bank (2013)1 and Economic Freedom Index (Freedom House 20132; The Heritage
Foundation 2013) datasets are used.
In 1995, THF and the Wall Street Journal created an Index of Economic Free-dom based on Adam Smith’s economic theory. This study of Economic FreeFree-dom Index presented a method by which economic freedom could be rated and ranked. Adam Smith’s publication on “The Wealth of Nations” in 1776 emphasizes that protecting the liberty of individuals to pursue their own economic interest results in greater prosperity for the larger society (THF 2008, p. 1). The Index covers 10 freedom components – from property rights to entrepreneurship in 185 countries. These components are grouped into four broad categories of economic freedom: Rule of Law (property rights, freedom from corruption); Limited Government (fiscal dom, government spending); Regulatory Efficiency (business freedom, labor free-dom, monetary freedom); and Open Markets (trade freefree-dom, investment freefree-dom, and financial freedom) (THF 2013).
Our analysis uses two of these components as variables: fiscal freedom and business freedom. The first variable concerns tax burden and tax rates and the se-cond concerns the efficiency of government regulation of business. The first variable,
fiscal freedom is a measure of freedom from the burden of government from the
rev-enue side. It includes freedom from both the tax burden in the sense of the top in-come tax rate and the total amount of tax revenue as a percentage of a nation’s GDP. The second variable, business freedom,indicates the efficiency of government
regu-lations of business, without any government interference that constrains the individ-ual’s right and ability to freely conduct entrepreneurial activities, such as starting and operating a business firm (THF 2013).
Index of Economic Freedom is a weighted summation of the values given to each individual element and is graded by using a scale from 0 to 100, where 100 represents the maximum freedom (THF 2013).
This study uses the Economic Freedom Index by country rankings. Based on this, three different models have been created for three country groups. Group 1 (mostly free countries) ranges from 79.9 to 70; group 2 (moderately free countries) ranges from 69.9 to 60; group 3 (mostly un-free countries) ranges from 59.9 to 50 in the value of index. Country rankings, index value of fiscal freedom and business freedom, average values for 2013 is presented in Appendix 4.
1 World Bank. 2013. World Development Indicators Database.
http://data.worldbank.org/data-catalog/world-development-indicators (accessed March 15, 2014).
2 Freedom House. 2013. Freedom in the World 2013.
547 Economic Freedom and Growth: A Panel Cointegration Approach
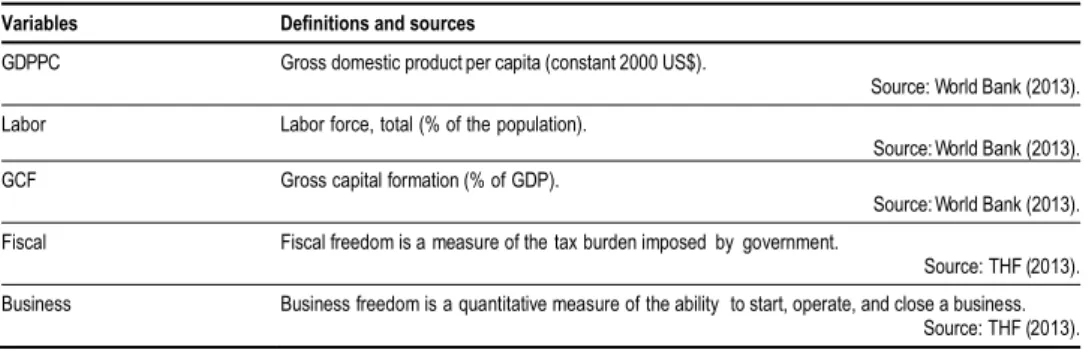
Table 1 Data Definitions and Sources
Variables Definitions and sources
GDPPC Gross domestic product per capita (constant 2000 US$).
Source: World Bank (2013).
Labor Labor force, total (% of the population).
Source: World Bank (2013). GCF Gross capital formation (% of GDP).
Source: World Bank (2013).
Fiscal Fiscal freedom is a measure of the tax burden imposed by government.
Source: THF (2013).
Business Business freedom is a quantitative measure of the ability to start, operate, and close a business. Source: THF (2013).
Notes: Refer to Appendix 1 for detailed table on the variables used in this study.
Source: Authors’ compilation.
3. Brief Methodology
The Cobb-Douglas production function is used to represent an input-output rela-tionship. The following standard function has been used for this study:
,
K L
Y (1)
where: Y = output, L = labor input, K = capital input; α and β are the output elasticity
of labor and capital.
For this study, the production function in Equation (1) is modified to yield:
lnRGDPPCi,t = 12Labori,t 3GCFi,t4Fiscali,t5Businessi,t i,t. (2) From Equation (2), given country (i) and time (t): lnRGDPPCi,t= natural log
of real GDP per capita; Labor = labor force, total percentage of the population; GCF = gross capital formation as a percentage of GDP; Fiscal = fiscal freedom;
Business = business freedom; ɛ =error term.
The panel data technique is used to estimate the equations considering their advantages over cross-section and time series in using all the information that is not detectable in pure cross-sections or in pure time series (Badi H. Baltagi and Chihwa Kao 2000).
In this study, the panel data (cross-section time series) has been created for 24 mostly free, 38 moderately free and 43 mostly un-free countries between 1993 and 2011.
4. Empirical Results and Discussion
548 Bernur Acikgoz, Anthony Amoah and Mine Yılmazer
cointegration. The last sub-section (4.3) uses the DOLS and FMOLS to determine long-run relationship amongst the variables. These sections are individually dis- cussed as follows:
4.1 Panel Unit Root Test
The various empirical works in the literature on panel root test suggest several stand- ard methods that are based on different assumptions with theoretical intuitions. Au- thors not limited to Jörg Breitung (2000); Kaddour Hadri (2000); In Choi (2001); Andrew Levin, Chien-Fu Lin, and Chia-Shang James Chu(2002) (LLC); Kyung So Im, M. Hashem Pesaran, and Yongcheol Shin (2003) (IPS); Josep Lluis Carrion-i- Silvestre, Tomas del Barrio, and Enrigue Lopez-Bazo (2005) have considered auto- regressive specifications. In broader sense, homogeneous autoregressive unit root under alternative hypothesis is assumed by the likes of Breitung (2002), Levin, Lin, and Chu (2002) whereas heterogeneous autoregressive unit root under alternative hypothesis is also assumed by Im, Pesaran, and Shin (2003). In addition, G. S. Mad- dala and Shaowen Wu (1999), Choi (2001) use a non-parametric Fisher statistic that generally seeks to compare unit root tests. Tests such as LLC and Breitung assume a common unit root process whereas IPS, Augmented Dickey-Fuller (ADF) and Phil- lips-Perron (PP) assume an individual unit root process. Furthermore, the common unit root process presumes that the autocorrelation coefficients of the tested variables across cross-sections are identical while for the individual unit root process the auto- correlation coefficients vary across cross-sections.
In avoiding possible biases in dynamic models that could occur as a result of different levels of economic status or development in each country panelled, Nicho- las Apergis and James E. Payne (2009) reiterates the perspective of Im, Pesaran, and Shin (2003). They suggest averaging the ADF unit root tests while considering dif- ferent orders of serial correlation. This study adopts four panel unit root tests under the assumption of common and individual unit root processes respectively. This choice is relevant firstly because of robustness of results and secondly, panel unit root tests are argued in the literature to have a higher predictive power relative to individual time series unit root tests. These tests are conducted on both levels and first differences for all variables in the model. All time series involved contain unit roots according to the LLC test. LLC test in first difference show that for most of these series, their first differences are stationary except for GCF variable. However, panel unit roots tests for IPS, ADF and PP support the hypothesis of a unit root in all variables across countries, as well as the hypothesis of zero order integration in first differences. Thus, following the traditional null hypothesis of stationarity, the results consistently accept stationarity at first difference and rejects stationarity at levels. This indicates that all series are I(1) (see results presented in Appendix 2, 3, and 4).
4.2 Panel Cointegration
549 Economic Freedom and Growth: A Panel Cointegration Approach
Johansen’s ([Fisher] 1988) panel cointegration tests respectively. Pedroni and Kao’s panel cointegration tests follow the Engle-Granger (Robert F. Engle and Clive W. J. Granger 1987) residuals of the long-run static regression, with Fisher following the multivariate framework or combined test of Johansen. The study employs panel data spanning from 1993 to 2011 for three country groupings namely mostly free coun-tries, moderately free countries and mostly un-free countries. In all 24 mostly free countries, 38 moderately free countries and 43 mostly un-free countries are used in the study. The panel cointegration test in each case as earlier mentioned is as follows: For mostly un-free countries, results from the Pedroni test (Appendix 5) reject no cointegration for Panel v-stat and Group PP-stat. However, it failed toreject the null hypothesis for Panel rho-stat, Panel PP-stat, Panel ADF-stat, Group rho-stat and Group ADF-stat. On the contrary, results from the Fisher’s test which is computed based on p-values from Johansen’s maximum likelihood cointegration approach
re-jected the null hypothesis. Kao’s residual test confirms the results by Fisher. There-fore, both Fisher and Kao’s tests as displayed in Appendix 6 and 7 reject the null hy-pothesis and accept the alternative of cointegration.
In the case of mostly moderately free countries, results from the Pedroni test reject no cointegration for Panel v-stat, Panel PP-stat and Group PP-stat. However, it failed to reject the null hypothesis for Panel rho-stat, Panel ADF-stat, Group rho-stat and Group ADF-stat. Here, possible doubts due to the inconclusiveness of the results are cleared by results from the Fisher and Kao’s tests. These tests as displayed in Appendix 6 and 7 reject the null hypothesis and accept the alternative of cointegra-tion.
With mostly free countries, results from the Pedroni test reject no cointegra-tion for Panel v-stat and Panel PP-stat. However, it failed to reject the null hypothesis for Panel rho-stat, Group PP-stat, Panel ADF-stat, Group rho-stat and Group ADF-stat. As in the case of the mostly un-free countries, the uncertainty of the conclusion is relaxed by the introduction of the Fisher’s and Kao’s residual tests which reject the null hypothesis and accept the alternative of cointegration (see Ap- pendix 6 and 7).
In sum, the panel cointegration test results provided in the study rejects the null hypothesis of no cointegration and accepts that variables share a long-run coin- tegrating relationship.
4.3 Long-Run Results
Following the tests conducted on the model, it is evident that the variables are station- ary and cointegrated (see Appendix 2-7). Given this, a Panel DOLS and Panel FMOLS are estimated. Results from any of these two long-run estimations are argued by Anindya Banerjee (1999) to be asymptotically equivalent for more than sixty ob- servations. Given that this study passes the number of observation criterion, we expect the results to be asymptotically equivalent to authenticate the robustness of the results. These estimation procedures also provide the long-run equilibrium relationship be- tween the dependent variable (lnRGDPPC) and the independent variables (Fiscal,
Business, Labor and GCF). These results that are in elasticity estimates are discussed
550 Bernur Acikgoz, Anthony Amoah and Mine Yılmazer
Summary of DOLS and FMOLS long-run estimates are reported in (Appendix 8 and 9).
4.3.1 Mostly Un-Free Countries
The long run equilibrium results are enshrined in the ceteris paribus assumption. The
results as estimated with the DOLS for mostly un-free countries suggest that output elasticity of gross capital formation is positive with a small magnitude. Thus a 1% change gross capital formation is expected to increase economic growth by 0.000572%, albeit insignificant. This result is also confirmed by the FMOLS (if rounded off to 0.001%). The impotency of this variable in the model for mostly un-free countries could be attributed to low level of capital accumulation growth. The labor ratio variable in the model is highly significant and positive with quite a small magnitude, showing that 1% change in labor force is expected to increase economic growth by 0.002008%. The robustness of this result is authenticated by the FMOLS result (if rounded off to 0.002%). Again, elasticity coefficient of 0.002556% that is highly significant at 1% indicates that Fiscal Index has a significantly positive impact on economic growth. Therefore the economies of the mostly un-free countries are ex-pected to grow by approximately 0.003% if the Fiscal Index changes by 1%. The ro-bustness of the results is verified by the results as provided by FMOLS. Lastly, Busi-ness Index was also positive and statistically significant in explaining long-run chang-es in economic growth. Thus, a 1% change in Businchang-ess Index is expected to change economic growth by 0.002046%. This result has again been verified by the FMOLS results. All the variables met the a priori expectations in terms of signs and
signifi-cance levels save GCF that met only the sign. This is confirmed by the FMOLS re-sults that also suggest that all the variables are significant except GCF. This suggests that un-free countries’ spending on capital formation does not significantly affect their economic growth rates.
4.3.2 Moderately Free Countries
The estimates are based on the assumption of ceteris paribus, and are provided also
by DOLS for the moderately free countries. These results deviated marginally from the results of the mostly un-free countries. Here, the output elasticity of gross capital formation is positive and statistically significant, although with a small magnitude. This reveals that a 1% change GCF is expected to increase economic growth by 0.005093% (0.01% rounded off). This result is statistically consistent with the results as displayed by FMOLS. As in the case of the mostly un-free countries, a change in labor force is expected to impact on economic growth by 0.016600% (0.02% app.). This is also observed to be positive and statistically significant. This result is but-tressed by the FMOLS results (0.02% app.).
551 Economic Freedom and Growth: A Panel Cointegration Approach
the right sign as expected a priori. The insignificant nature of the variable could be
explained by inefficiency in enforcement of government regulations that does not challenge the private sector to start and operate business. It can be inferred that except Business Index, all the variables are positive and highly significant in explaining eco- nomic growth per capita among the moderately free countries.
4.3.3 Mostly Free Countries
The results as shown by the DOLS for mostly free countries reveal an anticipated long-run positive and statistically significant relationship between all the explanatory variables and economic growth, ceteris paribus. Regarding the FMOLS results, all the
results followed the results of the DOLS except the elasticity coefficient of GCF, which is positive with a small magnitude and marginally insignificant.
Generally, the results as presented by the DOLS and discussed earlier under each country category reveal the relevance of GCF in increasing economic growth for moderately free and mostly free countries respectively. This result is consistent with theoretical expectations. However, it is not a statistically significant variable in the case of mostly un-free countries. The reason for this is explained by the fact that most-ly un-free countries’ GCF values are very low (Gwartney and Lawson 2007, p. 20) as a result of their relatively low levels of capital accumulation growth. This can cause insignificant effect on economic growth in the model. Labor force and Fiscal indices are regarded as highly important variables in enhancing economic growth for all coun-try categories as economics literature describes. Regarding the magnitude of coeffi-cients, Business Index has a higher impact on economic growth than Fiscal Index in mostly free countries, unlike the other two country groups. This result is consistent with the index values of business and fiscal freedom variables for mostly free coun-tries. Conversely, the Fiscal Index has a higher impact on economic growth than Business Index in mostly un-free and moderately free countries. This result is also consistent with the index values of Business and Fiscal indices. This is additionally attributed to the fact that the index value of fiscal freedom variable is also higher than the index value of business freedom variable for these two country groups. However, Business Index’s effect is not significant on economic growth in moderately free countries. This could be attributed to ineffective enforcement of government regula-tions. The weaknesses in enforcement of government regulations by appropriate in-stitutions in moderately free countries do not encourage the start up and operation of business. In all, the results discussed to a very large extent are seen to be robust as confirmed by the FMOLS results.
5. Conclusion
re-552 Bernur Acikgoz, Anthony Amoah and Mine Yılmazer
sults of this study suggest that with fairly smaller elasticity coefficients, Fiscal Index and Labor are crucial in explaining the long-run changes in economic growth per cap-ita for all the country groups/categories (mostly free, moderately free and un-free). In
addition, Business Index is also crucial in explaining long-run changes in economic growth per capita for only two country groups (mostly free and un-free). Lastly, gross
capital formation is very important in explaining the long-run changes in economic growth per capita for only moderately free countries.
It is important to indicate that studies such as Henrik Hansen and Finn Tarp (2001) have argued the premature introduction of certain policy indices in aid alloca-tion. On the contrary, this study encourages the introduction of certain policy indices such as the economic freedom indices that include but it is not limited to Fiscal and Business indices respectively in long-run economic growth models. Our conclusion is in line with the study by Justice Tei Mensah et al. (2016) where they concluded that governance and fiscal reforms are the key drivers of economic growth.
553 Economic Freedom and Growth: A Panel Cointegration Approach
References
Afonso, António, and Davide Furceri. 2010. “Government Size, Composition, Volatility and
Economic Growth.” European Journal of Political Economy, 26(4): 517-532.
Agell, Jonas, Henry Ohlsson, and Peter Skogman Thoursie. 2006. “Growth Effects of
Government Expenditure and Taxation in Rich Countries: A Comment.” European
Economic Review,50(1): 211-218.
Ahiabor, Godson, and Anthony Amoah. 2013. “The Effects of Corporate Taxes on the
Level of Investment in Ghana.” Development Country Studies, 3(1): 57-67.
Aisen, Ari, and Francisco J. Veiga. 2013. “How Does Political Instability Affect Economic
Growth?”European Journal of Political Economy, 29(1): 151-167.
Alexiou, Constantinos. 2009. “Government Spending and Economic Growth: Econometric
Evidence from the South Eastern Europe (SEE).” Journal of Economic and Social
Research, 11(1): 1-16.
Ali, Abdiweli M., and Mark W. Crain. 2001. “Political Regimes, Economic Freedom,
Institutions, and Growth.” Journal of Public Finance and Public Choice, 19(1): 3-22.
Apergis, Nicholas, and James E. Payne. 2009. “Energy Consumption and Economic Growth in Central America: Evidence from a Panel Cointegration and Error Correction
Model.” Energy Economics, 31(2): 211-216.
Artelaris,Panagiotis, Paschalis Arvanitidis, and George Petrakos. 2006. “Theoretical and Methodological Study on Dynamic Growth Regions and Factors Explaining Their Growth Performance.” Economic and Social Research Institute Working Paper DYNREG02.
Auerbach, Alan J., and James R. Hines Jr. 2001. “Taxation and Economic Efficiency.” In
Handbook of Public Economics, ed. Alan J. Auerbach and Martin Feldstein,
1347-1421. Amsterdam: Elsevier.
Baltagi, Badi H., and Chihwa Kao. 2000. “Nonstationary Panels, Cointegration in Panels and Dynamic Panels: A Survey.” Center for Policy Research Syracuse University Working Paper 16.
Banerjee, Anindya. 1999. “Panel Data Unit Roots and Cointegration: An Overview.” Oxford Bulletin of Economics and Statistics, 1(61): 607-629.
Bengoa, Marta, and Blanca Sanchez-Robles. 2003. “Foreign Direct Investment, Economic
Freedom and Growth: New Evidence from Latin America.” European Journal of
Political Economy, 19(3): 529-545.
Berggren, Niclas. 2003. “The Benefits of Economic Freedom: A Survey.” The Independent Review, 8(2): 193-211.
Bergh, Andreas, and Martin Karlsson. 2010. “Government Size and Growth: Accounting
for Economic Freedom and Globalization.” Public Choice, 142(1): 195-213.
Besley, Timothy, and Torsten Persson. 2009. “The Origins of State Capacity: Property
Rights, Taxation, and Policy.” American Economic Review, 99(4): 1218-1244.
Bose, Niloy, M. Emranul Haque, and Denise R. Osborn. 2007. “Public Expenditure and
Economic Growth: A Disaggregated Analysis for Developing Countries.” The
Manchster School, 75(5): 533-556.
Breitung, Jörg. 2000. “The Local Power of Some Unit Root Tests for Panel Data.” In
554 Bernur Acikgoz, Anthony Amoah and Mine Yılmazer
Breitung, Jörg. 2002. “Nonparametric Tests for Unit Roots and Cointegration.” Journal of Econometrics, 108(2): 343-363.
Carlsson, Fredrik, and Susanna Lundström. 2001. “Economic Freedom and Growth: Decomposing the Effects.” University of Gothenburg Working Papers in Economics 33.
Carrion-i-Silvestre, Josep Lluis, Tomas del Barrio, and Enrigue Lopez-Bazo. 2005.
“Breaking the Panels: An Application to the GDP per capita.” The Econometrics
Journal, 8(2): 159-175.
Cebula, Richard J. 2011. “Economic Growth, Ten Forms of Economic Freedom, and
Political Stability: An Empirical Study Using Panel Data, 2003-2007.” The Journal of
Private Enterprise, 26(2): 61-81.
Chen, Sheng-Tung, and Chien-Chiang Lee. 2005. “Government Size and Economic Growth
in Taiwan: A Threshold Regression Approach.” Journal of Policy Modeling, 27(9):
1051-1066.
Choi, In. 2001. “Unit Root Tests for Panel Data.” Journal of International Money and Finance, 20(2): 249-272.
Cogan, John F., Tobias Cwik, John B. Taylor, and Volker Wieland. 2010. “New
Keynesian Versus Old Keynesian Government Spending Multipliers.”Journal of
Economic Dynamics and Control, 34(3): 281-295.
Cogan, John F., and John B. Taylor. 2011. “What the Government Purchases Multiplier Actually Multiplied in the 2009 Stimulus Package.” Unpublished.
Cooray, Arusha. 2009. “Government Expenditure, Governance and Economic Growth.”
Comparative Economic Studies, 51(3): 401-418.
D’Amico, Guglielmo, Giuseppe di Biase, and Raimondo Manca. 2013. “Effects on Taxation on the Forecasting of Income Inequality: Evidence from Germany, Greece,
and Italy.” Panoeconomicus, 60(6): 707-723.
Dar, Atul A., and Sal AmirKhalkhali. 2002. “Government Size, Factor Accumulation, and
Economic Growth: Evidence from OECD Countries.” Journal of Policy Modeling,
24(7-8): 679-692.
Dawson, John W. 2003. “Causality in the Freedom-Growth Relationship.” European Journal ofPolitical Economy, 19(3): 479-495.
De Haan, Jakop, and Jan-Egbert Sturm. 2000. “On the Relationship between Economic
Freedom and Economic Growth.” European Journal of Political Economy, 16(2):
215-241.
De Haan, Jakop, Susanna Lundström, and Jan-Egbert Sturm. 2006. “Market-Oriented
Institutions and Policies and Economic Growth: A Critical Survey.” Journal of
Economic Surveys, 20(2): 157-191.
Derbel, Hatem, Rami Abdelkafi, and Ali Chkir. 2011. “The Effects of Economic Freedom
Components on Economic Growth: An Analysis with a Threshold Model.” Journal of
Politics and Law, 4(2): 49-60.
Devarajan, Shantayanan, and Ravi Kanbur. 2013. “The Evolution of Development Strategy as Balancing Market and Government Failure.” Cornell University Working Paper 2013-09.
Doucouliagos, Chris, and Mehmet Ali Ulubasoglu. 2006. “Economic Freedom and
Economic Growth: Does Specification Make a Difference?” European Journal of
555 Economic Freedom and Growth: A Panel Cointegration Approach
Doucouliagos, Chris, and Mehmet Ali Ulubasoglu. 2008. “Democracy and Economic
Growth: A Meta-Analysis.” American Journal of Political Science, 52(1): 61-83.
Engle, Robert F., and Clive W. J. Granger. 1987. “Cointegration and Error-Correction:
Representation, Estimation and Testing.” Econometrica, 55(2): 251-276.
Folster, Stefan, and Magnus Henrekson. 2001. “Growth Effects of Government
Expenditure and Taxation in Rich Countries.” European Economic Review, 45(8):
1501-1520.
Galor, Oded, and DavidN. Weil. 2000. “Population, Technology, and Growth: From
Malthusian Stagnation to the Demographic Transition and Beyond.” The American
Economic Review, 90(4): 806-828.
Galor, Oded. 2005. “Stagnation to Growth: Unified Growth Theory.” In Handbook of Economic Growth, ed. Philippe Aghion and Steven N. Durlauf, 171-293. Amsterdam:
Elsevier.
Ghosh Roy, Atrayee. 2012. “Revisiting the Relationship between Economic Growth and Government Size.” http://www.hindawi.com/journals/ecri/2012/383812.
Günalp, Burak, and Timur Han Gür. 2002. “Government Expenditures and Economic
Growth in Developing Countries: Evidence from a Panel Data Analysis.” METU
Studies in Development, 29(3-4): 311-332.
Gwartney, James D., Randall G. Holcombe, and Robert A. Lawson. 2004. “Economic Freedom, Institutional Quality, and Cross-Country Differences in Income and
Growth.” Cato Journal, 24(3): 205-233.
Gwartney, James D., and Robert A. Lawson. 2007. Economic Freedom of the World 2007
Annual Report. Vancouver: The Fraser Institute.
Hadri, Kaddour. 2000. “Testing for Stationarity in Heterogeneous Panel Data.” The Econometrics Journal, 3(2): 148-161.
Hansen, Henrik,and Finn Tarp. 2001. “Aid and Growth Regressions.” Journal of Development Economics, 64(2): 547-570.
Heckelman, Jac C. 2000. “Economic Freedom and Economic Growth: A Short-Run Causal
Investigation.” Journal of Applied Economics, 3(1): 71-91.
Heckelman, Jac C., and Michael D. Stroup. 2000. “Which Economic Freedoms Contribute
to Growth?” Kyklos, 53(4): 527-544.
Im, Kyung So, M. Hashem Pesaran, and Yongcheol Shin. 2003. “Testing for Unit Roots in
Heterogeneous Panels.” Journal of Econometrics, 115(1): 53-74.
Johansen, Soren. 1988. “Statistical Analysis of Cointegration Vectors.” Journal of Economics Dynamic and Control, 12(2-3): 231-254.
Johansson, Åsa, Christopher Heady, Jens Arnold, Bert Brys, and Laura Vartia. 2008. “Tax and Economic Growth.” Organisation for Economic Co-operation and Development Economic Department Working Paper 620.
Kao, Chihwa. 1999. “Spurious Regression and Residual-Based Tests for Cointegration in Panel Data.” Journal of Econometrics, 90(1): 1-44.
Kuştepeli, Yesim. 2005. “The Relationship between Government Size and Economic Growth: Evidence from a Panel Data Analysis.” Dokuz Eylul University Discussion Paper 05/06.
556 Bernur Acikgoz, Anthony Amoah and Mine Yılmazer
Levin, Andrew, Chien-Fu Lin, and Chia-Shang James Chu. 2002. “Unit Root Tests in
Panel Data: Asymptotics and Finite-Sample Properties.” Journal of Econometrics,
108(1): 1-24.
Lucas, Robert E. 1988. “On the Mechanics of Economic Development.” Journal of MonetaryEconomics, 22(1): 3-42.
Lundström, Susanna. 2003. “Effects of Economic Freedom on Growth and the Environment – Implications for Cross-Country Analysis.” Goteborg University Working Papers in Economics 115.
Maddala, G. S., and Shaowen Wu. 1999. “A Comparative Study of Unit Root Tests with
Panel Data and a New Simple Test.” Oxford Bulletin of Economics and Statistics,
61(S1): 631-652.
Martin, Rode, Bodo Knoll, and Hans Pitlik. 2013. “Economic Freedom, Democracy, and
Life Satisfaction.” In Economic Freedom of the World: 2013 Annual Report, ed. James
D. Gwartney, Robert A. Lawson, and Joshua Hall, 215-233. Vancouver: Fraser Institute.
Mensah, Justice Tei, George Adu, Anthony Amoah, Kennedy Kwabena Abrokwa, and Joseph Adu. 2016. “What Drives Structural Transformation in Sub-Saharan Africa?”
The Journal of African Development Review, 28(2): 157-169.
Oh, Hyunseung, and Ricardo Reis. 2011. “Targeted Transfers and the Fiscal Response to the Great Recession.” National Bureau of Economic Research Working Paper 16775.
Organization for Economic Co-operation and Development. 2009. “Taxation and
Economic Growth.” In Economic Policy Reforms 2009 Going for Growth, 143-161.
Paris: Organization for Economic Co-operation and Development.
Özerkek, Yasemin, and Sadullah Çelik. 2010. “The Link between Government Spending, Consumer Confidence and Consumption Expenditures in Emerging Market
Countries.” Panoeconomicus, 57(4): 471-485.
Paldam, Martin, Allan Würtz, and Tue Gorgens. 2003. “The Big Bend Economic Freedom and Growth.” Paper presented at the Annual meeting in Aarhus.
Pedroni, Peter. 2004. “Panel Cointegration: Asymptotic and Finite Sample Properties of
Pooled Time Series Tests with an Application to the PPP Hypothesis.” Econometric
Theory, 20(3): 597-625.
Petrakos, George, Paschalis Arvanitidis, and Sotiris Pavleas. 2007. “Determinants of Economic Growth: The Experts’ View.” Dynamic Regions in a Knowledge-Driven Global Economy Lessons and Policy Implications for the EU Working Paper 20/2007.
Pitlik, Hans. 2002. “The Path of Liberalization and Economic Growth.” Kyklos, 55(1): 57-80.
Prettner, Klaus. 2012. “Public Education, Technological Change and Economic Prosperity: Semi-Endogenous Growth Revisited.” Program on the Global Demography of Aging Working Paper 90.
Romer, Paul M. 1993. “Two Strategies for Economic Development: Using Ideas and
Producing Ideas.” In Supplement to the World Bank Economic Review and the World
Bank Research Observer, ed. Lawrence H. Summers and Shekhar Shah, 63-91.
Washington, DC: World Bank.
Romero-Ávila, Diego, and Rolf Strauch. 2008. “Public Finances and Long-Term Growth in
Europe: Evidence from a Panel Data Analysis.” European Journal of Political
557 Economic Freedom and Growth: A Panel Cointegration Approach
Samimi, Ahmad Jafari, and Farzane Habibian. 2010. “Government Size & Economic
Growth: New Evidence from Some Developing Countries.” Journal of Basic and
Applied Scientific Research, 1(2): 118-123.
Solow, Robert M. 1956. “A Contribution to the Theory of Economic Growth.” The Quarterly Journal of Economics, 70(1): 65-94.
Sturm, Jan-Egbert, and Jakop de Haan. 2001. “How Robust Is the Relationship between
Economic Freedom and Economic Growth?” Applied Economics, 33(7): 839-844.
Swan, Trevor W. 1956. “Economic Growth and Capital Accumulation.” The Economic Record, 32(2): 334-361.
The Heritage Foundation. 2008. “2008 Index of Economic Freedom.”
http://thf_media.s3.amazonaws.com/index/pdf/2008/Index2008_ExecutiveSummary.p df.
The Heritage Foundation. 2013. “2013 Index of Economic Freedom Promoting Economic Opportunity and Prosperity.”
https://thf_media.s3.amazonaws.com/index/pdf/2013/Index2013_Highlights.pdf.
Tomljanovich, Marc. 2004. “The Role of State Fiscal Policy in State Economic Growth.”
Contemporary Economic Policy, 22(3): 318-330.
Von Al-Yousif, Yousif Khalifa. 2000. “Do Government Expenditures Inhibit or Promote
Economic Growth: Some Empirical Evidence from Saudi Arabia.” Indian Economic
Journal, 48(2): 92-96.
Vukotić, Veselin. 2008. “Economic Freedom and New Economic Paradigm.”
Panoeconomicus, 55(1): 115-128.
Widmalm, Frida. 2001. “Tax Structure and Growth: Are Some Taxes Better than Others?”
PublicChoice, 107(3-4): 199-219.
Williamson, Claudia R., and Rachel L. Mathers. 2011. “Economic Freedom, Culture, and
Growth.” Public Choice, 148(3): 313-335.
Yamarik, Steven. 2000. “Can Tax Policy Help Explain State-Level Macroeconomic
Growth?” EconomicsLetters, 68(2): 211-215.
Zeng, Kanghua, Shan Li, and Qian Li. 2013. “The Impact of Economic Growth and Tax
Reform on Tax Revenue and Structure: Evidence from China Experience.” Modern
558 Bernur Acikgoz, Anthony Amoah and Mine Yılmazer
Appendix 1 Data Definitions and Sources
Variables Definitions and sources
GDP PC
lnGDPPC
GDP per capita (constant 2000 US$); GDP per capita is GDP divided by midyear population. This variable is transformed by authors into a logarithmic form.
Source: World Bank (2013).
Labor
Labor
Labor force, total (% of the population).
Source: World Bank (2013).
GCF
GCF
Gross capital formation (% of GDP); Gross capital formation consists of outlays on additions to the fixed assets of the economy plus net changes in the level of inventories.
Source: World Bank (2013).
Fiscal freedom
Fiscal
Fiscal freedom is a measure of the tax burden imposed by government. It includes both the direct tax burden in terms of the top tax rates on individual and corporate incomes and the overall amount of tax revenue as a percentage of GDP.
Source: THF (2013).
Business freedom
Business
Business freedom is a quantitative measure of the ability to start, operate, and close a business that represents the overall burden of regulation as well as the efficiency of government in the regulatory process.
Source: THF (2013).
Source: Authors’ estimation. Appendix 2 Unit Root Test Results
Mostly free countries
Variables/Tests lnGDPPC GCF Labor Business Fiscal
Null: Unit root (assumes common unit root process)
LLCt-stat Level -1.2099 -4.53139 -2.6291 0.74085 -7.6986
Prob (0.1132) (0.0000) (0.0043) (0.7706) (0.0000)
1.diff. -7.79037 -7.56846 -2.9468 -6.7528 -7.6841
Prob (0.0000) (0.0000) (0.0016) (0.0000) (0.0000)
Null: Unit root (assumes individual unit root process)
IPSW-stat
Level 1.26358 -2.28497 -0.5597 0.47450 -3.6048
Prob (0.8968) (0.0112) (0.2878) (0.6824) (0.0002)
1.diff. -5.42180 -6.69881 -4.4048 -4.9812 -7.1525
Prob (0.0000) (0.0000) (0.0000) (0.0000) (0.0000)
ADF Level 41.3385 67.1855 72.7936 35.3587 94.4118
Prob (0.7406) (0.0351) (0.0120) (0.9123) (0.0001)
1.diff. 111.826 127.967 98.4821 103.981 136.021
Prob (0.0000) (0.0000) (0.0000) (0.0000) (0.0000)
PP Level 22.7526 57.6380 91.6648 62.8031 66.4777
Prob (0.9993) (0.1607) (0.0001) (0.0742) (0.0398)
1.diff. 160.824 259.008 203.969 231.602 298.711
Prob (0.0000) (0.0000) (0.0000) (0.0000) (0.0000)
Notes: The null hypothesis is rejected with 5% significance. LLC and IPS tests are used to compute lag length by using
AIC. Exogenous variables: individual effects, individual linear trends, Newey-West automatic bandwidth selection and Bartlett kernel.
559 Economic Freedom and Growth: A Panel Cointegration Approach
Appendix 3 Unit Root Test Results
Moderately free countries
Variables/Tests lnGDPPC GCF Labor Business Fiscal
Null: Unit root (assumes common unit root process)
LLCt-stat Level -1.1409 -1.6620 -1.0948 1.8225 -1.9000
Prob (0.1269) (0.0482) (0.1368) (0.9658) (0.0287)
1.diff. -9.1517 -11.202 -6.6296 -8.7084 -8.4481
Prob (0.0000) (0.0000) (0.0000) (0.0000) (0.0000)
Null: Unit root (assumes individual unit root process)
IPSW-stat
Level 4.35140 -1.6318 3.24494 0.82256 1.01342
Prob (1.0000) (0.0514) (0.9994) (0.7946) (0.8446)
1.diff. -6.6672 -10.580 -8.0231 -10.110 -10.927
Prob (0.0000) (0.0000) (0.0000) (0.0000) (0.0000)
ADF Level 46.1088 93.2754 44.1761 63.3177 62.7780
Prob (0.9973) (0.0869) (0.9987) (0.8502) (0.8615)
1.diff. 175.865 255.856 205.057 242.01 267.025
Prob (0.0000) (0.0000) (0.0000) (0.0000) (0.0000)
PP Level 69.3297 100.335 50.3031 114.18 85.4815
Prob (0.6926) (0.0323) (0.9899) (0.003) (0.2140)
1.diff. 262.430 515.933 610.932 744.895 574.687
Prob (0.0000) (0.0000) (0.0000) (0.0000) (0.0000)
Notes: The null hypothesis is rejected with 5% significance. LLC and IPS tests are used to compute lag length by using
AIC. Exogenous variables: individual effects, individual linear trends, Newey-West automatic bandwidth selection and Bartlett kernel.
Source: Authors’ compilation. Appendix 4 Unit Root Test Results
Mostly un-free countries
Variables/Tests lnGDPPC GCF Labor Business Fiscal
Null: Unit root (assumes common unit root process)
LLCt-stat Level -0.38666 -2.7301 -0.7935 -3.92089 -9.1109
Prob (0.3495) (0.0032) (0.2137) (0.0000) (0.0000)
1.diff. -3.36528 -1.0921 -4.95691 -3.8158 -5.2790
Prob (0.0004) (0.1374) (0.0000) (0.0001) (0.0000)
Null: Unit root (assumes individual unit root process)
IPSW-stat
Level 5.24465 -1.68512 -0.0302 -0.3329 0.15731
Prob (1.0000) (0.0460) (0.4879) 0.3696 (0.5625)
1.diff. -7.46151 -7.82871 2.0479 -5.6339 -6.9006
Prob (0.0000) (0.0000) (0.0203) (0.0000) (0.0000)
ADF Level 61.2475 105.605 97.1496 85.9161 80.3445
Prob (0.9800) (0.0743) (0.1932) 0.4823 (0.6517)
1.diff. 208.156 212.810 120.138 163.536 191.567
Prob (0.0000) (0.0000) (0.0089) (0.0000) (0.0000)
PP Level 33.5219 122.475 110.205 70.4376 138.746
Prob (1.0000) (0.0060) (0.0404) 0.8879 (0.0003)
1.diff. 493.331 522.918 219.281 355.384 494.497
Prob (0.0000) (0.0000) (0.0000) (0.0000) (0.0000)
Notes: The null hypothesis is rejected with 5% significance. LLC and IPS tests are used to compute lag length by using
AIC. Exogenous variables: individual effects, individual linear trends, Newey-West automatic bandwidth selection and Bartlett kernel. (Results provided by LLC, IPS, ADF and PP in the mostly un-free countries confirmed stationarity among all series at first difference. However, LLC for GCF was stationary at second difference).
560 Bernur Acikgoz, Anthony Amoah and Mine Yılmazer
Appendix 5 Pedroni Residual Cointegration Test Results
Model Mostly un-free countries Moderately free countries Mostly free countries
Stat Weighted Stat Weighted Stat Weighted Panel v- -2.3219*** -3.83700*** 10.9920*** -6.416*** -16.8610*** -8.4350***
Panel rho- -4.5062*** -4.43850*** -4.2674*** -6.416*** -3.1313*** -4.1191***
Panel PP- -0.8383*** -2.66700*** -2.6840*** -0.213*** -2.5030*** -0.1354***
Panel ADF- -0.5170*** -0.92081*** -2.1314*** -2.661*** -0.3624*** -0.4991***
Group rho- -6.6541*** -7.0418*** -5.4392***
Group PP- -3.2720*** -3.1770*** -0.3057***
Group ADF- -1.0225*** -1.6868*** -1.8701***
Source: Authors’ compilation.
Appendix 6 Johansen Fisher Panel Cointegration Test Results – Unrestricted Cointegration Rank Test (Trace and Maximum Eigenvalue)
Model Mostly un-free countries Moderately free countries Mostly free countries Hypothesized
No. of CE(s)
Fisher St* (trace) Prob. Fisher St* (max-eigen) Prob. Fisher St* (trace) Prob. Fisher St* (max-eigen) Prob. Fisher St* (trace) Prob. Fisher St* (max -eigen) Prob. None 1711. (0.0000) 1159. (0.0000) 1564. (0.0000) 1088. (0.0000) 968.0 (0.0000) 690.3 (0.0000)
At most 1 889.7
(0.0000) 571.7 (0.0000) 771.4 (0.0000) 513.9 (0.0000) 484.5 (0.0000) 265.6 (0.0000)
At most 2 433.3
(0.0000) 301.3 (0.0000) 356.7 (0.0000) 233.8 (0.0000) 273.4 (0.0000) 179.3 (0.0000)
At most 3 226.4
(0.0000) 177.3 (0.0000) 203.7 (0.0000) 148.4 (0.0000) 150.5 (0.0000) 110.4 (0.0000)
At most 4 183.6
(0.0000) 183.6 (0.0000) 182.6 (0.0000) 182.6 (0.0000) 130.0 (0.0000) 130.0 (0.0000)
Notes: * Probabilities are computed using asymptotic Chi-square distribution.
Source: Authors’ compilation.
Appendix 7 Kao Residual Cointegration Test Results*
MODELS
Mostly un-free countries Moderately free countries Mostly free countries
t-statistic Prob. t-statistic Prob. t-statistic Prob. ADF -2.167860 (0.0151) -2.087926 (0.0184) -2.028036 (0.0213)
Residual variance 0.000564 0.000328 0.000273
HACvariance 0.000985 0.000594 0.000446
Augmented Dickey-Fuller test equation D(RESID) Coefficient
Std. error t-stat
Coefficient
Std. error t-stat
Coef.
Std. error t-stat RESID(-1) -0.101***
(0.0131)
-7.676 -0.131*** (0.0190)
-6.92 -0.135*** (0.021)
-6.23
D(RESID(-1)) 0.3409 *** (0.030)
11.012 0.09242**
(0.038)
2.411 0.183*** (0.046)
3.99
Notes: * Newey-West automatic bandwidth selection and Bartlett kernel.
561 Economic Freedom and Growth: A Panel Cointegration Approach
Appendix 8 Summary of DOLS Long-Run Estimates
MODELS
DOLS Mostly un-free countries Moderately free countries Mostly free countries
lnGDPPC Coefficient
Std. error
Coefficient Std. error
Coefficient Std. error
GCF 0.000572
(0.000774)
0.005093***
(0.000744)
0.002678**
(0.001205)
LABOR 0.024923***
(0.002008)
0.016600*** (0.001757)
0.008657**
(0.003439)
FISCAL 0.002556***
(0.000587)
0.005192*** (0.001092)
0.002661*** (0.000588)
BUSINESS 0.002046***
(0.000600)
0.000353
(0.001575)
0.002937*** (0.000482)
Notes: ***, **, * implies 1%, 5% and 10% significance levels.
Source: Authors’ compilation.
Appendix 9 Summary of FMOLS Long-Run Estimates
MODELS
FMOLS Mostly un-free countries Moderately free countries Mostly free countries
lnGDPPC Coefficient
Std. error
Coefficient Std. error
Coefficient Std. error
GCF 0.001025
(0.000764)
0.005424***
(0.000747)
0.001667
(0.001072)
Labor 0.025137***
(0.002171)
0.016622*** (0.001806)
0.013883***
(0.002425)
Fiscal 0.003264***
(0.000604)
0.005723***
(0.000572)
0.003909***
(0.000629)
Business 0.001318***
(0.000591)
0.000233
(0.000467)
0.002466***
(0.000466)
Notes: ***, **, * implies 1%, 5% and 10% significance levels.
562 Bernur Acikgoz, Anthony Amoah and Mine Yılmazer
Appendix 10 Components and Averages of Economic Freedom Index
Mostly free Moderately free Mostly un-free 2011 Fiscal
freedom
Business freedom
2011 Fiscal freedom
Business freedom
2011 Fiscal freedom
Business freedom
Austria 51 73 Albania 92 81 Azerbaijan 85 69
Bahrain 99 75 Armenia 88 87 Bangladesh 72 68
Botswana 79 69 Barbados 74 74 Belize 82 72
Canada 79 91 Belgium 45 91 Benin 76 45
Chile 77 70 Bulgaria 94 73 Bosnia&Her 83 54
Czech Rep. 82 65 Colombia 76 90 Brazil 70 53
Denmark 39 98 Costa Rica 82 58 Burkina Faso 81 61
Estonia 79 78 Croatia 75 63 Cambodia 90 39
Finland 66 94 El Salvad. 85 61 Cameroon 69 46
Georgia 88 90 France 53 84 China 70 48
Germany 61 92 Ghana 86 61 Dominican 83 53
Iceland 72 91 Guatemala 79 50 Egypt, Arab 85 63
Ireland 73 83 Hungary 79 79 Fiji 78 65
Japan 69 81 Israel 60 66 Gabon 74 56
Jordan 93 69 Italy 55 76 Greece 66 77
Lithuania 92 77 Kazakhst. 93 71 Guinea 69 46
Luxembourg 65 74 Latvia 84 75 Guyana 67 66
Norway 51 92 Madagasc. 90 63 Honduras 85 61
Korea Rep. 73 93 Malaysia 85 79 India 78 37
Sweden 39 93 Malta 61 61 Indonesia 83 50
Bahamas 97 71 Mexico 81 81 Kenya 77 58
Netherlands 52 83 Namibia 66 68 Kyrgyz Rep. 94 73
UK 57 94 Panama 86 72 Lebanon 90 50
US 69 90 Paraguay 95.9 59 Malawi 78 41
Peru 79 72 Mali 69 50
Poland 76 64 Mauritania 80 43
Portugal 61 82 Moldova 87 69
Romania 87 70 Morocco 71 76
S.Arabia 99 68 Mozambique 76 63
Slovak Rep. 84 71 Nepal 85 57
Slovenia 65 80 Nicaragua 78 51
S. Africa 70 74 Pakistan 80 70
Spain 53 80 Russian Fed. 86 69
Sri Lanka 84 77 Senegal 65 56
Thailand 78 73 Swaziland 74 66
Turkey 77 68 Tajikistan 92 61
Uganda 80 48 Tanzania 79 48
Uruguay 84 73 Philippines 79 53
Gambia, The 75 59
Tunisia 74 82
Vietnam 75 63
Yemen Rep. 91 61
Zambia 72 60
Average V. 71 83 77 72 78 58