FUNDAÇÃO GETULIO VARGAS
ESCOLA DE ADMINISTRAÇÃO DE EMPRESAS DE SÃO PAULO
MÁRCIO DE SÁ MELLO
PRE-IPO CAPITAL INFUSION AND UNDERWRITING IN BRAZIL: A STUDY ON CONFLICTS OF INTERESTS IN THE UNIVERSAL BANKING SYSTEM
São Paulo
Escola de Administração de Empresas da FGV-SP
MÁRCIO DE SÁ MELLO
PRE-IPO CAPITAL INFUSION AND UNDERWRITING IN BRAZIL: A STUDY ON CONFLICTS OF INTERESTS IN THE UNIVERSAL BANKING SYSTEM
Dissertação apresentada ao Curso de Mestrado da Escola de Administração de Empresas da Fundação Getúlio Vargas-SP como requisito para obtenção do Grau de Mestre em Administração de Empresas.
Campo de Conhecimento: Mercados Financeiros e Finanças Corporativas
Orientador: Prof. Dr. Antonio Gledson de Carvalho
São Paulo
Escola de Administração de Empresas da FGV-SP
Mello, Márcio de Sá.
Pre-IPO capital infusion and underwriting in Brazil: a study on conflicts of interests in the universal banking system / Márcio de Sá Mello. - 2010.
56 f.
Orientador: Antonio Gledson de Carvalho
Dissertação (mestrado) - Escola de Administração de Empresas de São Paulo.
1. Oferta pública inicial de títulos (Finanças). 2. Sociedades comerciais --
Finanças -- Brasil. 3. Preços – Estabilização -- Brasil. 4. Desempenho -- Avaliação. I. Carvalho, Antonio Gledson. II. Dissertação (mestrado) - Escola de Administração de Empresas de São Paulo. III. Título.
MÁRCIO DE SÁ MELLO
PRE-IPO CAPITAL INFUSION AND UNDERWRITING IN BRAZIL: A STUDY ON CONFLICTS OF INTERESTS IN THE UNIVERSAL BANKING SYSTEM
Dissertação apresentada ao Curso de Mestrado da Escola de Administração de Empresas da Fundação Getúlio Vargas-SP como requisito para obtenção do Grau de Mestre em Administração de Empresas.
Campo de Conhecimento: Mercados Financeiros e Finanças Corporativas
Data de Aprovação:
Banca Examinadora:
________________________________________ Prof. Dr. Antonio Gledson de Carvalho
(Orientador) FGV-EAESP
________________________________________ Prof. Dr. Alkimar Ribeiro Moura
FGV-EAESP
AGRADECIMENTOS
Aos meus pais, por todo o apoio, carinho e investimento realizado em minha educação ao longo dos meus 25 anos. À minha irmã caçula Elisa, por compreender o fato de não poder estar perto durante todos estes anos em que estive estudando fora.
Ao meu orientador Prof. Dr. Antonio Gledson de Carvalho, por toda a contribuição dada através de idéias e sugestões que sem dúvida fizeram a diferença final.
Aos membros da banca Prof. Dr. Alkimar Ribeiro Moura e Profª. Drª. Andrea Maria Accioly Fonseca Minardi, pelas sugestões valiosas ao trabalho.
Ao Douglas Beserra Pinheiro, à Sabrina Ozawa Gionelli e à Isabela Travaglia Santos, por terem contribuído também de forma significativa na realização deste trabalho.
RESUMO
O presente trabalho busca investigar o impacto das relações de crédito entre underwriters e empresas emissoras. No período de 2004 à 2008 um crescente número de empresas brasileiras aproveitou o cenário de otimismo nos mercados financeiros para emitir ações na bolsa. Boa parte desses negócios envolveu aporte de capital dos underwriters às empresas emissoras, seja por meio de empréstimos ou participação no capital social. Estudos recentes realizados no Brasil acusam tal prática como de comportamento oportunista, onde underwriters estariam levando empresas não preparadas ao mercado. Utilizando-se de análises de Gerenciamento de Resultados e Estabilização de Preços nosso estudo identificou indícios de que underwriters fazem uso da estabilização de preços e em maior intensidade em ofertas onde possuem alguma relação de crédito com a empresa emissora. Já os níveis de Gerenciamento de Resultados são os mesmos para empresas que receberão aporte de capital e àquelas que não receberam.
ABSTRACT
This research paper investigates the issue of pre-IPO capital infusion and underwriting. During the bullish market from 2004 to 2008, a great number of Brazilian companies decided to go public. In many of these issues, the issuing company had received capital from its underwriters through lending and/or equity ownership. Recent research papers in Brazil argue that these loans had the intention to inflate issuing companies and deceive investors. Through an analysis of Earnings Management and Price Stabilization our research found evidences that underwriters stabilize more and with higher intensity those IPOs in which they lent money or bought equity stake in issuing companies. When looking at Earnings Management the result shows no difference between firms that received capital and those that did not.
LIST OF FIGURES
Figure 1: Description of the IPO phases ... 25
LIST OF TABLES
Table 1: Discretionary Current Accrual - Mean Comparison ... 27
Table 2: Earnings Management Regression - Differences between IPO Phases .... 28
Table 3: Earnings Management Regression (B1) - Influence of loans and equity on discretionary current accruals ... 30
Table 4: Earnings Management Regression (B2) - Influence of loans in different phases of the IPO... 31
Table 5: Earnings Management Regression (B3) - Influence of equity in different phases of the IPO... 32
Table 6: Determinants of Stabilization (C1) - loan impact ... 39
Table 7: Determinants of Stabilization's Intensity (C3) - loan impact... 41
Table 8: Post-Stabilization short-term returns for IPOs with outstanding loans (C5) 42
Table 9: Post-Stabilization short-term returns for IPOs with outstanding loans (C5) 43
Table 10: Determinants of Stabilization (C2) - equity impact... 44
Table 11: Determinants of Stabilization's Intensity (C4) - equity impact... 45
Table 12: Post-Stabilization short-term returns for IPOs with equity ownership (C6)46
Table 13: Post-Stabilization short-term returns for stabilized IPOs with equity
ownership (C8) ... 47
Table 14: Determinants of Stabilization - Concomitant loan and equity impact... 48
Table 15: Determinants of Stabilization's Intensity - Concomitant loan and equity impact... 49
Table 16: Post-stabilization returns for IPOs with concomitant outstanding loans and equity participation ... 50
TABLE OF CONTENTS
1. Introduction... 8
2. Literature Review... 11
2.1. Conflict of Interest in concurrent lending and underwriting activities ... 11
2.2. Empirical Evidences... 12
2.3. Local Scenario ... 14
2.4. Earnings Management... 16
2.5. Price Stabilization ... 17
3. Data ... 19
4. Earnings Management Analysis... 20
4.1. Hypothesis ... 20
4.2. Calculating Discretionary Current Accruals ... 21
4.3. Methodology ... 23
4.4. Empirical Findings... 26
4.4.1. Mean comparison... 26
4.4.2. Regression Models ... 28
5. Price Stabilization Analysis ... 34
5.1. Hypothesis ... 34
5.2. Methodology ... 35
5.3. Empirical Findings... 38
5.3.1. Loans ... 38
5.3.2. Equity ... 43
5.3.3. Concomitant Loan and Equity Ownership ... 47
6. Conclusion ... 52
1. Introduction
This study focuses on concurrent deals that are inherent of the Universal Banking system in Brazil, where a less restrictive regulation allowed banks to lend money and underwrite securities for the same firm. Until recently, there was no regulation preventing universal banks to engage in such activities. Since March 2009, the code of best practices elaborated by the Brazilian Financial and Capital Market Association (ANBIMA) requires the participation of an additional and independent underwriter in two cases: a) when the bank has an equity stake of 10% or more in the issuing firm and b) when 20% or more of the Initial Public Offering (IPO) proceeds are due to the underwriter in the form of debt or equity payment.
This move towards a more regulated scenario has its origins in the fear of moral hazard arising from conflicts of interests. Having two different types of clients (issuing firms and investors), underwriters might get unfairly inclined to benefit one side more than the other if they become attached to them through credit. This inclination might harm the weak side (investors), which will end up buying poorly assessed shares. Although this is a legitimate concern, the theoretical arguments assume that markets on its own and reputational concerns would prevent this behavior from happening. BEATTY and RITTER (1986) and KATANAS and QI (1997) argue that “reputation capital” would be strong enough to prevent opportunistic behavior. Underwriters who cheat during such activities are unable to profit from its reputation in futures business. In a repeated game, where banks engage continuously in underwriting business, agents who act unethically would end up losing market share in the following periods.
So far, most researches on conflict of interest on universal banking concluded that there were no evidences of moral hazard in such activity. Even in cases where the market would perceive conflicts of interest in this “tight” relationship, the market itself would engender its own solution and/or investors would charge a discount on suspicious offers (NARAYANAN, RANGAN, and RANGAN, 2004; KLEIN and ZOELLER, 2003). Nevertheless, there is a possible bias in these studies. As noted in XIE (2007), the majority of them were made using data from developed countries like the United States of America, Japan and Germany. The author argues that different country characteristics may affect the intensity of conflicts of interests in universal banking activity, therefore, not allowing us to simply extend the international evidence to a peculiar country like Brazil.
Recent studies on conflict of interest in the Brazilian Universal banking system alleged to have found evidences of opportunistic behavior. SANTOS, DA SILVEIRA and BARROS (2009) claim that during the IPO wave of 2004-2007, capital infusion made by underwriters had the purpose of making issuing companies look better than what they were. These authors claim to have found poor long-term performance and low underpricing associated to such IPOs. This induced them to assert that some lemons were indeed being pushed intentionally to the market. We will argue that the data does not support this conclusion. LIMA (2009) came to the same conclusion on pre-IPO capital infusion. She claims to have found higher underwriting fees and lower price revision during the bookbuilding phase associated to such IPOs, naming this as evidences of opportunistic behavior. We present reasons to disagree with the interpretation of her findings.
or not moral hazard actually occurred. This study looks at earning managements around the IPO phase and price support in the post-IPO.
Our findings did not find convincing evidence to support a positive correlation between credit ties and the level of earnings management. In reality, IPOs of firms that received capital infusion from their underwriters presented an average level of earnings management lower than firms who did not have any credit relationship. On the other hand, findings on price stabilization do give some indications that underwriters might act more frequently and fiercely on the secondary market when they have loans and/or equity with the issuing company. This occurred more frequently in IPOs where underwriters were shareholders of the company and when they had both types of credit relationship (loans and equity) with the issuing firm. Nevertheless the numbers do not allow us to draw concrete conclusions on the nature of such capital infusions.
This research contributes to the literature by offering two new approaches to investigate the issue of conflicts of interests. So far, most studies considered stock return and bond’s default rate. To our knowledge, this is the first to apply earnings management and price support analysis to the case of concurrent deals. In addition, this study also adds to the local literature that is still far behind the vast amount of publications in the international literature.
2. Literature Review
2.1. Conflict of Interest in concurrent lending and underwriting activities
The literature in the field discusses the “pros” and “cons” of allowing such practices, but never denies the existence of Conflict of Interests. Two specific scenarios - one positive (ethical) and one negative (unethical) - could occur in the presence of concurrent lending and underwriting activities. In the first case, the lending and underwriting entity would act as a better Certifier of Quality. Banks, that have already collected important information during the due diligence process of conceding credit, would be in a better position to certify a company’s financial soundness to the market, leading to a more accurate pricing during the offer. In the desire to not lose investors confidence, these underwriting banks would select only good companies to underwrite, promoting cherries to the market. In the second case, banks would act on an attempt to transfer risk to naive investors. In situations of deteriorated loan profile, banks could underwrite securities for “bad loan” companies. In return, these companies would use part of the proceeds to pay for the outstanding loan with the bank. Instead of promoting cherries, these entities would be pushing lemons to the market.
Even though the unethical case could happen due to the nature of such business, investors and the market itself would engender its own solutions (NARAYANAN, RANGAN, and RANGAN, 2004). The main line of argumentation for a market-oriented approach is the reputational concern. In a repeated game, where underwriters conduct a series of equity offers, the incentives for cheating would be lower than in a single stage game (KATANAS and QI, 1997). Testing this hypothesis, BEATTY and RITTER (1986) find that underwriting market-share decreases in the subsequent period for those players who priced companies out of the expected pricing curve. This shows that the market punish underwriters who cheat.
involved parties. In the process of structuring loans to a specific company, banks undergo a detailed due diligence process, investigating company’s books and activities. The monitoring process that follows such deals also creates an ongoing amount of quality information that allows them to assess the company better than any other outsider. With this advantage over other players, a universal bank would be in a better position to certify the company to the market. In this case investors will buy shares of better and more accurate issues, issuing firms will get discounts on services contracted and underwriters will get more business from these firms. It is a win-win game. The empirical result of DRUCKER and PURI (2005) supports this.
If on one hand banks that perform both lending and underwriting activities have the benefit of informational economy of scope, pure investment houses face incentives to produce less information, despite potential reputation losses from “uninformed” certification (PURI, 1996). The final decision rest on investor’s hands who have to weight on a scale what is stronger: the Certification Effect or Conflict of Interests.
2.2. Empirical Evidences
The majority of studies testing conflicts of interest in universal banking were conducted using US data. Some others were conducted in different countries.
Examining ex-post data of bonds pre-Glass-Steagal Act, ANG and RICHARDSON (1994), KROSZNER and RAJAN (1994) and PURI (1994) found no evidences of moral hazard. In certain cases, bank-underwritten securities had lower default rate, undermining critics that supported the act. When analyzing ex-ante data for these bonds (initial bond yield) ANG and RICHARDSON (1994) and PURI (1996) failed again to find evidences to support conflicts of interest. On the contrary, commercial bank underwritten bonds were sold initially with lower yields, supporting the idea of better net certification effect.
create mechanisms barring internal controls failure and credibly commit against opportunistic behavior. In their findings, there was no difference in underpricing among commercial banks and investment banks. When controlling for previous credit relationship, the authors find that banks that had an outstanding loan with an issuing firm and also took the lead role in an underwriting syndicate faced 4% higher underpricing than when in the position of a co-leader. This is a clear sign that investors charge a “conflict of interest” discount in these offerings, “forcing” banks to commit with a credible underwriting syndicate.
HEBB (2008) investigated the same issue in the more relaxed Canadian market. Analyzing ex-post bond performance, the author failed to find convincing evidence to support the conflict of interest concern. The performance of bonds from the two different groups of bank was virtually identical. Also in Canada, URSEL and LJUCOVIC (1998) examined the impact of bank ownership of underwriters on the underpricing of initial public offerings. The authors find that issues from bank owned underwriters had lower underpricing when compared to pure investment houses. The author attributes the lower underpricing to the fact that major banks acquired the most reputable underwriters.
KLEIN and ZOELLER (2003) contribute with evidences from the German market. Studying short and long-term performance of IPOs underwritten by commercial banks and investment houses, the authors failed to find support for harmful effects from conflict of interests. On the long-run both groups performed equally while in the short-term commercial bank underwritten securities showed a higher underpricing. The higher discount when purchasing share might illustrate the discount that investors charge when they perceive a breach for conflicts of interests. Another empirical research that points in the opposite direction of conflicts of interest theory is the one carried out in Israel by BER, YAFEH and YOSHA (2001). In their paper, the authors find evidence of better account performance for companies underwritten by banks with which they have had previously credit relationship.
2.3. Local Scenario
SANTOS, DA SILVEIRA and BARROS (2009) studied the Brazilian IPO wave of 2004 - 2007. In their study the authors compared short-term performance (underpricing) and the long-run performance (total share return and price-to-book value) of all the IPOs at the Sao Paulo Stock Exchange (BOVESPA). The intent was to identify the effects of pre-IPO capital boost through loans and equity on firms that received them. Considering that a large breach for moral hazard was open due to concurrent deals (loans and underwriting), they elaborated the following hypothesis:
Lending operations from the underwriter to IPO firms lead to a conflict of interest that can speed up the timing of the IPO and inflate the prospects of the company to outside investors, thus leading to a higher offer price. As a consequence, these borrowing firms will underperform both in the short (with a lower underpricing) and in the long run, comparatively with other going public companies. Therefore, we expect a negative influence of loans on all post-IPO performance variables.
(SANTOS, DA SILVEIRA, and BARROS, 2009, p. 10)
When controlling for loans and equity, the results showed no impact on underpricing. For the long-run indicators, companies that received pre-IPO loan would face and additional loss of 36%, considering the 1-year total share return. But when adjusting to market, this difference disappeared. The coefficient for equity was not significant, thus not supporting their assumption of alignment of interests. Assuming this as enough evidence to name loans as opportunistic behavior, the authors ran a second regression, this time leaving the equity variable out but including the identity of each underwriter. In their second regression the numbers were mixed and apparently random. When looking at underpricing, two out of four underwriters group had significant and negative coefficients, while when looking at long-run performance the numbers were the other way around.
signaling an effort to sell lemons at inflated prices – like the authors believe – this in reality supports the theory of better certification effect. Investors, confident on the ability of universal banks being better at certifying the current state of a company, would be willing to pay more for these shares, thus leading to a lower underpricing.
In a second study, LIMA (2009) investigated the same issue of concurrent deals using different variables of analysis. The independent variables were underwriting fees and price revision during bookbuilding phase. According to the author, if the hypothesis of opportunistic loans was true, IPO deals with concurrent loan would present higher underwriting fees and lower price revision. The first means higher cost charged to compensate for reputation losses and the second an indication of lower effort from the underwriter to sell “bad papers”.
The numbers on her model were either not strong enough or open to different interpretations. In the case of underwriting fees, the model estimated a coefficient of 0.0075 for pre-IPO loans, indicating that concurrent deals led to underwriting fees 0.75% higher than cases where loans were not involved. When controlling for additional variables, this number went up to 0.0308 or 3.08%. Both coefficients had high p-values (0.166 and 0.494 respectively), not been statistically significant under conventional levels. One could argue that even if not statistically significant, the numbers are still positive, not supporting the theory of economies of scope. But only by analyzing underwriting fees and leaving the other part of the concurrent deal (loan yield) out of the equation, we cannot infer if economies of scope are really not present. As empirically tested by DRUCKER and PURI (2005), universal banks and investment banks pass these economies to their clients in different ways. While investment banks tend to charge lower underwriting fees, universal banks give discounts on loans’ yield.
investors will stop buying shares from this specific underwriter, as returns will be lower. By stating that a higher price revision on average means that the underwriter is really putting efforts on the sales side is not always true. Concurrent deals tends to generate more information about issuing firms to the underwriting bank, thus leading to a better price assessment and lower necessity for price revision. An underwriting aiming for the correct equilibrium not always has to sell it for the highest price.
2.4. Earnings Management
After addressing our considerations, we clearly think local research on this topic needs a new assessment. So far – with few exceptions - international and local researches have focused on shares returns and default rates as predictors for moral hazard. We offer a different approach to detect this kind of unethical behavior. If the Brazilian IPO frenzy was indeed permeated by opportunistic loans, we will try to capture it through an analysis of earnings management and price stabilization.
Earnings management, although not illegal, gives some freedom for managers to adjust part of the financial statement reports. Timing difference between the actual activity and the disbursement/collection of cash may vary. Examples could be the anticipation of receipts or delaying the recognition of expenses of paid services. All the differences in reported earnings and actual cash flow are accounted under accruals. The problem lies when managers exceed in the use of this mechanism and use it with other purpose. Unethical managers might inflate revenues for a given period and compensate it on the accruals account. This may happen when investors put pressure for better results or when a company is trying to get credit on the market. The IPO event is one of these tempting occasions. Due to big information asymmetry before a company goes public (RAO, 1993), issuing firms faces incentives to artificially raise reported earnings through the generous use of discretional accruals. If investors are guided by earnings to assess whether or not a company is worth buying, they will end up paying more than the company is worth. (TEOH, WELCH and WONG, 1998).
that issuing firms present higher earnings management than non-issuing firms. A caveat of this study, as highlighted by GIONELLI and CARVALHO (2008), is that by using annual data the authors might have missed the dynamics of earnings management, which might occur within the same fiscal year. Using a sample of local companies listed on the Bovespa, GIONELLI and CARVALHO (2008) found that earnings management is common around the IPO date, especially in the quarter immediately before.
2.5. Price Stabilization
Price stabilization in IPOs is a legal and regulated activity that allows underwriters to “intervene” in the secondary market to influence price movements of issued stocks. The means through which an underwriter can perform this may vary and goes from the simples “stabilizing bid”, where the underwriter place a bid close to the issues’ price, to the overallotment of stocks. In the second case, underwriters distribute more shares than the initially contracted with the issuing firm and cover its short position in a period of usually 30 days. To cover its position the underwriter has the option of buying an additional lot of stocks from the issuing firm at the issue’s price (greenshoe) or buy it in the secondary market at the current stock price (aftermarket short covering - ASC). In Brazil, regulation prevents the overallotment from being higher than the greenshoe, giving underwriters the possibility to cover its whole short position through this option. This decrease the risk the underwriter has to take and leave the ASC attractive only when the market price is below the offer price.
This discretionary power of manipulating the stock price in the secondary market raises some questions about its real intent. On one hand the underwriter may be simply trying to avoid price fluctuation due to the initial informational asymmetry and the action of flippers. On the other hand, it might be trying to manipulate an artificial high price for an overvalued stock. The first case is a legitimate intervention that adds value to the underwriting activity while the second case harm investors that end up paying more than the real price.
the findings of HANLEY, KUMAR and SEGUIN (1993), LEWELLEN (2006) and SCHULTZ and ZAMAN (1994).
HANLEY, KUMAR and SEGUIN (1993) arguments that the process of stabilization has the real intent to keep artificial high prices for overvalued stocks. After the period of intervention the prices might fluctuate again, but this time it might be confused as market movements unrelated to the stock itself. SCHULTZ and ZAMAN (1994) also add to this line of argumentation saying that underwriters act more intensively in IPOs where stocks are sold at inflated prices.
3. Data
The entire financial data set was collected from the Economatica Data Base. Information related to the offers were obtained from IPOs’ Preliminary Prospectus, Definitive Prospectus and End of Distribution Announcement accessed either through the websites of: the Brazilian Securities and Exchange Commission (CVM), the underwriter or Bovespa. From the Preliminary Prospectus we get the necessary data to calculate Price Range and Price Revision. The Definitive Prospectus contains the Offer Price, Offer Size, Underwriter’s syndicate and information concerning loans and equity stake between issuing firms and underwriters. The End of Distribution Announcement details overallotment, the after-market short covering and the allocation of shares to different investors.
The sample used on our Earnings Management Analysis consists of firm-quarter observations from 82 different IPOs (excluded Financial Firms due to different accounting system) that took place at Bovespa from 2004 to june 2008. Of these 82 IPOs, 25 involved loans made from underwriters to issuing firms and 13 cases involved underwriters owning 5% or more of equity of the issuing firm. Were considered loans from underwriters all concession of credit higher than 150.000 reais originated from one of the joint bookrunners in the last 1 year before the IPO date.
For each of these IPOs we collected 8 consecutive quarters (3 before, 1 during and 4 after the IPO date) of financial information. As it is not mandatory to disclose financial statements that far before the IPO, some observations were missing. Also, when one of the important data to calculate our proxies was missing in a specific quarter, we eliminated it from the sample. Of a total of 656 possible firm-quarter observations we ended up with 513.
4. Earnings Management Analysis
4.1. Hypothesis
The purpose of this study is to cast some light over the pre-IPO capital boost many of the going public companies have received in Brazil. Be it through loans or through equity participation, we want to investigate the nature of this capital infusion. Previous discussed articles have named these loans as of an opportunistic nature.
It is not very likely that underwriters in Brazil, some of whom have great international reputation, would risk engaging in such opportunistic activities just for a few more underwriting business. As an instrument with sort of a fixed income return, loans do not create a strong incentive for cheating. On the other hand, variable instruments like equity rewards the underwriter on the upside, creating more incentives for opportunistic behavior.
In order to capture the essence of such capital infusions, one of our analysis will investigate earnings management on all IPOs listed on Bovespa during the period of 2004 -June 2008. We believe that firms and underwriters that act in an unethical manner trying to mislead investors have a high probability to manage issuing companies’ financial statements. In that sense we elaborate our first hypothesis as follows:
H1: Loans conceded by underwriters to issuing firms are positively correlated to the level of discretionary current accruals of these firms.
In case hypothesis 1 is not accepted, we have good evidence to reject the opportunistic loan argument.
more incentives to engage in unethical behaviors than loans. Having said that, we elaborate our second hypothesis as follow:
H2: Underwriters’ equity stake in issuing firms is positively correlated to the level of discretionary current accruals of these firms.
In case our second hypothesis is not accepted, we do not have evidences to support the conflict of interest theory.
4.2. Calculating Discretionary Current Accruals
In this study, our proxy for opportunistic behavior on earnings management will be discretionary current accruals. As current accruals are normal during the day-to-day activity of a company, we cannot infer that all variation of this account means earnings manipulation. Therefore, to the purpose of our analysis, we will split total current accruals into two distinct types: expected current accruals (the normal day-to-day accruals) and discretionary current accruals, which is the portion of total accruals artificially constructed by managers. In order to calculate our variable of interest –
discretionary current accruals – we will first calculate total current accrual and the
expected current accrual. The first minus the second will give us our proxy.
To define total current accruals we use the same method as in TEOH, WELCH and WONG (1998) and GIONELLI and CARVALHO (2008). Extracting data from two consecutively balance sheets total current accruals for firm i at time t is:
(A1)
where:
, is the Total Current Accrual of firm i at time t
, is the current assets of firm i at time t, excluding cash
To calculate expected current accrual we follow the same routine as in GIONELLI and CARVALHO (2008). Three different models are used to estimate this variable. They are the Jones Model (JONES, 1991) and two other modified versions of it: the Modified Jones and Modified Jones with ROA (KOTHARI, LEONE, and WASLEY, 2005).
Jones Model
(A2)
Modified Jones Model
(A3)
Modified Jones Model with ROA
(A4)
where:
is the total current accrual of firm i at time t is the lagged total asset of firm i;
is the net operating revenues of firm i at time t; is the trade receivables of firm i at time t;
is the return on assets of firm i at time t.
Seasoned Equity Offering (SEO); d) firms that had missing data for the specific quarter; and e) outliers in the 1st and 99th percentile of Total Current Accrual.
The previous step yields the necessary coefficients to estimate the
expected current accruals for our sample companies. For each firm-quarter observation we replace them in the three different Jones Model using our sample firm data on it.
For the simple Jones Model:
(A5)
This yields the expected current accrual for each of our sample companies at each quarter. To finally calculate our proxy – discretionary current accrual – for firm
i¸at time t we subtract the expected current accrual calculated in (A5) - in the case of the Jones Model - from total current accrual (A1)scaled by lagged total assets.
(A6)
4.3. Methodology
Our regression models will try to capture the influence of pre-IPO capital infusion - be it through equity or loan - on the level of earnings management of each firm. Theoretically, companies seeking to mislead investors will present a higher level of earnings management (discretionary current accrual) than its ethical peers. If the use o pre-IPO capital boost is indeed a sign of opportunistic behavior, they will be positively correlated with the level of earnings management.
(B1)
where:
i stands for each firm
t for each quarter
is the discretionary current accrual of firm i at quarter t
and “C” will assume the following control variables:
VC: a dummy variable that will assume the value of 1 if the issuing firm if backed by a venture capitalist and 0 otherwise.
Auditor: a dummy variable that assumes the value of 1 when the company has been audited by one of the big four auditing companies and 0 otherwise.
Underwriter: Is the Carter-Manaster index elaborated by CARTER and MANASTER (1990) that ranks underwriters based on its reputation. We are going to use the updated version by LOUGHRAN and RITTER (2004). The list can be accessed at http://bear.warrington.ufl.edu/ritter/ipodata.htm
Size: Size of the firm calculated as natural logarithm of Total Asset:
Growth: Revenue Growth:
Leverage: calculated at time t as:
ROA: return on assets between quarters t-1 and t.
SEO: dummy variable that assumes the value of 1 if the firm has conducted a Seasoned Equity Offering subsequent to the IPO and 0 otherwise.
The variable of interest is loan and equity and their coefficients and .
Loan is a dummy variable that will assume the value of 1 if the underwriter lent money to the issuing firm one year or less before the IPO and 0 otherwise and equity
underwriter. If it is not statistically significant, than pre-IPO loans and equity have no impact on earnings management.
Controls variables have the same specification as in GIONELLI and CARVALHO (2008). Venture Capital, Auditor and Underwriter reputation are used to control for the ability of key external agents in hampering earnings management.
Size will control for the level of financial asymmetry (where bigger firms are more closely followed by market analysts) and the complexity of financial statements.
Revenue Growth controls for the imprecision of Discretionary Current Accrual estimation models, as high growth companies tend to have larger accruals account.
Leverage takes into account the fact that high leveraged firms might be closer monitored by their creditors but also face higher incentives to manipulate financial statements in order to comply with contractual covenants. ROA controls for the possible bias in case current accruals are correlated with firms performance. Finally
SEO control for the incentives a firm has to manipulate its earnings during a seasoned equity offering.
In order to deepen our analysis, we also check the impact of loans and equity in different periods of time. To accomplish this, each IPO is divided in four distinct phases: Pre-IPO, IPO, Lock-up and Post-IPO. Each of these phases is formed by 2 consecutive quarters. In the IPO period we have quarter 0 (the quarter in which the IPO took place) and -1 (the one immediately before). Following the same pattern, Pre-IPO, Lock-up and Post-IPO phases incorporate quarters (-3 & -2), (1 & 2) and (3 & 4) respectively. This gives us a maximum of eight quarters observation per companies in case all financial statements are available.
To evaluate the impact of loan and equity in this temporal dimension, we create interactive variables between each of the four phases’ dummies and loans and equity dummies. Models (B2) and (B3) incorporate these variables as follow:
(B2) (B3)
where:
nstands for each of the four different phases: Pre-IPO, IPO, Lock-UP and Post-IPO i for each firm
tfor each quarter
and “C” for the same control variables as in model (B1)
In these last two models we verify if there is one of the four phases where loans or
equity really makes an impact on the level of discretionary current accrual.
4.4. Empirical Findings
4.4.1. Mean comparison
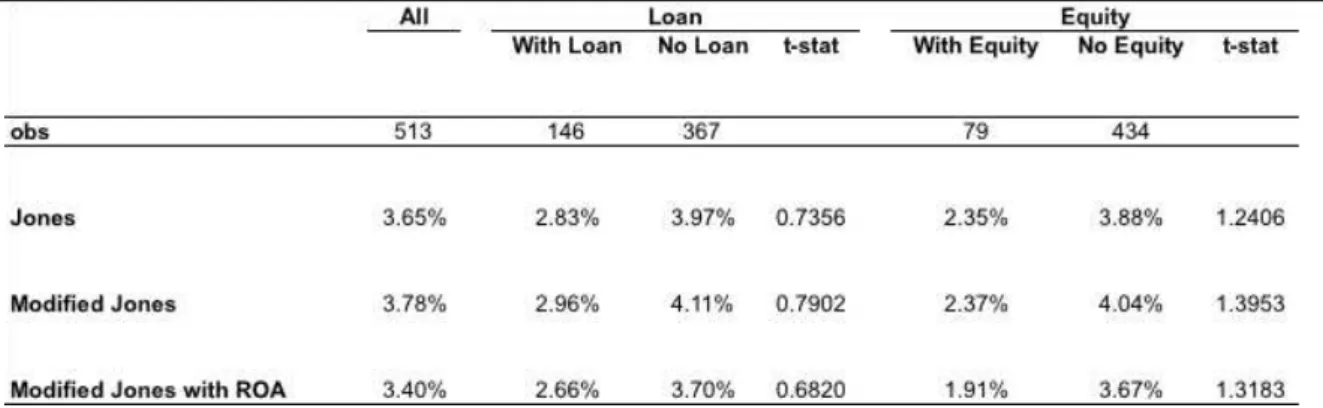
Table 1 shows the mean comparison for discretionary current accruals calculated using the three different models: Jones, Modified Jones and Modified Jones with ROA. The means are also grouped according to our variables of interests:
Table 1: Discretionary Current Accrual - Mean Comparison
This table presents mean tests for the level of earnings management of a sample of 82 IPO firms going public at Bovespa from January/2004 to July/2008, totalizing 513 firm-quarter observations. Discretionary current accruals (in % of lagged total assets), was used as proxy for the level of earnings management andcalculated using the Jones, Modified Jones and Modified Jones with ROA models. The t statistics refer to the test of the null hypothesis of no difference between the mean.
*, ** and *** denote significance at the 10%, 5% and 1% levels (for two-tailed tests), respectively.
Contrary to earlier findings on the Brazilian scenario, this mean comparison does not point for opportunistic behavior in neither case. Actually it shows that both groups containing capital infusion (loan and equity) present lower level of earnings management than their peers. All three models used to calculate the discretionary current accrual presented similar level of earnings manipulation, with the lowest number predicted by the Modified Jones with ROA, the one that also uses more control variables.
4.4.2. Regression Models
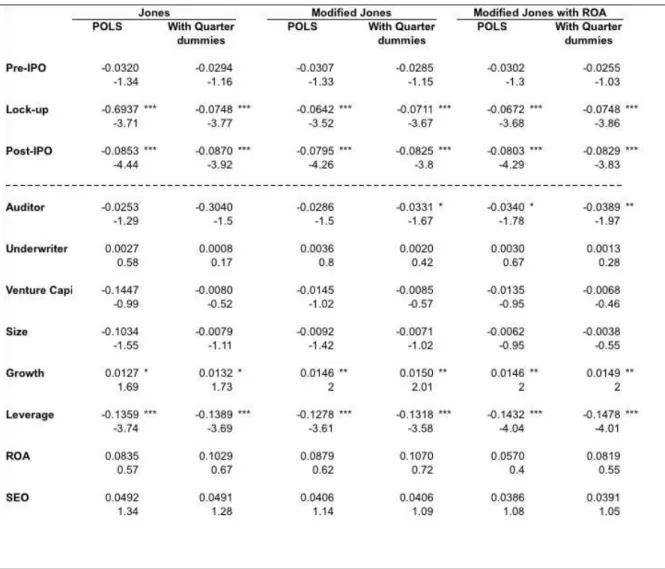
Table 2 reports the results of our regression used to measure the differences in earnings management between periods. As evidenced by earlier authors, companies have an increased stimulus to manipulate earnings right before the IPO, increasing the firm’s value in the prospectus. The result corroborates that, since earnings manipulation on the subsequent periods after the IPO is significantly lower than the periods before it.
Table 2: Earnings Management Regression - Differences between IPO Phases This table presents panel regressions for the level of earnings management in a sample of 82 IPO firms going public at Bovespa from January/2004 to July/2008. The dependent variable is the discretionary current accruals (in % of lagged total assets) for firm i in the quarter t (DCAi,t), calculated using the Jones, Modified Jones and Modified Jones with ROA models. The independent variables are described in Section 4.3. The tests use Pooled OLS. t statistics heteroskedastic-consistent by White (1980) are shown bellow coefficients. The total number of observations is 513 firm-quarters.
In order to avoid perfect co linearity the regression omitted the variable representing the phase in which the IPO took place (IPO Phase). In this sense, all variables representing each of the three other phases (Pre-IPO, Lock Up and Post-IPO) should be analyzed relatively to the IPO one. The negative signal on all of them indicates that discretionary current accrual in those periods are lower than in the IPO one. The coefficients for the subsequent periods after the IPO are strongly significant, clearly indicating that companies in general do manipulate their financial statements in order to give them better financial soundness.
Some variables used to control also showed significant impact on the level of earnings management. Apparently, the reputation of the auditor does mitigate the level of earnings manipulation of a company. On all the 6 regressions the coefficient signal was negative, showing statistical significance on the last three ones. When considering the most significant case, high reputation auditors decrease in 3.9% the level of earnings management of a company. Growth also impact on the level of
discretionary current accrual. As expected, the signal is positive for this control variable, meanings that companies that experience high growth of revenues do tend to use their accruals more generously. The leverage ratio of the company also post strong results on earnings manipulation. With a negative signal, this means that the higher the leverage of the firm, the lower its use of discretionary accruals. This might be linked to the close monitoring exerted by banks and financial institutions that lent to the company.
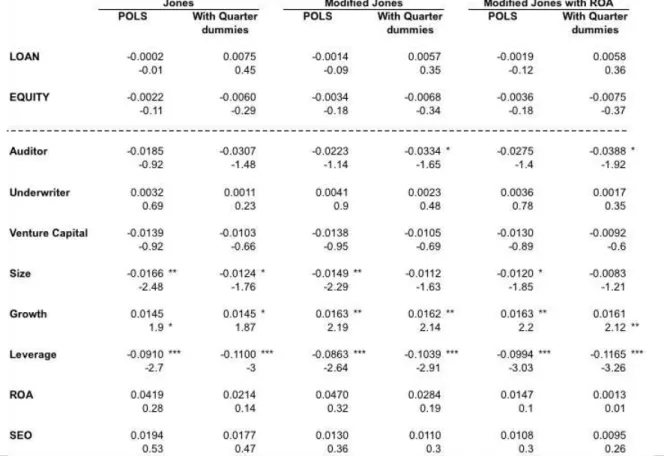
Table 3 gets to the point we are interested in this study. It shows the impact of
loans and equity on the level of earnings management. The same controls variables are used and the phases of the IPO omitted.
Table 3: Earnings Management Regression (B1) - Influence of loans and equity on discretionary current accruals
This table presents panel regressions for the level of earnings management in a sample of 82 IPO firms going public at Bovespa from January/2004 to July/2008. The regression model is specified in (B1). The dependent variable is the discretionary current accruals (in % of lagged total assets) for firm i in the quarter t (DCAi,t), calculated using the Jones, Modified Jones and Modified Jones with ROA models. The independent variables are described in Section 4.3. The tests use Pooled OLS. t statistics heteroskedastic-consistent by White (1980) are shown bellow. The total number of observations is 513 firm-quarters.
*, ** and *** denote significance at the 10%, 5% and 1% levels (for two-tailed tests), respectively.
What is different in this third table is the appearance of Size also as a determinant of earning manipulation. In four out of six regressions this variable presented significant and negative influence on the dependent variable. This means that bigger firms, more closely followed by analysts, are less likely to engage in such opportunistic behavior.
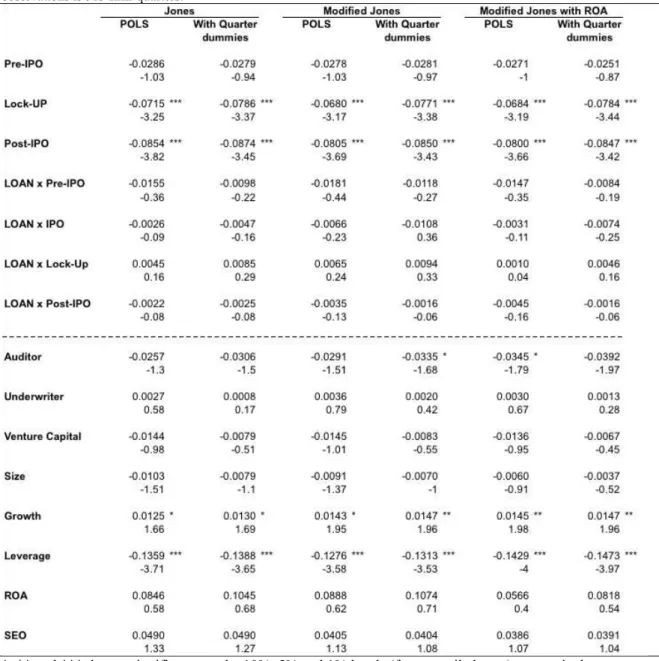
discretionary accrual - firms with credit relationship with their underwriters do tend to perform on a different way than their peers.
Table 4: Earnings Management Regression (B2) - Influence of loans in different phases of the IPO
This table presents panel regressions for the level of earnings management in a sample of 82 IPO firms going public at Bovespa from January/2004 to July/2008. The regression model is specified in (B2). The dependent variable is the discretionary current accruals (in % of lagged total assets) for firm i in the quarter t (DCAi,t), calculated using the Jones, Modified Jones and Modified Jones with ROA models. The independent variables are described in Section 4.3. The tests use Pooled OLS. t statistics heteroskedastic-consistent by White (1980) are shown bellow coefficients. The total number of observations is 513 firm-quarters.
*, ** and *** denote significance at the 10%, 5% and 1% levels (for two-tailed tests), respectively.
None of the interactive dummies presented significant coefficients at conventional levels. As in Table 3 their coefficient signal is negative, supporting an inverse correlation between these loans and the opportunistic behavior of earnings management.
Table 5: Earnings Management Regression (B3) - Influence of equity in different phases of the IPO
This table presents panel regressions for the level of earnings management in a sample of 82 IPO firms going public at Bovespa from January/2004 to July/2008. The regression model is specified in (B3). The dependent variable is the discretionary current accruals (in % of lagged total assets) for firm i in the quarter t (DCAi,t), calculated using the Jones, Modified Jones and Modified Jones with ROA models. The independent variables are described in Section 4.3. The tests use Pooled OLS. t statistics heteroskedastic-consistent by White (1980) are shown bellow coefficients. The total number of observations is 513 firm-quarters.
*, ** and *** denote significance at the 10%, 5% and 1% levels (for two-tailed tests), respectively.
reputation, have the expected sign on our models. Apart from Auditor, Size, Growth
and Leverage that were already discussed, Venture Capitalist, ROA and SEO
behavior was as expected. Venture Capitalist / Private Equity had negative correlation with earnings management, supporting the idea that to a certain degree these agents are effective on mitigating earnings management. ROA carries a positive correlation with earnings management, evidencing the link between firm’s performance and discretionary accruals. Lastly, SEO has a positive sign, meaning that companies that are preparing for a seasoned equity offer also tend to manipulate their earnings. Nevertheless, it is important to say that of these last three variables (VC, ROA and SEO) none presented statistically significant numbers.
5. Price Stabilization Analysis
5.1. Hypothesis
To strengthen our research, we will employ a second method of analysis on an attempt to capture the likelihood of opportunistic behavior. Investigating the price stabilization period will give us some idea on the nature of the underwriter’s intentions. Underwriters trying to overprice lemons will put more efforts on the stabilization period of these issues. The reason behind this is to prevent a strong price decline after the IPO, what could damage the reputation of the underwriting bank. In order to assess the intention of underwriters during the IPO stabilization period, we will investigate price stabilization in three different ways: a) the occurrence of stabilization, b) the intensity of the stabilization and c) the price level achieved during the stabilization period.
First, we want to know if the presence of credit relationship between underwriters and issuing firms is determinant to the occurrence of the stabilization. If yes, it is possible that these issues are being permeated by opportunistic behavior. In order to test this, we propose the two following hypotheses:
H3: IPOs of firms that received loans from their underwriters are more likely to be stabilized than IPOs of firms that did not receive such loans.
H4: IPOs of firms in which underwriters have a significant equity stake are more likely to be stabilized than IPOs of firms in which they do not.
H5: IPOs of firms that received loans from their underwriters present higher intensity of price stabilization than IPOs of firms that did not receive such
loans.
H6: IPOs of firms in which underwriters have a significant equity stake presents higher intensity of price stabilization than IPOs of firms in which they
do not.
While the intensity of the stabilization may be an indicator of opportunistic behavior, an analysis of the short-term returns after the stabilizing period will give us a better understanding on the stabilized price level. If the short-term returns after this period are negative, we have evidence to suspect that the stock price was kept inflated during the stabilization process. This leads us to our seventh and eight hypotheses:
H7: IPOs of firms that received loans from their underwriters are stabilized at
artificial high prices, thus presenting negative returns after the stabilization
period.
H8: Firms in which underwriters have a significant equity stake are stabilized at
artificial high prices, thus presenting negative returns after the stabilization
period.
5.2. Methodology
Hypotheses 3 to 8 will be tested in pairs by three different models. The first of these models will assess the impact of loan and equity on the likelihood of price stabilization being conducted by the underwriter. The second will measure the impact loan and equity have on the intensity of such stabilization and the third will check the impact on the stabilized price level.
The models are the same used in (PINHEIRO and CARVALHO, 2008) with the inclusion of dummies for loan and equity.
To test hypotheses 3 and 4:
(C1) (C2)
where the dependent variables is:
Occurrence of Stabilization: a dummy that assumes value of 1 if stabilization occurred and 0 otherwise.
and “C” will assume the following control variables:
Size: logarithm of the offer size.
Gross spread: underwriters commission in percentage.
Underwriter: Is the Carter-Manaster index elaborated by CARTER and MANASTER (1990) that ranks underwriters based on its reputation. We are going to use the updated version by LOUGHRAN and RITTER (2004). The list can be accessed at http://bear.warrington.ufl.edu/ritter/ipodata.htm
Price: issue stock price.
Price Range: the difference between the maximum and minimum price during bookbuilding phase divided by the mean price.
Price Revision: relation between the issue stock price and the mean value of the price range.
Average lot size: The mean of lot size acquired by institutional investors, foreigner investors and ordinary investors.
Number of investors: The number of institutional investors, foreigner investors and ordinary investors.
(C3) (C4)
where
Intensity of Stabilization is calculated as . The reason between Aftermarket Short Covering and Overallotment shows how much of the Overallotment the underwriter decided to cover in the secondary market. The more the underwriter intervenes in the secondary market, the higher is the impact on the price level.
and “C” are the same control variables as in model (C1) and (C2).
As can be seen from the formula of each dependent variable, their characteristics are distinct. While occurrence of stabilization is a binary variable, intensity can assume any value between 1 and 0 respectively. Due to this difference, equations (C1) and (C2) will be estimated using a probit model while (C3) and (C4) will be estimated through tobit. The controls used are for demand (lot size, number of investors), riskiness (size, gross spread, price, price range and price revision) and
reputation of the underwriters (Carter-Manaster index).
To test hypotheses 7 and 8 we run the same model used in (PINHEIRO and CARVALHO, 2010), with the addition of our variables of interest.
(C5) (C6)
where:
Return , = cumulative return from to =
Size: logarithm of the offer size.
Price Deviation: relation between the issue stock price and the mean value of the price range.
Market Return for the same period
Underwriter Syndicate: Number of underwriters
Underwriter: Is the Carter-Manaster index elaborated by CARTER and MANASTER (1990) that ranks underwriters based on its reputation. We are going to use the updated version by LOUGHRAN and RITTER (2004). The list can be accessed at http://bear.warrington.ufl.edu/ritter/ipodata.htm
Stabilization: dummy variable that assumes value 1 if stabilization occurred and 0 otherwise
These last two equations allow us check if after the stabilization period ends the price declines or maintains at the stabilized level. indicates the date the stabilization period ended and the date chosen to measure short-term returns.
Finally the last two regressions is just a variation of (C5) and (C6) with the addition of an interactive variable between stabilization and loan and equity.
(C7) (C8)
5.3. Empirical Findings
5.3.1. Loans
The first of our variables of interest to be analyzed on the three different price stabilization models is loan. Tables 6, 7, 8 and 9 report the results of our regressions for it.
Table 6 shows us if loans have any impact on the likelihood of an underwriter conducting a stabilization of prices after the IPO. On all seven regressions the loan
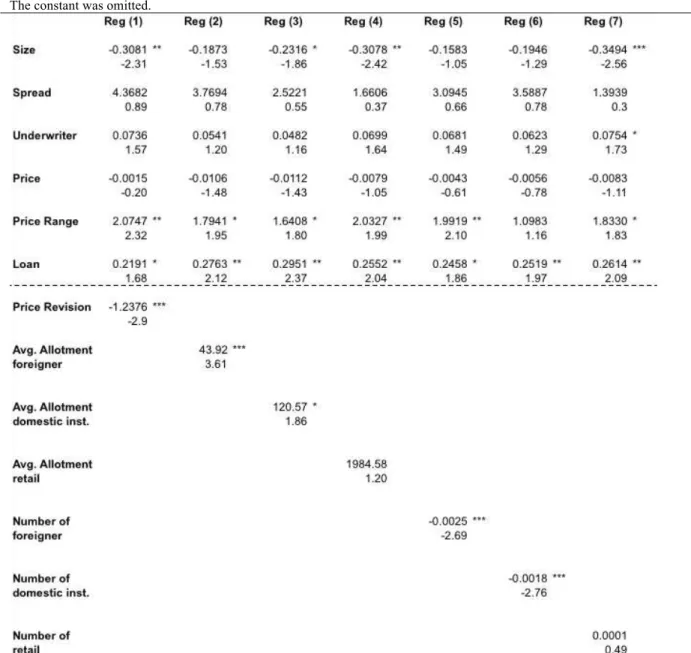
Table 6: Determinants of Stabilization (C1) - loan impact
The dependent variable takes value 1 when stabilization occurs and 0, otherwise. Probit regression is based on the following model: Occurrence of Stabilization = β1 + β2 LOAN + β3 Size + β4 Spread + β5 Underwriter + β6 Price + β7 Price Range + β8 PriceRevision +β9 Average allotment + β10 Number of Investors. Reported values are marginal effects. The explanatory variables are Size: the natural logarithm of the final offering value in reais; Spread: gross spreads as percentage of the offer price; Price:the offer price; Price Range: the difference between the maximum and minimum price in initial filling range divided by the midpoint of the filling range; Price Revision: the offer price minus the midpoint of the initial filling range normalized by the midpoint of the initial filling rage; Average allotment to foreign, institutional domestic and retail investors: average amount allocated toforeign,institutional domestic and retail investors normalized by the issue size; and Number of foreign, institutional domestic and retail investors: number of investors in each category that received shares in the IPO. The estimators were calculated using the robust matrix of covariate. T-Statisticis reported below marginal effects. The constant was omitted.
*, ** and *** denote significance at the 10%, 5% and 1% levels (for two-tailed tests), respectively.
conclusion: price stabilization occurs more frequently in IPOs with higher risk, lower demand and conducted by underwriters with good reputation. Risk variables as size
(negative and significant), price range (positive and significant) and gross spread
(positive) all indicates to a positive correlation between risk and the likelihood of price stabilization. Demand variables as average allotment (positive and significant) and
quantity of investors (negative and significant) corroborate the idea of negative correlation between demand and stabilization. Lastly, the variable underwriter’s reputation (positive and marginally significant) reflects the idea that reputable underwriters conduct price stabilization more frequently.
Hypothesis 3 cannot be rejected based on these numbers.. Nevertheless, it is not safe to draw earlier conclusions before we have a look at the intensity of the stabilization and the price level at which it was stabilized.
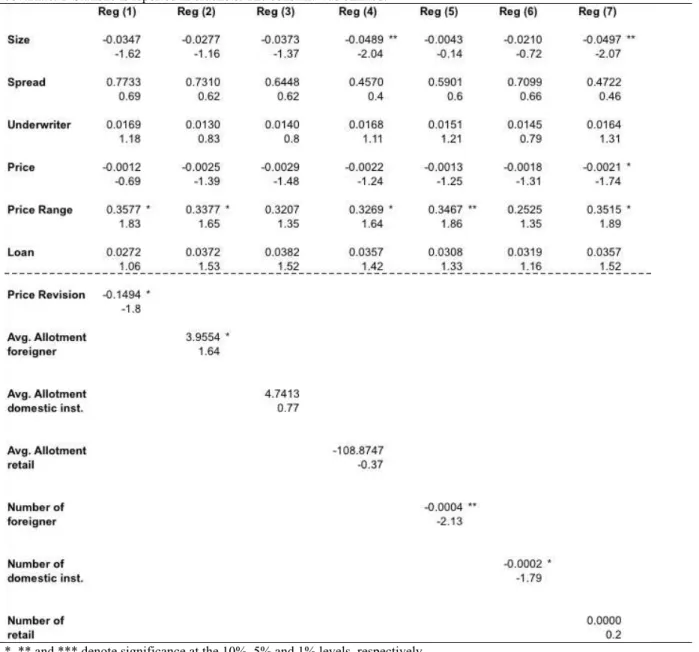
Table 7 displays the numbers of our model for Determinants of Stabilization´s Intensity. Different from the previous model, loans do not seem to influence the
intensity with which underwriters act on the secondary market. Although the marginal
effect is positive, it is not significant at conventional statistical levels (it is marginally
in some regressions).
Control variables assume similar values to PINHEIRO and CARVALHO
(2008), where intensity is correlated with higher ex-ante risk and lower demand. In
this case, contrary to what we found on the probability of occurrence, underwriters’
reputation do not play an important role. Variables related to risk like size (negative
and significant), gross spread (positive) and price range (positive and significant) all
indicate a positive correlation between risk and intensity. Demand variables as
average allotment (negative and significant) and quantity of investors (positive and
significant) points to a negative correlation between intensity and demand (especially
of foreigners investors).
Hypothesis 5 cannot be accepted indicating that loans made by underwriters
Table 7: Determinants of Stabilization's Intensity (C3) - loan impact The dependent variable is ratio of the number of shares repurchased during the stabilization to the overallotment. Tobit estimations are based on the following model: Intensity of Stabilization = β1+ β2 LOAN + β3 Size + β4 Spread + β5
Underwriter + β6 Price + β7Price Range + β8 Price Revision +β9 Average allotment +β10 Number of Investors. Reported
values are marginal effects. The explanatory variables are Size: the natural logarithm of the final offering value in reais;
Spread: gross spreads as percentage of the offer price; Price:the offer price; Price Range: the difference between the maximum and minimum price in initial filling range divided by the midpoint of the filling range; Price Revision: the offer price minus the midpoint of the initial filling range normalized by the midpoint of the initial filling rage; Average allotment to foreign, domestic institutional and retail investors: average amount allocated to foreign, institutional domestic and retail investors normalized by the issue size; and Number of foreign, domestic institutional and retail investors: number of investors in each category that received shares in the IPO. The estimators were calculated using the robust matrix of covariate. T-Statisticis reported in brackets. The constant was omitted.
*, ** and *** denote significance at the 10%, 5% and 1% levels, respectively.
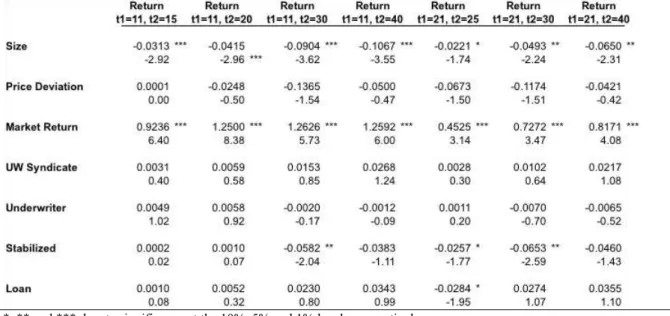
Lastly, to test hypothesis 7 we made an analysis of the short-term returns after
the end of the stabilization period. The results of this analysis can be seen in Table 8
and 9. Table 8 shows the impact of loans on the short-term returns. From the
returns lower than the other offers. In one of the windows analyzed ( = 21, = 25)
concurrent deals do show a negative return, but is reversed later.
Table 8: Post-Stabilization short-term returns for IPOs with outstanding loans (C5)
Post-stabilization short-term analysis. The dependent variable is the cumulative return between to closing price on dates e
. The independent variables are: Size: the natural logarithm of the final offering value in reais; Price Revision: the offer price minus the midpoint of the initial filling range normalized by the midpoint of the initial filling rage: Market return between date and ; Syndicate: number of underwriters running the offer; Underwriter: Is the Carter-Manaster index that ranks underwriters based on its reputation; stabilization: binary variable if stabilization occurred. The estimators were calculated using the robust matrix of covariate. T-Statisticis reported below marginal effects. The constant was omitted.
*, ** and *** denote significance at the 10%, 5% and 1% levels, respectively.
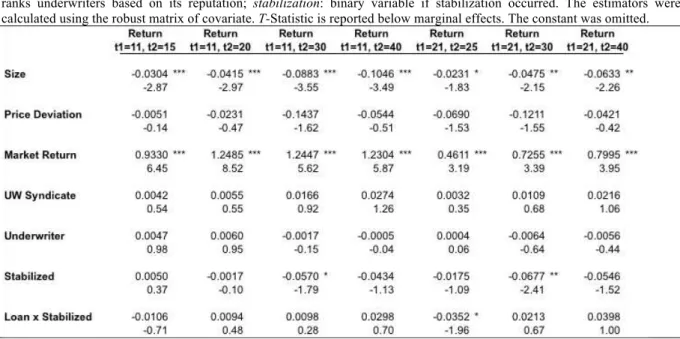
In Table 9 we replace the variable of interest. While Table 8 has loan as our
variable of interest, Table 9 has an interactive variable between loan and
stabilization. This makes it possible to analyze the price level at which the
underwriter stabilized such IPOs. The result is very similar to Table 8, and shows
relevance in one of the windows studied, something that is reversed later. Thus we
have no evidence to conclude that IPOs with the presence of loans are stabilized at
artificial high prices, rejecting hypothesis 7.
For the next two subsections (equity and concomitant loan and equity), control
variables assume similar significance and can be interpreted the same way we did in
the loan analysis. To avoid repetitiveness, we will interpret results only for our
Table 9: Post-Stabilization short-term returns for IPOs with outstanding loans (C5)
Post-stabilization short-term analysis. The dependent variable is the cumulative return between to closing price on dates e
. The independent variables are: Size: the natural logarithm of the final offering value in reais; Price Revision: the offer price minus the midpoint of the initial filling range normalized by the midpoint of the initial filling rage: Market return between date and ; Syndicate: number of underwriters running the offer; Underwriter: Is the Carter-Manaster index that ranks underwriters based on its reputation; stabilization: binary variable if stabilization occurred. The estimators were calculated using the robust matrix of covariate. T-Statisticis reported below marginal effects. The constant was omitted.
*, ** and *** denote significance at the 10%, 5% and 1% levels, respectively.
5.3.2. Equity
Tables 10, 11, 12 and 13 reproduce the same analysis as the previous four
tables, the difference being equity instead of loan as the variable of interest.
Table 10 shows the impact equity has as a determinant of the stabilization
process. As with loans, the ownership of issuing firm’s equity by the underwriter
increases the likelihood the later will stabilize prices. On all seven regressions the
variable equity assume positive and statistically significant values, validating
Table 10: Determinants of Stabilization (C2) - equity impact
The dependent variable takes value 1 when stabilization occurs and 0, otherwise. Probit regression is based on the following model: Occurrence of Stabilization = β1 + β2 EQUITY + β3 Size + β4 Spread + β5 Underwriter + β6 Price + β7 Price Range + β8 PriceRevision +β9 Average allotment + β10 Number of Investors. Reported values are marginal effects. The explanatory variables are Size: the natural logarithm of the final offering value in reais; Spread: gross spreads as percentage of the offer price; Price:the offer price; Price Range: the difference between the maximum and minimum price in initial filling range divided by the midpoint of the filling range; Price Revision: the offer price minus the midpoint of the initial filling range normalized by the midpoint of the initial filling rage; Average allotment to foreign, institutional domestic and retail investors: average amount allocated toforeign,institutional domestic and retail investors normalized by the issue size; and Number of foreign, institutional domestic and retail investors: number of investors in each category that received shares in the IPO. The estimators were calculated using the robust matrix of covariate. T-Statisticis reported below marginal effects. The constant was omitted. The sample consists of the 105 IPOs for which there was overallotment.
*, ** and *** denote significance at the 10%, 5% and 1% levels, respectively.
In the case of stabilization’s intensity, the results in Table 11 validates
hypothesis 6: equity ownership does seem to improve the intensity with which
underwriters conduct the stabilization process. On all seven regressions the
Table 11: Determinants of Stabilization's Intensity (C4) - equity impact The dependent variable is ratio of the number of shares repurchased during the stabilization to the overallotment. Tobit estimations are based on the following model: Intensity of Stabilization = β1+ β2 EQUITY + β3 Size + β4 Spread + β5
Underwriter + β6 Price + β7Price Range + β8 Price Revision +β9 Average allotment +β10 Number of Investors. Reported values are marginal effects. The explanatory variables are Size: the natural logarithm of the final offering value in reais;
Spread: gross spreads as percentage of the offer price; Price:the offer price; Price Range: the difference between the maximum and minimum price in initial filling range divided by the midpoint of the filling range; Price Revision: the offer price minus the midpoint of the initial filling range normalized by the midpoint of the initial filling rage; Average allotment to foreign, domestic institutional and retail investors: average amount allocated to foreign, institutional domestic and retail investors normalized by the issue size; and Number of foreign, domestic institutional and retail investors: number of investors in each category that received shares in the IPO. The estimators were calculated using the robust matrix of covariate. T-Statisticis reported in brackets. The constant was omitted.
*, ** and *** denote significance at the 10%, 5% and 1% levels, respectively.
Finally, Tables 12 and 13 analyze the post stabilization returns of all IPOs