BRÁULIO ROBERTO GONÇALVES MARINHO COUTO
USO DA ÁLGEBRA LINEAR PARA ANÁLISE DE
SIMILARIDADES E EXTRAÇÃO DE PADRÕES EM
SEQUÊNCIAS PROTÉICAS
Belo Horizonte
UNIVERSIDADE FEDERAL DE MINAS GERAIS
PROGRAMA DE PÓS-GRADUAÇÃO EM BIOINFORMÁTICA
BRÁULIO ROBERTO GONÇALVES MARINHO COUTO
USO DA ÁLGEBRA LINEAR PARA ANÁLISE DE
SIMILARIDADES E EXTRAÇÃO DE PADRÕES EM
SEQUÊNCIAS PROTÉICAS
Tese apresentada ao Programa de
Pós-graduação
em
Bioinformática
da
Universidade Federal de Minas Gerais
como requisito parcial para a obtenção do
título de Doutor em Bioinformática.
Orientador
Prof. Dr. Marcos Augusto dos Santos
Departamento de Ciência da Computação, Instituto de Ciências Exatas – ICEx, Universidade Federal de Minas Gerais – UFMG, Belo Horizonte – MG.
Co-Orientador
Prof. Dr. Marcelo Matos Santoro
Laboratório Marcos Luiz dos Mares-Guia de Enzimologia e Físico-Química de Proteínas, Departamento de Bioquímica-Imunologia, Instituto de Ciências Biológicas – ICB,
“Since the measuring device has been constructed by the observer … we have to remember that what we observe is not the nature itself but nature exposed to our method of questioning.”
Physics and Philosophy [1958]
Agradecimentos
Finalmente, estou terminando o meu doutorado. E tenho muito a agradecer! A minha jornada vem de longa data... para falar a verdade, preciso começar pela minha iniciação científica. Aos professores Eucler Paniago, Sandra Carvalho e Frederico Campos, muito obrigado por toda a orientação recebida. Ao amigo Hélio Duarte, pelo companheirismo. As decisões da minha vida profissional foram sustentadas, definidas conforme os ensinamentos que recebi de vocês durante a minha iniciação científica. Em especial, agradeço ao professor Frederico Campos: são mais de vinte e cinco anos de orientação!
Viajando no tempo, preciso agradecer aos companheiros da minha vida “hospital e controle de infecções”. Novamente, é longa a convivência... 20 anos para ser mais exato! Agradeço à amizade e ao apoio durante o tempo em que fiz especialização, mestrado e agora doutorado. Quanta coisa prometi fazer após o doutorado: reconstruir o SACIH é o mínimo! Carlos, Silma, Edna, Estevão, Raquel, José Antônio, Mônica, Hoberdan, Izabella, Karina, Fernanda, Nilza, Rose, Glorinha, Malu, Áurea, Isabel, Simone, Rafaela, Mariana, Clara, Jussara, Roberta, Helena, Hérika, Marilaine.
Quanto ao UNI-BH, são mais de 10 anos, dia-a-dia, vida pessoal e profissional no mesmo ambiente! Obrigado professoras Raquel Parreiras e Sueli Baliza! Muito obrigado, Miriam, Magali, Diva, Ana Paula e Sandra: conviver com vocês é um privilégio, uma honra.
Na FASEH, são mais de cinco anos de trabalho. O apoio incondicional do professor Assuero é outro privilégio que disponho.
Voltando ao doutorado, preciso agradecer muito ao amigo, professor e orientador Marcos Augusto dos Santos. Ele é o responsável por me trazer para esta coisa incrível chamada Bioinformática e por me mostrar toda a poesia, o poder da SVD. Eu realmente fui transformado ao longo deste aprendizado. Muito obrigado por esta oportunidade! Por meio da Bioinformática eu consegui me encontrar profissionalmente. Finalmente entendi porque estudei Engenharia Química, Estatística e Ciência da Computação.
Pessoalmente, agradeço a Deus por ter me dado saúde. E, depois de estudar Bioquímica, Genética, Genoma, Proteoma e Transcriptoma posso afirmar categoricamente: não há como afirmar que Ele não exista. A complexidade da vida, a simplicidade e universalidade do código genético, não dá para aceitar que tudo isto seja resultado de um processo estocástico de longo prazo. E as leis da Física, as estrelas, o universo. Haja aleatoriedade! Em suma, obrigado Senhor, o maior programador, criador do programa principal e das subrotinas mais importantes da vida: o genoma e os genes.
Aos meus pais, Roberto e Dirce, aos meus irmãos Bruno, Robson e Cristiano: obrigado por acreditarem em mim!
À minha filha Luiza, adorável, carinhosa, “cuidadeira de quem ama”, admirável, amorosa, dedicada ao extremo a tudo que faz. Muito obrigado: acompanhar o seu crescimento é uma dádiva. Conviver com você me faz sentir eterno!
Gostaria de terminar estes agradecimentos enaltecendo a minha mulher Ana Paula. É a pessoa mais incrível que conheço! A sua inteligência, aliada à sua sensibilidade a tornaram especial. Não conheço ninguém tão brilhante, com tamanha capacidade de síntese e, ao mesmo tempo, tamanha dedicação aos seus. Haja entropia... e isto é ótimo! Preciso te agradecer por ter me incluído na sua vida. Muito obrigado meu amor.
Sumário
Introdução ... 11
Justificativa ... 13
Objetivos ... 17
Resultados... 18
Capítulo 1 – Decomposição em valores singulares (SVD) e BLAST: diferentes métodos produzindo resultados semelhantes ... 20
Capítulo 2 – Aplicando decomposição em valores singulares para a análise de similaridades de sequências sem múltiplos alinhamentos caractere-a-caractere ... 28
Capítulo 3 – Revelando processos biológicos por meio de Álgebra Linear: extraindo padrões de dados com ruído ... 46
Capítulo 4 – Usando modelos de regressão logística e decomposição em valores singulares para a seleção de atributos importantes para classificação de sequências protéicas ... 52 Capítulo 5 – Sistema de recuperação de sequências protéicas baseado em modelos de regressão logística ... 80 Capítulo 6 – Visualização espacial de genomas ... 90
Capítulo 7 – Visualizando dados multivariados e multidimensionais por meio da decomposição em valores singulares seguida de otimização ... 99
Discussão... 122
Conclusões ... 127
Lista de figuras
Lista de abreviaturas
SVD: decomposição em valores singulares; BLAST: the basic local alignment search tool; FASTA = Fast Alignment Search Tool;
PAM: Point Accepted Mutation matrix;
Resumo
x
Abstract
Introdução
Muitas ferramentas de Bioinformática têm como objetivo a detecção de padrões em sequências de proteínas ou de DNA, por meio de pesquisa de similaridades (Figura 1). Estes padrões, quando detectados, podem estar associados com a função ou a estabilidade estrutural da proteína, podem trazer informações sobre uma família de genes ou serem usados para descrever o relacionamento evolutivo de um grupo de sequências (GIBAS e JAMBECK, 2001; HUNTER, 1993). Atualmente, a pesquisa de similaridade entre sequências é o método mais poderoso para predizer a função de um gene desconhecido, sendo a principal técnica usada na Biologia Computacional (HOLM e SANDER, 1998; LIU et al., 2008; PERTSEMLIDIS e FONDON III, 2001).
Figura 1: Importância da análise de similaridades.
12
com o Google (www.scholar.google.com), o artigo original descrevendo o programa BLAST (ALTSCHUL et al., 1990) já foi citado 22.350 vezes.
Justificativa
Avaliar o quanto duas sequências protéicas são similares é uma questão complexa. O primeiro problema refere-se aos diferentes termos (mal) usados quando esta questão é analisada: identidade, similaridade e homologia.
Identidade de sequências existe quando exatamente o mesmo aminoácido ocorre nas mesmas posições das duas sequências. Similaridade leva em conta pareamentos aproximados e é significativa somente quando as substituições de aminoácidos ocorrem entre aqueles com alta probabilidade de serem intercambiáveis (em função de semelhanças de propriedades físico-químicas e da frequência de observação da própria substituição na natureza). A homologia ou o termo “sequências homólogas” é mais importante dos três já que refere-se ao fato das duas sequências compartilharem um ancestral comum no passado. Quando duas sequências são homólogas, além delas serem muito semelhantes uma com a outra, elas têm um relacionamento evolucionário, com ancestrais parecidos e derivando de um mesmo ancestral (PERTSEMLIDIS e FONDON III, 2001). É importante ressaltar que os dois primeiros termos, identidade e similaridade, são quantitativos e têm diferentes formas de serem validados. Já a homologia é qualitativa, sendo muito vulnerável a questionamento (KOSKI, 2001).
14
Mesmo com bons resultados, métodos de detecção de padrões de sequências protéicas baseados em alinhamentos ainda apresentam problemas, tanto no algoritmo em si, devido à complexidade computacional e outras questões, quanto no sistema de escores usados para quantificar as possíveis substiuições de aminoácidos durante o alinhamento (Vinga e Almeida, 2003).
A complexidade envolvida no processo de estimação do relacionamento de várias biomoléculas de grande porte é enorme, já que depende do tamanho das sequências comparadas, o que dificulta a sua utilização nos grandes bancos de dados (HOCHREITER, 2007). Por exemplo, para classificar as proteínas identificadas num genoma recentemente sequenciado, os alinhamentos mais rápidos, feitos com o BLAST, levarão aproximadamente um mês para classificar os genes pertencentes a uma única classe (HOCHREITER, 2007). Em suma, métodos baseados em comparações caractere-a-caractere, para produzirem alinhamentos em larga escala, tornaram-se impraticáveis, muito além da capacidade computacional atualmente disponível (STUART et al., 2002a; STUART e BERRY, 2004). Com a geração de sequências completas de genoma em bancos de dados públicos, contendo bilhões de sequências de caracteres, torna-se crucial o desenvolvimento de métodos efetivos para comparação e categorização de genes, preferencialmente que não tenham tempo de processamento limitado ao tamanho da base de dados (WU et al., 1992). Por exemplo, já estão disponíveis mais de 50 genomas completos de procariotos, 5 genomas de eucariotos (yeast, roundworm, fruit fly, human e A. thaliana) e mais de 160 genomas mitocondriais de vertebrados. O uso destes dados, com todas as sequências do genoma, é muito difícil de ser feito por alinhamentos.
Uma outra consideração crítica refere-se aos escores usados por algoritmos de alinhamento: matrizes PAM (DAYHOFF et al., 1978) e BLOSUM (HENIKOFF e HENIKOFF, 1992). Estas soluções heurísticas refletem incompletudes metodológicas na abordagem da divergência de sequências e também refletem a suposição de conservação da contiguidade entre seguimentos homólogos. Isto torna difícil aos alinhamentos lidar com recombinação genética e genetic shuffling (VINGA e ALMEIDA, 2003).
questionável, tanto que os programas que fazem esse processo automaticamente devem ser considerados somente como um ponto de partida, necessitando de melhorias feitas manualmente através de edições (KRAWETZ e WOMBLE, 2003). Estas edições levam ao descarte de parte da sequência original, fazendo com que a homologia postulada seja restrita a poucos domínios selecionados (STUART et al., 2002a ; THORNE, 2000). Um outro ponto refere-se ao fato de que alinhamentos também podem ignorar que sequências dissimilares podem ter funções similares. “Proteínas com sequências diferentes (< 20% de identidade) podem ter enovelamento muito similares, como exemplificado pelas globinas carreadoras de oxigênio dos mamíferos, insetos e plantas” (STRYER, 1996): Hemoglobina humana, Eritrocruorina de insetos e Leghemoglobina de nódulo de raiz . A detecção de homologia remota, com baixo nível de similaridade também é muito difícil de ser obtida usando análise por alinhamentos (DONG et al., 2006).
Uma outra análise que também deve ser considerada nesta discussão é a filogenia, que é a reconstrução da história evolucionária de uma coleção de organismos ou o processo de se desenvolver hipóteses sobre a relação evolutiva de organismos com base nas suas características observáveis. A análise filogenética tenta descrever o relacionamento evolutivo de um grupo de sequências de genes, proteínas ou genomas completos (GIBAS, 2001). Os estudos filogenéticos partem do pressuposto que todas as formas vivas da terra (tanto as existentes hoje quanto as já extintas) compartilham de uma origem comum, uma provável molécula replicadora. Conseqüentemente, todos os organismos vivos podem ser relacionados através de padrões de descendência, tendo um ancestral comum mais recente ou antigo. Organismos proximamente relacionados descendem de ancestrais comuns mais recentes, enquanto organismos mais distantemente relacionados possuem ancestrais comuns mais antigos. Já a filogenia de genes e proteínas não trata da evolução do organismo inteiro, mas de mudanças evolutivas em regiões codificantes específicas. Neste caso, procura-se identificar qual a relação evolutiva entre uma família de sequências dentro de um único organismo ou entre diferentes organismos.
16
disponíveis contêm uma alta fração de falsa similaridade ou homoplasia1 resultante de uma evolução estocástica neutra, evolução convergente ou transferência horizontal de genes. Determinar quais caracteres são homologias verdadeiras e quais são fruto de homoplasia é um problema difícil e geralmente é decidido somente quando as relações de ancestralidade já estão estabelecidas (STUART et al., 2002a). A solução para esta questão é a construção de filogenias baseadas em dados de genomas completos e procedimentos para se medir a similaridade de sequências sem a necessidade de alinhamentos.
Como alternativa aos alinhamentos, vários métodos para comparação de sequências e de genomas completos, que não utilizam explicitamente comparações de caracteres par-a-par, têm sido propostos e praticados com sucesso (DONG et al., 2006; LIU et al., 2008; RODRIGUES et al., 2004; SANDBERG, 1997; STUART e BERRY, 2003; STUART e BERRY, 2004; STUART et al., 2002a; STUART et al., 2002b; TEICHERT et. al, 2007; VINGA e ALMEIDA, 2003; WU et al., 1992; WU et al., 2007; YUAN et al., 2005). Na verdade, a maioria dos métodos de análise de similaridade e detecção de homologia podem ser divididos em 3 grupos (DONG et al., 2006): algoritmos de comparação par-a-par de sequências (método padrão); modelos generativos para famílias de proteínas, usando cadeias de Markov; classificadores discriminativos, usando exemplos positivos e negativos de similaridade.
Objetivos
Objetivo geral
Apresentar uma metodologia de análise de sequências primárias de proteínas que seja computacionalmente eficiente e biologicamente válida; representar proteínas por meio de vetores e aplicar técnicas de Álgebra Linear, Estatística e Otimização para a extração de padrões, a caracterização e a classificação de genes.
Objetivos específicos
1. Representar sequências primárias de proteínas como vetores de frequência de peptídeos.
2. Propor uma interpretação biológica para a decomposição em valores singulares (SVD), no contexto da análise de sequências protéicas.
3. Avaliar se medidas de similaridade da SVD, distância Euclidiana e cosseno, estão associadas com a distância global de edição e com medidas de similaridade usadas por um programa de alinhamento de sequências.
4. Estimar modelos de regressão que utilizem, como variáveis explicativas, as métricas de similaridade da SVD (distância Euclidiana e cosseno), e, como variáveis resposta, distância global de edição e medidas de similaridade usadas por um programa de alinhamento de sequências.
5. Estimar o grau de concordância entre cosseno e distância Euclidiana com o resultado gerado por um programa padrão de alinhamento de sequências, quando da classificação de uma sequência desconhecida.
6. Identificar aminoácidos importantes para a classificação de uma determinada categoria de proteína por meio dos vetores de frequência de aminoácidos.
7. Identificar bipeptídeos importantes para a classificação de uma determinada categoria de proteína por meio dos vetores de frequência de bipeptídeos.
18
Resultados
Os resultados desta tese estão apresentados em sete capítulos, cada um deles com artigos que tratam da representação vetorial de proteínas, que foram analisadas sem a necessidade de múltiplos alinhamentos. Inicialmente, cada sequência protéica foi transformada num vetor de frequências de peptídeos de tamanho “p”, considerando todas as combinações possíveis de aminoácidos para formarem um p-peptídeo. Com 20 aminoácidos, o modelo de espaço vetorial é formado por vetores de tamanho 20p. Decomposição em valores singulares (SVD) e/ou modelos de regressão logística são aplicados aos dados para extrair padrões ou para permitir a visualização de dados multidimensionais.
O primeiro capítulo “Singular value decomposition (SVD) and BLAST: quite different
methods achieving similar results” (COUTO et al., 2011a), apresenta uma análise cujo
objetivo é mostrar como sequências primárias de proteínas podem ser codificadas como vetores de frequência de peptídeos, avaliando o significado biológico desta codificação. No capítulo, medidas de similaridade da SVD, distância Euclidiana e cosseno, são comparadas com medidas de similaridade usadas por um programa de alinhamento de sequências (BLAST). Correlação de Spearman (r) é usada para avaliar a associação entre estatísticas usadas pelo BLAST e métricas da SVD. A distância euclidiana foi negativamente correlacionada com bit score (r>-0,6) e positivamente correlacionado com E value (r>+0,7). Já o cosseno apresentou correlação negativa com E value (r>-0,7) e correlação positiva com bit score (r>+0,8). Neste mesmo capítulo, é feita uma estimava para o grau de concordância entre cosseno e distância Euclidiana com o resultado gerado por um programa padrão de alinhamento de sequências, quando da classificação de uma sequência desconhecida.
O capítulo 2, “Application of latent semantic indexing (LSI) to evaluate the similarity of
sets of sequences without multiples alignments character-by-character” (COUTO et al.,
2007) apresenta uma visão geral do método. Sequências foram comparadas usando a distância de edição entre cada par de sequências e respectivos cosseno e distância Euclidiana. A correlação entre cosseno e distância de edição foi de -0.32 e entre distância Euclidiana e distância de edição foi de +0.70. Além disto, a habilidade da SVD na classificação de uma sequência de acordo com sua categoria também foi avaliada. Com matrizes de tripeptídeos todas as consultas foram corretamente classificadas.
O capítulo 3, “Unrevealing biological process with linear algebra: extracting patterns
decomposição em valores singulares (SVD): os valores singulares visualizados como scree plots revelam os principais componentes, o número de processos escondidos num banco de dados de sequências protéicas.
No quarto capítulo “Feature selection for protein sequence classification by using
logistic regression models and singular value decomposition” (COUTO et al., 2010a),
modelos de regressão logística e SVD foram usados para a seleção de atributos importantes para a classificação de seqüências protéicas. Além da identificação de atributos, a combinação de modelos de regressão logística com SVD permitiu uma melhor classificação de seqüências desconhecidas do que quando isto era feito somente pela SVD.
O quinto capítulo, “Protein sequence retrieval system based on logistic regression
models” (COUTO et al., 2010b),apresenta um método que gera modelos de regressão
logística que permitem a previsão de uma nova seqüência de ácidos aminados. Testamos com sucesso o método em dez casos: insulina, hemoglobina, queratina, citocromo, albumina, colágeno, fibrinogênio e proteínas relacionadas com fibrose cística, doença de Alzheimer e esquizofrenia.
O sexto capítulo “Genome Visualization in Space” (MARCOLINO et al., 2010), usa SVD e Otimização para a visualização multidimensional de genomas em 2D ou 3D. O último capítulo “Visualizing high dimensional and multivariate data applying singular value
decomposition followed by optimization” (COUTO et al., 2010c), apresenta um artigo
similar ao sexto, no qual é feita uma abordagem que usa SVD e otimização para mapear dados multivariados de proteínas para representação multidimensional em espaço 2D e 3D. Tanto no sexto quanto no sétimo capítulos, foram desenvolvidos mecanismos cujo objetivo é permitir que relações entre os elementos vetoriais multidimensionais, de conjuntos de proteínas ou de outros dados, possam ser visualmente identificadas.
20
Capítulo 1 – Decomposição em valores singulares (SVD) e
QUITE DIFFERENT METHODS ACHIEVING SIMILAR
RESULTS
Bráulio Roberto Gonçalves Marinho Couto
Centro Universitário de Belo Horizonte / UNI-BH, Av. Professor Mário Werneck 1685, Belo Horizonte, Brazil
Macelo Matos Santoro
Departamento de Bioquímica e Imunologia, UFMG, Av. Antonio Carlos 6627, Belo Horizonte, Brazil
Marcos Augusto dos Santos
Departamento de Ciência da Computação, UFMG, Av. Antonio Carlos 6627, Belo Horizonte, Brazil
Keywords: genomics; matrix analysis; BLAST; SVD.
Abstract: The dominant methods to search for relevant patterns in protein sequences are based on character-by-character matching, performed by software known as BLAST. In this paper, sequences are recoded as p-peptide frequency matrix that is reduced by singular value decomposition (SVD). The objective is to evaluate the association between statistics used by BLAST and similarity metrics used by SVD (Euclidean distance and cosine). We chose BLAST as a standard because this string-matching program is widely used for nucleotide searching and protein databases. Three datasets were used: mitochondrial-gene sequences, non-identical PDB sequences and a Swiss-Prot protein collection. We built scatter graphs and calculated Spearman correlation (ρ) with metrics produced by BLAST and SVD. Euclidean distance was negatively correlated with bit score (ρ>-0.6) and positively correlated with E value (ρ>+0.7). Cosine had negative correlation with E value (ρ>-0.7) and positive correlation with bit score (ρ>+0.8). Besides, we made agreement tests between SVD and BLAST in classifying protein families. For the mitochondrial gene database, we achieved a kappa coefficient of 1.0. For the Swiss-Prot sample there is an agreement higher than 80%. The fact that SVD has a strong correlation to BLAST results may represent a possible core technique within a broader algorithm.
1 INTRODUCTION
Comparison of protein sequences is one of the most fundamental issues in Bioinformatics. The dominant methods of such analysis are based on character- by- character matching, made by rapid but not very sensitive algorithms with heuristics, known as BLAST – the basic local alignment search tool (Altschul et al., 1990). Even with good performance, these methods still have difficulties, due to computational complexity and other issues, as problems with genetic recombination and genetic shuffling (Vinga and Almeida, 2003). BLAST, for
Several methods for comparing sequences and complete genomes, which do not explicitly use comparisons of character-by-character, have been proposed and successfully applied as alternative to alignments approaches (Wu et al., 1992; Stuart et
al., 2002; Stuart & Berry, 2004; Yuan et al., 2005;
Dong et al., 2006; Teichert et. al, 2007; Liu et al., 2008; Jun, S.R. et al., 2010). In this paper, proteins are recoded as p-peptide frequency matrix that is reduced by singular value decomposition (SVD), in a latent semantic indexing information retrieval system as described by Stuart (Stuart et al., 2002) and adapted by Couto (Couto et al., 2007). We first represented proteins as vectors and then calculated sequences similarities using linear algebra methods.
Figure 1 shows the simplest case where proteins are represented as three-dimensional vectors (3D): frequencies of Cystein, Alanine and Isoleucine are used to recode mitochondrial genes for four species. It is interesting to notice that protein vectors from the same family (COX3 and COX2) point to the same direction, which can be measured by the cosine among the vector angles (Eldén, 2006).
Figure 1: Representation of proteins as three-dimensional vectors.
The first objective here is to assess the relationship among similarity metrics from SVD, cosine and Euclidean distance, bit score and E value, statistics used by BLAST. We applied a scatter graph analysis and Spearman’s rank correlations technique to do so (ρ). The second objective is to verify if there is an agreement, when an unknown sequence is classified or identified, among SVD results and the “gold standard”, defined by the most similar BLAST hit. This was made by analysis of percent agreement, kappa coefficient, sensitivity, specificity and ROC curve (Altman, 1991). We chose BLAST as a standard because this string-matching program “has become the single most important piece of software in the field of bioinformatics” and it is widely used for nucleotide searching and protein databases (Korf et al., 2003). According to Google, the first paper describing
BLAST (Altschul et al., 1990) was cited over 23,000 times (www.scholar.google.com).
2 SYSTEM AND METHODS
2.1 Programs and datasets
Programs implemented for this analysis were written in MATLAB (The Mathworks, 1996), using its inbuilt functions (SVD, sparse matrix manipulation subroutines etc). Three datasets were used in this paper. The first evaluated database had 64 vertebrate mitochondrial genomes composed of 832 proteins from 13 known gene families (ATP6, ATP8, COX1, COX2, COX3, CYTB, ND1, ND2, ND3, ND4, ND4L, ND5 and ND6). This curated protein database was downloaded from the online information by Stuart et al. paper (Stuart et al., 2002). The file "pdb_seqres.txt.gz", located in
http://bioserv.rpbs.jussieu.fr/PDB/, was the second
database. This file has 121,556 redundant protein sequences from PDB (Protein Data Bank), which was reduced to 37,561 non-identical sequences. A randomly sample of 40,000 sequences from the Swiss-Prot section of the Universal Protein Resource (UniProt) was the third protein collection
(http://www.uniprot.org/downloads).
2.2 Vector representation of proteins
Before one can apply the linear algebra methods used here, it is necessary to represent proteins as vectors in a high-dimensional Euclidean space.
Firstly, we consider a bio molecular sequence as a complex written language, so its analysis can be very similar to that used by Information Retrieval Systems, where large amounts of textual information are organized, compared and categorized. In this case, individual protein sequences correspond to ‘passage’ of text, whereas peptides of a given size (p) serve as ‘words’ (Stuart et al., 2002). Hence, sequences are recoded as p-peptide frequency values using all possible overlapping p-peptides window. With 20 amino-acids it is generated a 20p x n matrix, where p is the word-size and n is the number of proteins to be analyzed. In these matrices, proteins are treated as documents and the p-peptides as terms, which allow the problem to be solved by linear algebra methods (Eldén, 2006).
result in computational problems. With five amino-acids the frequency matrix will be 3,200,000 rows, most of that with zero. This structure is huge and hard to handle. Besides computational issues, larger peptides will lead to problem during the similarity search step. According to Stuart (Stuart et al., 2002), tripeptides may prove useful with highly diverged sequences and tetrapeptides with highly related proteins. On the other hand, larger peptides will remain real undetected similarity, even between very highly related proteins.
Representing proteins as frequency vectors of p-peptides has the limitation that it does not consider the occurrences order of p-peptides in the sequence. Despite this possible ambiguity, several studies have shown that this approach is surprisingly effective in discriminatory analysis of protein sequences (Vinga and Almeida, 2003). Anyway, before using this protein vector representation, we made an analysis of its ambiguity rate according to the number of amino-acids (p) in the matrix of frequency protein-peptide. We compared 26,675 non-identical proteins longer than 100 amino-acids and selected from the PDB dataset. To identify ambiguities during vector recoding, we compared 355,764,475 sequences-pairs. The percentage of ambiguity felt from about 4%, when used only one amino-acid in the matrix of frequencies (p=1) to less than 0.5% in proteins with two or more amino-acids. The percentage of uncertainty was calculated considering the number of different sequences with the coding for all sequences that were compared pair-to-pair (26,675). It is noteworthy that in all pairs with identical vector coding, even among the 1,267 pairs with p=1, the protein involved was exactly the same, with minor changes of amino-acids in some positions. This happened because, before analysis, we removed from the PDB database only sequences with 100% identity. We can say that the ambiguity is a theoretical possibility in principle but not in practice.
2.3 Singular value decomposition
After the generation of the p-peptide frequency matrix (M) representing each dataset with n sequences, the matrix itself is subjected to SVD (Deerwester et al., 1990; Berry et al., 1995) and factorized as M = USVT. Where U is the p x p orthogonal matrix having the left singular vectors of M as its columns, V is the n x n orthogonal matrix having the right singular vectors of M as its columns, and S is the p x n diagonal matrix with the singular values σ1≥σ2≥σ3 ... ≥σr of M in order along its diagonal (r is the rank of M or the number of
linearly independent columns or rows of M). This is performed by many software, including MATLAB (The Mathworks, 1996), used in this work. The matrix (U) is related to the p-peptides of the dataset, whilst (V) is associated with the proteins studied. The central matrix (S) contains the singular values of (M) in decreasing order. These singular values are directly related with independent characteristics within the dataset. Actually, the largest values of (S) provide meaning of the peptides and proteins in the matrix (M). On the other hand, the smaller singular values identify less significant aspects and the noisy inside the dataset (Eldén, 2006). The number of significant singular values from SVD analysis shows how many process or groups can be hidden in database.
For the sequence similarities analysis, instead of using the original matrix M, a rank reduction of M is done by using the k-largest singular values of M, or k-largest singular triplet Uk, Sk, Vk, where k < r. The
truncated matrix Mk = UkSk(Vk)T has two main
advantages. Reduced dimensionality makes the problem computationally approachable, which is crucial in whole genome analysis. Besides, and very important, the rank reduction improve accuracy of protein matrix by discarding noise and reducing the variability in p-peptide usage for the same protein family (Couto et al., 2007). The choice of k, the number of singular values that must be used in the reconstruction of the protein matrix after SVD, is critical and normally empirically decided. Ideally, the k factor or matrix dimension must be large enough to fit all the real structure in the data, and small enough not to fit the sampling error or unimportant details. In this work we used the method proposed by Everitt and Dunn, that recommends analyzing the relative variances of each singular values. Singular values which relative variance is less than 0.7/n, where n is the number of proteins in the document-term matrix, must be ignored (Everitt and Dunn, 2001).
3 RESULTS
Scatter plots were built and suggested that Euclidean distance is negatively related with bit score, but positively correlated with E value. For the cosine we found a negative association with E value and a positive relationship with bit score. Those results are consistent because, the higher cosine, the more similar are the two protein vector. The same happens with BLAST bit score. As the E value, the smaller Euclidean distance between the end points of two protein vectors, the more similar are the sequences. Figure 2 and 3 presents respectively scatter graphs between the bit score and cosine and between the bit score and Euclidean distance.
Figure 2: Scatter graph for mitochondrial gene dataset: cosine of angle between protein vectors has a positive correlation with BLAST bit score.
Figure 3: Scatter graph for mitochondrial gene dataset: Euclidean distance between protein vectors has a negative correlation with BLAST bit score.
For the second database, 27,361 non-identical PDB sequences longer than 100 amino-acids were compared with BLAST and SVD. In this analysis,
the first protein was compared with the second, than was compared with the third and so on, which totalled 27,360 comparisons. Figure 4 shows the parameters used by bl2seq.exe program analysis.
Figure 4: BLAST parameters used in the PDB database.
We built scatter graphs and calculated Spearman correlations (ρ) among bit score and E value from the most similar BLAST hit, respective cosine and Euclidean distance from SVD (Figure 5). All plots had the same shape that observed for the first database. For BLAST analysis we also compared the results obtained by applying different substitution matrix: BLOSUM62, BLOSUM45, BLOSUM80, PAM30, PAM70 and PAM2050. The Euclidean distance was negatively correlated with bit score (ρ>-0.6) and positively correlated with E value (ρ>+0.7). For the cosine we found a negative correlation with E value (ρ>-0.7) and a positive correlation with bit score (ρ>+0.8). It is interesting that the correlation between E value and bit score was not exactly 1.0 because of rounding errors.
Besides the correlation analysis, we made an agreement test between SVD and BLAST in classifying protein families. For the mitochondrial gene families database, we used a sample of 212 sequences from the 13 gene families as queries (test set), and the other proteins (620) were used to generate the frequency matrix (training set): the kappa coefficient between SVD and BLAST was 1.0 (agreement = 100%). If we use the first three significant singular values from the SVD analysis of the thirteen gene families’ database, we can generate a three-dimensional graph showing how these genes can be visualized in space (Figure 6). It is interesting how the families are well separated in space, which facilitates classification.
2001). The area under the ROC curve (AUC) was estimated for both, cosine, Euclidean distance and for the frequency matrix using one, two, three and four peptides. The eight AUCs estimated were higher than 0.80 (Figures 7 and 8), which indicates a good performance of SVD in detecting biological significant similarities (Altman, 1991).
Figure 5: Correlation matrix: BLAST versus SVD.
Figure 6: Visualization of mitochondrial genes using the three first singular values from SVD: the 13 gene families are well separated in space, which facilitates classification.
Table 1 summarizes the results when cosine among protein vectors is used to detect a biological
significance similarity. When is used a cut-off of 0.90 for the cosine, the sensitivity and specificity for detecting biological significance were, respectively, 72% and 94%.
Figure 7: ROC curve built when SVD Euclidean distance is used to detect biological significant similarity.
Figure 8: ROC curve built when SVD cosine is used to detect biological significant similarity.
Table 1: Two-way contingency table: cosine higher than 0.90 between protein vectors has 72% sensitivity and 94% specificity to detect biological significant similarities.
Cosine biological significance?
BLOSUM62 biological
significance? (+) (−) Total Yes 9,678 3,843 13,521
No 808 13,031 13,839
Total 10,486 16,874 27,360
was randomly divided into two groups: 9,953 proteins were selected as queries (test set), and the other 30,047 sequences (training set) were used to generate the frequencies matrix of SVD and to become the BLAST database for evaluating the queries. All 9,953 unknown proteins were analyzed by SVD and BLAST (actually, blastall program with default parameters) and results of both methods were compared in order to detect agreement. If the Swiss-Prot mnemonic protein identification code of the most similar BLAST hit was identical as that obtained by a SVD analysis, so we had an agreement. When this happened, the matched proteins are the same, from the same or different species. Table 2 presents the percent agreement between BLAST and SVD: the results were good, except when the p-peptide matrix is built by using just one amino-acid as the word-size.
Table 2: Agreement between SVD and BLAST for classifying proteins from the Swiss-Prot dataset.
p-peptide matrix SVD similarity metric Percent agreement with BLAST Cosine 20% p=1
Euclidean distance 30% Cosine 79% p=2
Euclidean distance 82% Cosine 80% p=3
Euclidean distance 82% Cosine 69% p=4
Euclidean distance 72%
4 CONCLUSION
We worked with quite different techniques and we found important association among their metrics and good agreement between both methods. Despite the fact that is presumably not surprising that e.g. BLAST bit score could be positively correlated to cosine of angle, or negatively correlated to Euclidean distance, the sizes of these correlations are very interesting (Figure 5).
We achieved similar results between BLAST and SVD in several protein analyses. The findings strongly suggest that SVD can be used to protein-protein comparisons with biological significance of the similarities identified both for cosine and Euclidean distance. The fact that SVD has a strong correlation to BLAST results may represent a possible core technique within a broader algorithm.
Besides, SVD has some characteristics that could be an advantage over alignment algorithms. For
example, SVD analysis can be very rapid, it does not use any heuristics to asses an unknown sequence, its metrics are exact in a sense of direction and position in a high-dimensional Euclidean space, it is not affected by database redundancy because of rank reduction, its similarity metrics do not depend on the database size, and any analyze does not need a substitution matrix nor gap penalties to produce biological significant results.
An assessment of the singular value spectrum visualized as scree plots (Zhu and Ghodsi, 2006) can unreveals the main components, the process that exists hidden in a database. This information can be used in many applications as clustering, gene expression analysis, immune response pattern identification, characterization of protein molecular dynamics and phylogenetic inference.
SVD can be also used to visualize the relationships between sequences and even whole genomes, which can be essential to better analyze complex systems and can be very helpful to categorize genes or species in phylogeny.
All results found in this work and the characteristics described are important because SVD can be a solution for the potential problems with alignment algorithms and can be a substitute for those methods, for example, in whole genome analysis.
ACKNOWLEDGEMENTS
We are thankful to Professor Gary W. Stuart from Indiana State University, Department of Life Sciences, who sent us helpful data. We also thank Marlon C. Souza from UNI-BH, who revised the manuscript.
REFERENCES
Altman, D.G., 1991. Practical Statistics for Medical Research. Chapman and Hall, London, UK.
Altschul, S.F. et al., 1990. Basic local alignment search tool. J. Mol. Biol., 215, 403-410.
Berry, M.W. et al., 1995. Using linear algebra for intelligent information retrieval. SIAM Review, 37, 573-595.
Couto, B.R.G.M. et al., 2007. Application of latent semantic indexing to evaluate the similarity of sets of sequences without multiple alignments character-by-character. GMR, 6(4), 983-999.
Eldén, L., 2006. Numerical linear algebra in data mining. Acta Numerica, 327-384.
Everitt, B.S. and Dunn, G., 2001. Applied multivariate data analysis. 2nd edn. Arnold, London, UK.
Holm, L. and Sander, C., 1998. Removing near-neighbour redundancy from large protein sequence collections. Bioinformatics, 14(5), 423-429.
Jun, S.R. et al., 2010. Whole-proteome phylogeny of prokaryotes by feature frequency profiles: An alignment-free method with optimal feature resolution. Proc Natl Acad Sci U S A, 107(1):133-8.
Korf, I.; Yandell, M.; Bedell, J., 2003. An essential guide to the Basic Local Align-ment Search Tool – BLAST. O’Reilly & Associates Inc., Sebastopol, USA. Koski, L.B. and Golding, T.B., 2001. The closest BLAST
hit is often not the nearest neighbor. J. Mol. Evol., 52, 540-542.
Krawetz, A.S. and Womble, D.D., 2003. Introduction to Bioinformatics: a theoretical and practical approach. Humana Press, Totowa, USA.
Liu, B. et al., 2008. A discriminative method for protein remote homology detection and fold recognition combining top-n-grams and latent semantic analysis. BMC Bioinformatics, 9, 510.
Pertsemlidis, A. and Fondon III, J.W., 2001. Having a BLAST with bioinformatics (and avoiding BLASTphemy). Genome Biology, 2(10), 1-10. Stuart, G.W. et al., 2002. Integrated gene and species
phylogenies from unaligned whole genome protein sequences. Bioinformatics, 18(1), 100-108.
Stuart, G.W. and Berry, M.W., 2004. An SVD-based comparison of nine whole eukaryotic genomes supports a coelomate rather than ecdysozoan lineage. BMC Bioinformatics, 5: 204+.
The Mathworks, 1996. MATLAB: mathematical computation, analysis, visualization, and algorithm development (version 5.0). Natick, Massachusetts, USA.
Teichert, F. et al., 2007. SABERTOOTH: protein structural alignment based on a vectorial structure representation. BMC Bioinformatics, 8, 425.
Vinga, S. and Almeida, J., 2003. Alignment-free sequence comparison: a review. Bioinformatics, 19(4), 513-523. Wu, C. et al., 1992. Protein classification artificial neural
system. Protein Science, I, 667-677.
Yuan, Y. et al., 2005. A Protein Classification Method Based on Latent Semantic Analysis. Conf Proc IEEE Eng. Med. Biol. Soc., 7, 7738-41.
28
Capítulo 2 – Aplicando decomposição em valores singulares para
a análise de similaridades de sequências sem múltiplos
the similarity of sets of sequences without multiple
alignments character-by-character
B.R.G.M. Couto1,2, A.P. Ladeira1,3 and M.A. Santos4
1Programa de Doutorado em Bioinformática,
Departamento de Bioquímica e Imunologia,
Universidade Federal de Minas Gerais, UFMG, Belo Horizonte, MG, Brasil
2Curso de Ciência da Computação, Centro Universitário de Belo Horizonte,
UNI-BH, Belo Horizonte, MG, Brasil
3Escola de Ciência da Informação, Universidade Federal de Minas Gerais,
UFMG, Belo Horizonte, MG, Brasil
4Departamento de Ciência da Computação,
Universidade Federal de Minas Gerais, UFMG, Belo Horizonte, MG, Brasil
Corresponding author: B.R.G.M. Couto E-mail: [email protected]
ABSTRACT.
Most molecular analyses, including phylogenetic in-ference, are based on sequence alignments. We present an algorithm that estimates relatedness between biomolecules without the require-ment of sequence alignrequire-ment by using a protein frequency matrix that is reduced by singular value decomposition (SVD), in a latentseman-Genet. Mol. Res. 6 (4): 983-999 (2007) Received August 03, 2007
INTRODUCTION
Many molecular analyses, including phylogenetic inferences, are based on character-by-character comparisons (Krawetz and Womble, 2003). These standard methods use align-ment algorithms that are intrinsically highly subjective and usually employ cut-off values and
gap penalties that are difficult to define (Stuart et al., 2002a). According to Thorne (2000), the most significant error in molecular phylogenies is due to inaccurate alignments. Furthermore,
once an alignment is obtained, it is necessary to discard a fraction of the original sequences compared, which restricts the postulated homology to a few selected domains (Thorne, 2000;
Stuart et al., 2002a). Besides the difficulties with the alignment algorithm itself, as whole ge -nome sequences continue to accumulate in public databases, with billions of sequence char-acters, effective methods for comparing and categorizing these genes are crucial. Actually, the complexity involved in estimating relatedness between large numbers of biomolecules is enormous, and methods based on character-by-character comparisons to produce large-scale alignments become impractical, far beyond the scope of currently available computational sys-tems (Stuart et al., 2002a,b; Stuart and Berry, 2003, 2004).
In this report, we present an algorithm to compare and to categorize genes that are based on the methodology developed by Stuart et al. (2002a) for generating whole genome phylogenies using vector representations of protein sequences. The algorithm estimates
relat-tic index information retrieval system. Two databases were used: one with 832 proteins from 13 mitochondrial gene families and another composed of 1000 sequences from nine types of proteins retrieved
from GenBank. Firstly, 208 sequences from the first database and 200
from the second were randomly selected and compared using edit distance between each pair of sequences and respective cosines and Euclidean distances from SVD. Correlation between cosine and edit distance was -0.32 (P < 0.01) and between Euclidean distance and edit distance was +0.70 (P < 0.01). In order to check the ability of SVD in classifying sequences according to their categories, we used a sample of 202 sequences from the 13 gene families as queries (test set), and the other proteins (630) were used to generate the frequency matrix
(train-ing set). The classification algorithm applies a vot(train-ing scheme based on the five most similar sequences with each query. With a 3-peptide frequency matrix, all 202 queries were correctly classified (accuracy =
100%). This algorithm is very attractive, because sequence alignments are neither generated nor required. In order to achieve results similar to those obtained with edit distance analysis, we recommend that Eu-clidean distance be used as a similarity measure for protein sequences in latent semantic indexing methods.
edness between large numbers of biomolecules without the requirement of multiple sequence alignment. The original method (Stuart et al., 2002a) uses a tool from numerical analysis, called singular value decomposition (SVD), to process a peptide frequency matrix, a large sparse data matrix in which each protein is uniquely represented as a vector. As the comparisons among sequences are made by vector pairwise comparisons instead of sequence alignments, before applying the proposed method, we analyzed the relationship between the vector properties (co-sine and Euclidean distance values) and edit distance measures, which allowed the validation of the methodology.
MATERIAL AND METHODS
A biomolecular sequence can be viewed as a complex written language, so that its analysis can be very similar to that used by information retrieval (IR) systems, where large amounts of textual information are organized, compared and categorized (Berry et al., 1999;
Stuart et al., 2002a). In the IR field, commonly used models are the boolean, vector space,
probabilistic model, and latent semantic indexing (LSI), which combine the vector space mod-el with singular value decomposition (Cöster, 1999).
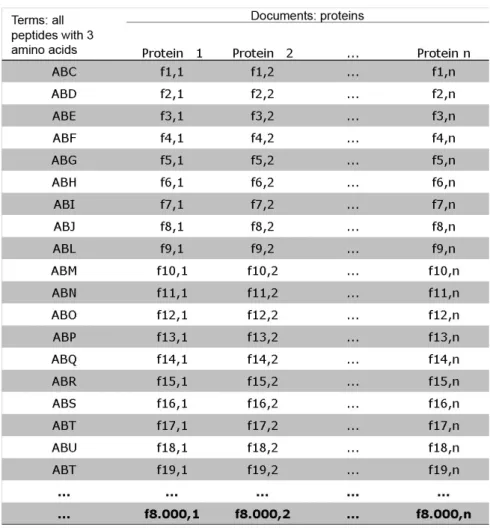
The method proposed by Stuart et al. (2002a) to evaluate the similarity of sequences is an LSI method, where individual protein sequences correspond to a “passage” of text, whereas peptides of a given size serve as n-gram “words”. In this approach, protein sequences are re-coded as p-peptide frequency values using all possible overlapping p-peptides (Stuart et al., 2002a; Rodrigues et al., 2004). With 20 amino acids, a 20^p x n matrix is generated (20^p rows and n columns or vectors, one for each n protein under analysis). For instance, by using
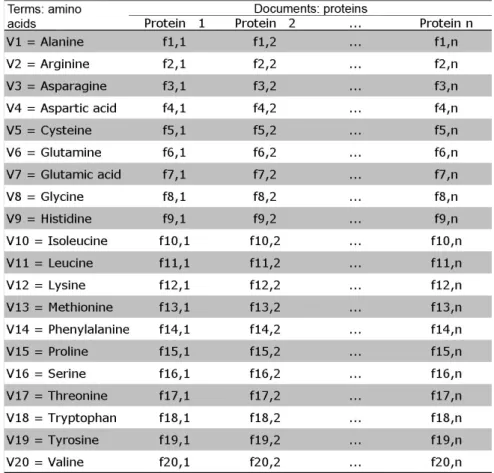
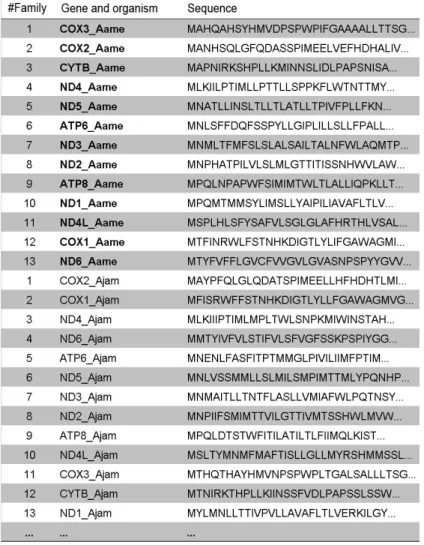
a tripeptide, there are 20^3 = 8000 possible peptides, and if 4 amino acids are used, there are 20^4 = 160,000 possible tetrapeptides. The simplest situation, illustrated by Figure 1, occurs
when only one amino acid is used for each peptide. In this case, the frequency matrix has only 20 rows and n columns, each one representing the protein vectors. These n vectors are
com-posed of the frequency of each amino acid in the protein (f1,1 = frequency of alanine in the first
protein). When all combinations of size 3 amino acids are used to build the matrix (Figure 2),
each vector has the frequency of each tripeptide in the protein (f1,1 = frequency of tripeptide 1 in the first protein). In these matrices, proteins are treated as documents and peptides as terms,
which allows the problem to be solved by information retrieval methods.
Programs and datasets
Programs implemented for this analysis were written in MATLAB (The Mathworks, 1996), using its built-in functions (SVD, sparse matrix manipulation subroutines, etc.). Two
datasets were used in this paper. The first database evaluated had 64 vertebrate mitochondrial
genomes composed of 832 proteins from 13 known gene families (ATP6, ATP8, COX1, COX2, COX3, CYTB, ND1, ND2, ND3, ND4, ND4L, ND5, and ND6). This curated protein database was downloaded from the online information at http://mama.indstate.edu/users/stuart/gaspipe/ index.html from Stuart et al. (2002b).
Figure 1. Protein frequency matrix built with 1-letter string of amino acids.
type of protein (globin, cytochrome, histone, cyclohydrolase, pyrophosphatase, ferredoxin, keratin, and collagen) and 200 other proteins from lymphocytes and bacteriophages, totaling 1000 sequences.
Construction of the protein matrix
Terms, documents, queries, and weights are fundamental components of any IR
sys-tem (Cöster, 1999). A term is an individual word or a phrase that reflects a particular concept or
key word (Berry et al., 1995). Terms are extracted from either the body of a text or a surrogate text (e.g., abstract). In the context of biomolecular sequences, terms are the p-peptide strings (usually, tripeptides or tetrapeptides). Documents are the text itself, composed of terms. Here, proteins are the documents analyzed. The information needed by an IR user is called a query (Cöster, 1999). In this report, a query will be an unknown gene sequence whose category or
Figure 2. Protein frequency matrix built with 3-letter string of amino acids.
The document-term matrix construction is based on the protein sequences that are re-coded as p-peptide frequency values using all possible overlapping p-peptides, which generates
the frequency matrix. Matrices are built using p = 1, p = 2, p = 3, and p = 4 peptides. These sparse
matrices have dimensions of 20 x n, 400 x n, 8000 x n, and 160,000 x n, respectively, where n
is the number of sequences analyzed. A larger number of peptides is not used because it will
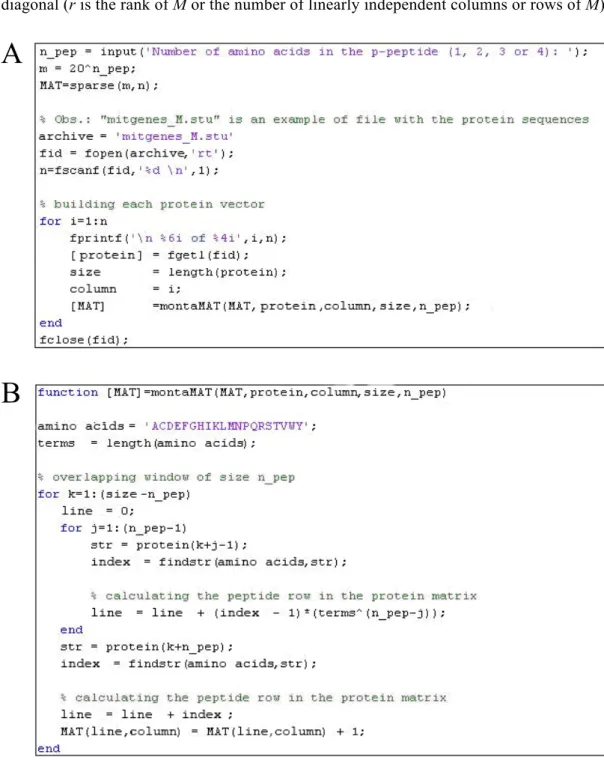
produce huge matrices, with more than 3 million rows (20^5 = 3,200,000 rows). The MATLAB codes in Figure 4A and B build the protein matrix using sequence data in a text file, for example, in a file named “mitgenes_M.stu”. The first line of the file has the number of sequences to be
analyzed (n), and the other lines have the string sequences of each protein in the dataset.
It is important to note that, with four amino acids in the p-peptide, there will be 160,000 possible tetrapeptides in the protein matrix, most of which will have zero frequency. Actually, the matrix produced by the algorithm 4A and B will be very sparse, which is computationally good in terms of memory requirements.
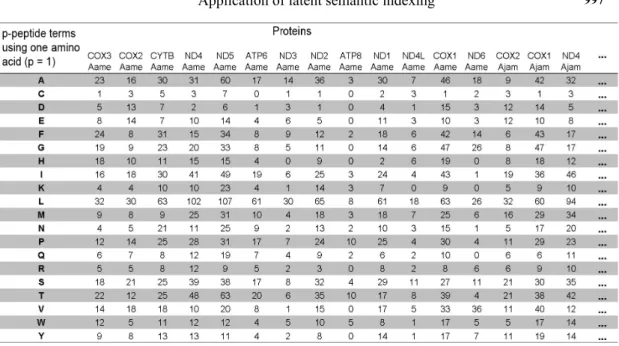
Figure 5 shows the protein frequency matrix in the simplest case (variable n_pep = 1),
when the peptide is composed of only one amino acid. In this situation, we have 20 terms, and in
analyzing 5 proteins, the document-term matrix has 20 rows and 5 columns. The five proteins corre -spond to 2 genes (COX3 and COX2) from different vertebrate mitochondrial genomes. The original amino acid frequency for each protein varies across each vector (columns of the protein matrix).
Latent semantic indexing
LSI, developed by Deerwester et al. (1990), is an IR method that uses singular value decomposition and a vector space model to retrieve information (Orengo, 2004). In a vector space representation of information, vectors that form a frequency term-by-document matrix, as illustrated in Figures 1 and 2, are used to represent each document or proteins. The aim of LSI is to perform the retrieval of a query in terms of conceptual content, rather than literally matching terms (Deerwester et al., 1990; Berry et al., 1995; Orengo, 2004). Due to synonymy, where the same concept can be expressed in many different ways, and polysemy, where a word can have multiple meanings, in the traditional IR systems individual words provide unreliable evidence about the meaning of the document (Orengo, 2004). To overcome the synonymy and polysemy problems, LSI estimates the usage of terms across documents, revealing its underlying semantic structure. Terms that occur frequently together are associated, which in practice means that a query may retrieve documents which have none of the query terms (Deerwester et al., 1990).
In a mathematical way, synonymy and polysemy are solved by applying an SVD in the term-by-document matrix, followed by a rank matrix reduction. After the SVD, the matrix reduction is performed by replacing the original matrix with another that is as close as possible to the original but whose column space is only a subspace of the column space of the original matrix (Berry et al., 1999). The objective of breaking down the term-document matrix is to remove extraneous information or noise from the original database.
SVD is performed by many software, including MATLAB (The Mathworks, 1996) used in this study. Given a (m x n) term-by-document matrix M, the SVD of M is defined using
Equation 1 (Deerwester et al., 1990):
A
B
Figure 4. A. Protein matrix construction subroutine (part I). B. Protein matrix construction subroutine (part II). where U is the m x m orthogonal matrix having the left singular vectors of M as its columns,
V is the n x n orthogonal matrix having the right singular vectors of M as its columns, and S is
The rank reduction of M matrix is performed using the k-largest singular values of M, or k-largest singular triplet Uk, Sk, Vk, where k ≤ r. The truncated matrix Mk is defined in Equation 2:
(Equation 2)
The dimension of the vector in Uk and Vk is equal to k, the number of SVD factors used. The extent of dimension reduction, i.e., the choice of k, will be detailed in the next sections. This choice is critical, being an open issue in the literature and normally decided via empirical testing (Deerwester et al., 1990; Berry et al., 1999). The truncated SVD has two main advantages. Reduced dimensionality makes the problem computationally ap-proachable, which is crucial in whole genome analysis. Besides, and very importantly, rank reduction improves the accuracy of term-document or protein matrix by discarding noise or variability in term or peptide usage, which can remove possible homoplasy in the data (Stuart et al., 2002b). Another formula (Equation 3) to reconstruct the protein matrix, based on the k first singular values is:
(Equation 3)
Another advantage of rank reduction is the possibility of graphical analysis and data
visualization. Using the two first singular values (k = 2), the data can be analyzed by a 2-dimen
-sional (2-D) plot and, with 3 factors (k = 3), data can be visualized in a 3-D graph.
In Figure 6, we have the M protein matrix, reconstructed by using two SVD factors.
It is interesting to observe how the data variability, measured by the coefficient of varia
-tion, is reduced. The average coefficient of variation of the amino acid frequency for both
genes was reduced from approximately 15% in the original matrix to only 3% in the recon-structed matrix. This reduction in variability is optimal for pattern recognition and clustering (Schalkoff, 1992).
Figure 6. The 20 x 5-protein matrix reconstructed with two factors.
Besides homogenizing the amino acid frequency in each gene by eliminating data noise in COX3 and COX2 vectors, dimension reduction allows a data visualization of proteins
in a 2-D plot (Figure 7), with two separated clusters (G1 = COX3 and G2 = COX2, from verte
-brates A, B and C). The x-coordinate is obtained by multiplying the first column of the matrix V
(from SVD) by the reduced S matrix, with only the two first singular values. The y-coordinate
Dimension reduction
As discussed before, the choice of k, the number of singular values that must be used in the reconstruction of the protein matrix after SVD, is critical and normally empirically decided. Ideally, the k factor or matrix dimension must be large enough to fit all the real structure in the
data, and also small enough not to fit the sampling error or unimportant details. According to
Deerwester et al. (1990), the best performance of any IR system is achieved when the maxi-mum number of singular values is less than 300.
In this study, we used the method proposed by Everitt and Dunn (2001), who recom-mend the analysis of the relative variances of each of the singular values (vi), calculated by Equation 4. Singular values whose relative variance is less than 0.7/n, where n is the number of proteins in the document-term matrix, must be ignored (Everitt and Dunn, 2001; Wall et al., 2003).
(Equation 4)
where vi is the relative variance of the singular value Si, from r singular values of the
docu-ment-term matrix. The idea is to use only the most significant singular values when the protein
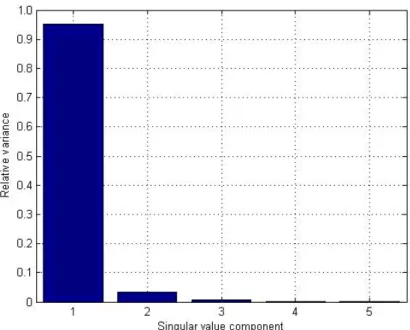
matrix is reconstructed. For the 20 x 5-protein matrix in Figure 5, only two singular values are
significant (Figure 8). In this case, k must be equal to 2, which was done when the 2-D plot was constructed (Figure 7).
Query retrieving algorithm
In the LSI information retrieval system built, it is possible to perform various com-parisons: protein-by-protein, peptide-peptide, peptide-protein, and query-protein. Stuart et al. (2002a,b) and Stuart and Berry (2003, 2004) use these comparisons to build gene and species phylogenetic trees and to identify motifs.
Herein, the fundamental operation is the query-to-protein analysis, which allows the
classification of the unknown gene (query) in one of the protein categories of the database. In this paper, the classification and retrieving algorithm applies a voting scheme based on the five
most similar proteins with the unknown gene.
Since the query is not part of the original protein matrix (M), its vector (q) must be first
generated and projected into the same form as a protein vector. The algorithms in Figure 4A and B can be used to generate the query vector q, which is modified according to Equation 5 to
become another LSI protein vector:
(Equation 5)
To compute similarity between the query vector and each of the protein vectors, to re-trieve the most similar proteins with respect to the unknown gene, we can use many measures (Berry et al., 1995). The most often used similarity measures are the cosine of the angle and the Euclidean distance between the vectors. Despite the fact that some authors have recommended
cosine as the most effective similarity measure for text retrieval (Cöster, 1999; Kuruvilla et al., 2002; Orengo, 2004), we evaluated both measures for biomolecular sequence analysis.
The cosine of the angle between two vectors yields a value in the real range [-1.0, +1.0]. If the cosine is close to 1.0, it means that both vectors are in the same direction. A nega-tive value close to -1.0 means that the vectors are in the opposite direction.
Two vectors define two points in the space. The Euclidean distance measures the ab
-solute distance between the points defined by the vectors under comparison. This is a measure
of neighborhood between vectors. The higher the similarity is between the two vectors, the smaller the Euclidean distance is.
The top five similar proteins with the query, by using either cosine or Euclidean dis
-tance, were used to define the category of the unknown sequence. This query is classified as a
gene from a family that includes t most of these five sequences. For example, if the five most
similar proteins with one query are from two different families A and B (Gene_A, Gene_B, Gene_B, Gene_A, and Gene_A, ordered by similarity with the query), the query is classified as
a gene from family A. This method was called the voting algorithm.
The standard methods for comparisons among sequences are based on character-by-character alignments. Before applying the proposed LSI system, we analyzed the relationship between the two similarity measures with the edit distance, obtained from global sequence alignments using dynamic programming (Krawetz and Womble, 2003). In this way, it was pos-sible to validate the method and to determine which similarity measure, cosine or Euclidean distance, is better to produce results approximately equal to the edit distance values. A correla-tion and a regression analysis (Neter et al., 1996) was performed to evaluate the relacorrela-tionship among the three similarity measures.
RESULTS AND DISCUSSION
To assess the correlation between the cosines, the Euclidean distance and a sequence
alignment measure, 208 sequences from the first database and 200 from the second set were
randomly selected and compared by using the global edit distance between each pair of se-quences and respective cosines and Euclidean distances. The protein matrix was generated with
tripeptide terms and reconstructed with 30 SVD factors (the definition of the number of SVD
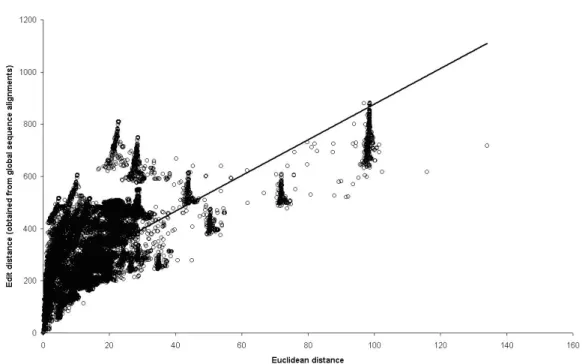
factors followed the relative variance criteria; Equation 4). The pairwise analysis generated 41,428 similarity measures. Despite the fact that we worked with quite different methods (LSI and global distance alignment), the correlation between the cosine and edit distance was -0.32 (P < 0.01) and between the Euclidean distance and edit distance was +0.70 (P < 0.01). These results indicate that Euclidean distance is better than the cosine in determining the similarity of sequences, when the objective is to achieve the same results as that observed with multiple alignments character-by-character (Figures 9 and 10). Actually, the square root of the Euclid-ean distance was better than the distance itself, with a Pearson correlation of 0.76 (Figure 10).
Figure 9. Scatter plot of Euclidean distance and global edit distance.
Figure 10. Correlation coefficient (r) between each singular value decomposition similarity measure and edit
distance (Sij).
Despite the moderate correlation between Euclidean distance and edit distance
(r = +0.76), it is possible to fit a linear model to estimate edit distance according to the Euclid -ean distance (Equation 6):
(Equation 6)
After comparing SVD results with edit distance measure, we evaluated the ability of LSI to classify the sequences according to their categories. A sample of 202 sequences from the 13 gene families was randomly chosen as queries and the other proteins (630) were used to generate the p-peptide frequency matrix. For the second database, 735 se-quences were selected to build the training set (the p-peptide frequency matrix), and 265
proteins were randomly selected as queries or test set. Figure 11 shows the file format of the original sequences from the first database. In Figure 12, we have part of the protein
matrix of these data in the simplest case, where only one amino acid is used in the p-pep-tide term.
For both datasets, the protein frequency matrix was built by using the subroutines in Figure 4A and B, and the SVD was applied in each matrix that was reconstructed by using a
number of factors defined by the relative variance analysis (Equation 4). The number of fac -tors varied from 2 up to 56 (Figure 13). The advantage of the relative variance criteria is that
dimension reduction is done according to the information in the protein matrix itself, instead of using external data, as utilized by Stuart et al. (2002a). They used prior categorical information
concerning family memberships, which could be difficult for unknown sequences. According
to these authors, “the development of a procedure whereby optimal dimension can be ap-proximated without reference to prior information would represent an important advancement” (Stuart et al., 2002b). This is done by using the relative variance criteria.
Figure 12. Protein frequency matrix of the first database (p-peptide = 1 amino acid).
Figure 13. Dimension reduction according to the relative variance criteria. SVD = singular value decomposition.
In the first database, the best result was achieved with a 3-peptide frequency matrix
(size of 8000 rows and 630 columns), reconstructed by SVD with 28 terms: all 202 queries
were correctly classified into each of the 13 gene families, with 100% accuracy (Figure 14).