j o u r n a l h o m e p a g e : w w w . i n t l . e l s e v i e r h e a l t h . c o m / j o u r n a l s / c m p b
MammoSys: A content-based image retrieval system using
breast density patterns
Júlia E.E. de Oliveira
a,∗, Alexei M.C. Machado
b, Guillermo C. Chavez
a,
Ana Paula B. Lopes
a, Thomas M. Deserno
c, Arnaldo de A. Araújo
a aUniversidade Federal de Minas Gerais, Departamento de Ciência da Computac¸ão, Av. Antônio Carlos, 6627,31270-901, Belo Horizonte, MG, Brazil
bPontifícia Universidade Católica de Minas Gerais, Departamento de Ciência da Computac¸ãão, Instituto de Informática, R. Dom Jose
Gaspar, 500 - Prédio 34, sala 215, 30535-610, Belo Horizonte, MG, Brazil
cAachen University of Technology (RWTH), Department of Medical Informatics, Pauwelsstr. 30, D-52057 Aachen, Germany
a r t i c l e
i n f o
Article history:
Received 14 August 2009 Received in revised form 19 January 2010
Accepted 21 January 2010
Keywords:
Medical images Breast density
Content-based image retrieval Two-dimensional principal component analysis Support vector machine
a b s t r a c t
In this paper, we present a content-based image retrieval system designed to retrieve mam-mographies from large medical image database. The system is developed based on breast density, according to the four categories defined by the American College of Radiology, and is integrated to the database of the Image Retrieval in Medical Applications (IRMA) project, that provides images with classification ground truth. Two-dimensional principal component analysis is used in breast density texture characterization, in order to effectively represent texture and allow for dimensionality reduction. A support vector machine is used to perform the retrieval process. Average precision rates are in the range from 83% to 97% considering a data set of 5024 images. The results indicate the potential of the system as the first stage of a computer-aided diagnosis framework.
© 2010 Elsevier Ireland Ltd. All rights reserved.
1.
Introduction
Breast density has been shown to be related to the risk of developing breast cancer[1]since women with dense breast tissue can hide lesions, causing cancer to be detected at later stages. The BI-RADS (Breast Imaging Reporting Data Sys-tem) density scale, developed by the American College of Radiology,1informs radiologists about the decline in sensitiv-ity of mammography with increasing breast denssensitiv-ity. BI-RADS defines density I as almost entirely fatty, density II as scattered
∗Corresponding author.Tel.: +55 3125358248.
E-mail addresses: [email protected](J.E.E. de Oliveira),[email protected](A.M.C. Machado),[email protected](G.C. Chavez),
[email protected](A.P.B. Lopes),[email protected](T.M. Deserno),[email protected](A.d.A. Araújo). 1 http://www.acr.org.
fibroglandular tissue, density III as heterogeneously dense tis-sue, and IV as extremely dense tissue.
Mammography is the main screening tool for cancer and radiologists evaluate and report breast density on the basis of visual analysis of mammographies. The various distribution of the parenchyma tissue makes automatic classification a diffi-cult task, so in this scenario, as auxiliary tools, computer-aided diagnosis (CAD) and content-based image retrieval (CBIR) sys-tems appear as real possibilities to help radiologists reduce the variability of their analysis and also improve the accuracy of
SOM Decision tree, LDA, Neural network
Combined Bayesian Naïve Bayes
mammography interpretation. CBIR systems[2,3], which are a component of CAD systems, use visual information extracted from images to retrieve similar images to a specific query. A CBIR system does not need to provide diagnostic information related to the retrieved images but just present similar images according to a certain pattern. Therefore, a CBIR system based on breast density, from a clinical point of view, may guide the radiologist on the detection of a lesion and its classification. Moreover, this system is the first step, and a very important one, for the development of a CAD system.
In this paper, we propose, implement, and evaluate a CBIR system called MammoSys. A contribution of this work is to introduce the two-dimensional principal component analysis (2DPCA) method[4]for the characterization of breast density texture, that allows for feature extraction at the same time that dimensionality reduction is performed. Two-dimensional principal component analysis overcomes principal compo-nent analysis (PCA) as it is simpler and more straightforward to use for image feature extraction since 2DPCA is directly applied to the image matrix. Retrieval is performed with the aid of a support vector machine (SVM)[5], that is able to solve a variety of learning, classification, and prediction problems.
The appropriate characterization of images together with the storage and management of the large amount of images produced by hospitals and medical centers are a main chal-lenge in the development of CBIR systems. The IRMA (Image Retrieval in Medical Applications) project2[6]deals with this kind of problems, as it aims at developing and implement-ing high-level methods for CBIR systems with prototypal application to medico-diagnostic tasks on radiological image archiving. The database has more than 10,000 mammogra-phies[7], all of them with available ground truth information that offers invaluable support to the validation of the method proposed in this work.
The remainder of this paper is divided into seven sections. Section 2 provides a brief summary of related works. Sec-tion3introduces the texture characterization of breast tissue through 2DPCA. In Section4, we explain the principles of the SVM classifier used for the retrieval task. Section5describes the experiments designed to evaluate the proposed model. In Section6, we present and discuss results, and in Section7, we state the conclusion of this work.
2 http://www.irma-project.org.
2.
Background
In the context of mammography and breast density, some works have explored the use of CBIR and CAD systems to improve knowledge and provide facilities on these modalities.
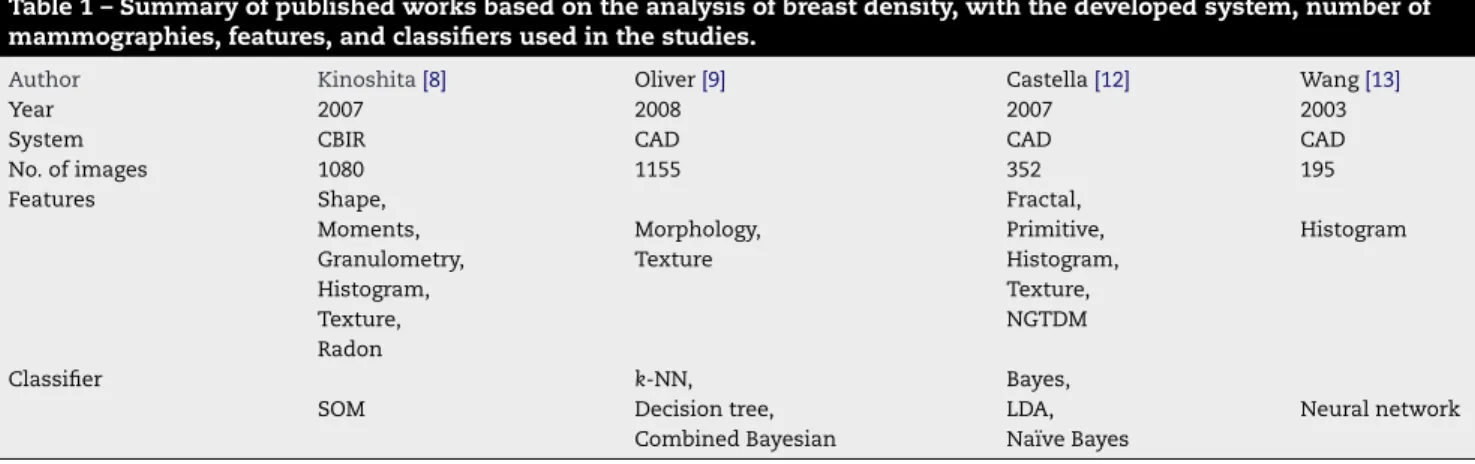
Table 1summarizes some of the published works based on breast density for classification and retrieval.
In the work of Kinoshita et al.[8], breast density is used as a pattern to retrieve images from a 1080 mammography database, available at the Clinical Hospital of the University of São Paulo at Ribeirão Preto, Brazil. Shape descriptors, tex-ture featex-tures, moments, Radon transform, granulometry, and histograms were used to characterize breast density, and the Kohonen self-organizing map (SOM) neural network was used for the retrieval task. Precision rates between 79% and 83% were obtained for 50% of recall and precision rates between 79% and 86% were obtained considering the first 25% of the retrieved images. Despite the fact that these results indicated effective retrieval, based on features such as histograms and shape, the authors concludes that additional studies would be required in order to improve all the process.
In the field of CAD systems, Oliver et al.[9]characterized breast densities using morphological and texture features in order to propose a CAD system for breast density classifica-tion. A set of 322 mammographies was obtained from MIAS (The Mammographic Image Analysis Society Digital Mam-mogram Database)3[10] database and 833 mammographies were obtained from DDSM (Digital Database for Screening Mammography)4[11] database. A decision tree classifier, k -nearest neighbor, and a combined Bayesian classification were used for classification and the best results were around 82% of correct classification for the MIAS database, and 77% for DDSM database.
Also for breast density classification, Castella et al.[12]
developed a semi-automatic method using 352 mammogra-phies from Clinique des Grangette at Geneva, Switzerland. Breast density was characterized through texture features, gray level histograms, primitives, neighborhood gray tone dif-ference matrix (NGTDM), and fractal analysis. The images were classified using Bayes classifier, Naïve Bayes classifier,
3 http://peipa.essex.ac.uk/ipa/pix/mias.
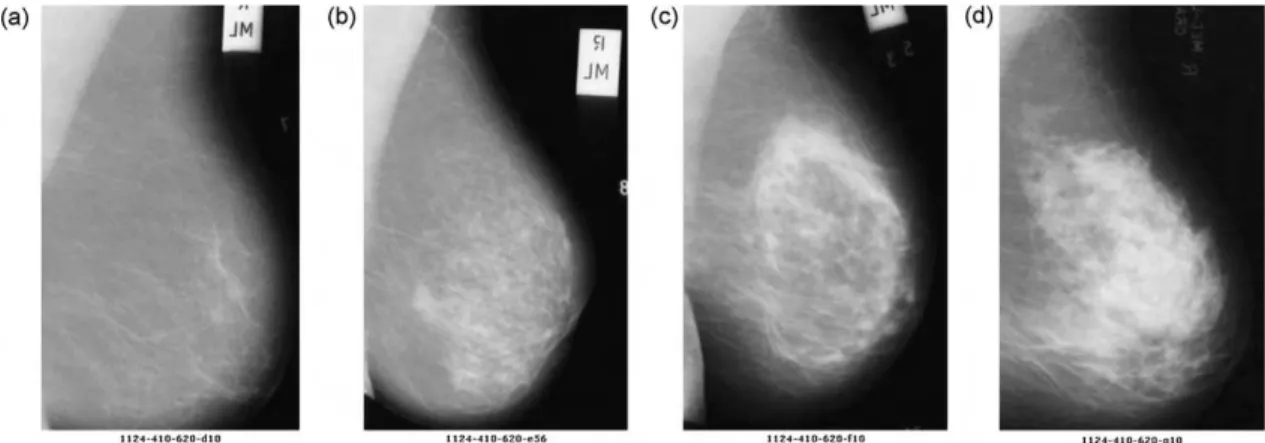
Fig. 1 – Mammographies of different breast tissues: (a) almost entirely fatty, (b) scattered fibroglandular fatty , (c) heterogeneously dense, and (d) extremely dense.
and Linear Discriminant Analysis (LDA). According to BI-RADS scale, three radiologists defined the ground truth for all images. The method resulted on 60%, 75%, and 83% of correct classification, respectively for the Naïve Bayes, Bayes, and LDA classifiers. When the number of classes was reduced to fatty and dense densities only, the results were 86%, 88%, and 90% of correct classification respectively for the Naïve Bayes, Bayes, and LDA classifiers, indicating that coarser grouping of breast density could yield more precise results.
Histograms were used for the characterization of breast density in a set of 195 mammographies at the Medical Cen-ter of Pittsburgh by Wang et al.[13], in order to automatically evaluate breast density according to BI-RADS categories. A 71% of correct classification was obtained with the use of a neural network classifier.
All the reported works agree with the importance of the proper characterization of breast density, as this is critical to the retrieval process. The most effective features used for char-acterization were extracted from the gray level histogram and texture patterns[8,13]. In CBIR systems, images are described as feature vectors and similarity is determined using mea-sures of distance or as the output of classifiers that may indicate the relevance of the retrieved images to a given query. The choice of a set of features that are able to capture pic-torial content in a way closer to human perception is still a challenge.
In the following section, we introduce the 2DPCA method for concise texture representation of breast densities. The method enables a CBIR system to help radiologists, by retriev-ing similar images for which there is a registered clinical history.
3.
Breast Density Characterization
In CBIR systems, the access to information is performed based on the visual attributes extracted from the images. The defi-nition of a set of features, capable to effectively describe each region of the image, is one of the most complex tasks in the process. In addition, the process of characterization affects all the subsequent steps of a CBIR system[14].
Images can be numerically represented by a feature vec-tor, preferentially at a low-dimensional space in which the most relevant visual aspects are emphasized[15,16]. Visu-ally, breasts of fatty and dense densities differ by gray level intensities in mammographies, as can be seen inFig. 1. In order to describe the different patterns of parenchyma tis-sue within one category, the texture attribute can be used, since texture contains information about the spatial distri-bution of gray levels and variations in brightness, turning the representation of breast density appropriate[17]. However, the high dimensionality of a feature vector that represents texture attributes limits its computational efficiency, so it is desirable to choose a technique that combines the representation of the texture with the reduction of dimensionality, in a way to turn the retrieval algorithm more effective and computationally treatable. The two-dimensional principal component analysis (2DPCA) technique is able to satisfy these requirements.
PCA is a classic feature extraction and data representation technique that aims at finding a less redundant and more compact representation of data in which a reduced number of components can be independently responsible for data vari-ation[16]. This method transforms ap-dimensional vector in anotherq-dimensional vector, by projecting the original vec-tor into a lower-dimensional basis composed ofqorthogonal axes of maximum variance, the principal components.
Differently, 2DPCA technique[4]is based on 2D matrices rather than 1D vectors, as image covariance matrices can be constructed directly using the original image matrices. The idea of 2DPCA technique is to project imageA, a matrix of size
m×npixels, ontoXby the linear transformation:
Y=AX (1)
A projectedm-dimensional vectorYis obtained and defined as the projected feature vector of imageA.
In a way to get a good projection vectorX, the trace of the covariance matrix of the projected feature vectors is obtained through the adoption of the following criterion:
J(X)=XTGX (5)
where X is a unitary column vector. The optimal projec-tion axis Xopt is the unitary vector that maximizesJ(X), i.e.
the eigenvector ofGcorresponding to the largest eigenvalue. These optimal projections vectors of 2DPCA, X1, . . . ,Xd are
used for feature extraction, wheredcorresponds to the num-ber of selected eigenvalues.
For a given imageA, let:
Yk=AXk, k=1,2, . . . , d. (6)
A family of projected featuresY1,Y2, . . . ,Ykis obtained, which
is called principal components (vectors) of the imageA. Unlike PCA, where the principal component is a scalar, with 2DPCA each principal component is a vector. The principal compo-nent vectors obtained are used to form anm×dmatrixL= [YT
1,YT2, . . . ,YTk], which is called the feature matrix or feature
image of the image A.
Some works employed 2DPCA technique for face and palm-print representation. For instance, Zuo et al.[18]proposed an assembled matrix distance metric (AMD) to measure the dis-tance between two feature matrices obtained through 2DPCA technique. Firstly, they used the ORL face database (1992) to evaluate the proposed technique in 400 images of size 112×92 pixels. Only the first four largest eigenvalues of the projected matrix of 2DPCA were chosen, which was the best result obtained among tests using from one to eight eigen-values. Comparing to other image recognition methods like Eigenfaces, Fisherfaces, and D-LDA, the recognition rate using 2DPCA and AMD achieved 96.30%, the highest one. Secondly, using the PolyU palmprint database (2004), they used 600 sub-images of size 128×128 pixels to test the efficiency of the proposed method. The authors, in this case, have chosen to keep the first 18 eigenvalues after testing eigenvalues ranging from 1 to 25. The comparison of the method was done with the three recognition methods already cited, and again 2DPCA and AMD achieved the highest recognition rate of 97.67%.
Also with the aim of image recognition, Zhao et al.[19]
introduced 2DPCA technique into the extraction of palmprint features, removing the illumination information using the w/o3 technique[20]. In this technique, in order to get rid of disturbance from different lightness conditions for palmprint collections and to lead to better recognition results, the first three largest eigenvalues were removed, as they were found to represent information related to illumination. From the PolyU palmprint database, the authors used 600 images, and
4.
Support Vector Machine for
Content-Based Image Retrieval
In this section, the support vector machine (SVM) classifier will be presented for the task of retrieval.
Image retrieval aims at retrieving, from a database, images that are relevant to a given query. The query image goes through the process of feature extraction in order to be compared to the feature vectors of all images stored in the database. The most similar images with respect to the query are retrieved and presented to the radiologist.
The support vector machine (SVM) method was developed to solve classification problems[21], but its use was extended to CBIR systems[22]. Specifically for CBIR systems of mammo-graphies, SVM was used, for instance, by Yang et al.[23]. The SVM method is a technique that guides the construction of classifiers with good degree of generalization[5], i.e., with the ability of correctly predicting the class of a sample that was not used in the learning process. In the case of CBIR systems, SVM measures the relevance of an image to a particular query
[24].
Machine learning techniques may employ an inference principle called induction, whose general conclusions are obtained from a particular set of examples. This inductive learning can be divided into two main types: unsupervised and supervised learning, which applies to SVM[16].
In unsupervised learning, there are no labeled examples. The algorithm learns how to cluster the entries according to a quality measure. In supervised learning, an external agent is used to indicate the desired answers to the entry patterns. The classifier is trained with a broad set of labeled data. In this case, given a set of labeled examples as (xi, yi), wherexi
repre-sents an example andyidenotes its label, one should be able to
produce a classifier that can precisely predict the labels of the new data. This induction process of a classifier from a sample of data is called training. The obtained classifier may also be seen as a functionf that receives a datasetxand associated labelsy. The labels or classes represent the phenomenon of interest on which one wants to make predictions. The labels can assume discrete values 1, . . . , p. A classification problem in whichp=2 is called binary.
hyper-plane. The hyperplane generated is determined by a subset of items from the two classes, called support vectors. When the set of data is linearly separable by a hyperplane, it is called a linear case of separation. The equation of an hyperplane is presented in Eq.(7), wherew·xis the inner product between vectorswandx,w∈P is the normal vector to the hyperplane and|b|/wis the perpendicular distance of the hyperplane to the origin, with the biasb∈R
f(x)=w·x+b=0 (7)
Eq.(7)divides the space data X into two regions:w·x+b >
0 and w·x+b <0. A signal functiong(x)=sgn(f(x)) can be employed to obtain the classification:
g(x)=sgn(f(x))= (8)
+1, ifw·x+b >0; −1, ifw·x+b <0.
In most cases, however, the data set cannot be precisely sep-arated by a hyperplane, so a function called kernel is used instead. It receives two pointsxiandxjfrom the input space,
according to Eq.(9), and computes the product between these data in the feature space:
Q(xi, xj)=˚(xi)·˚(xj). (9)
The most commonly used kernels are the polynomial:
Qp(xi, xj)=(ı(xi·xj)+)d (10)
and the Gaussian:
Qg(xi, xj)=exp(−xi−xj)2, (11)
where the parametersı, , din Eq.(10)andin Eq.(11)must be preset.
For more than two classes, this problem turns into a multi-class problem[25,26], which is the case of the MammoSys CBIR system. There are two basic approaches for a multi-class appli-cation. The first approach reduces the problem of multiple classes to a set of binary problems, using methods of decom-position one by class (one against all) and the separation of classes two by two (one against one).
In the one-against-all method, a SVM is built for each class through the discrimination of this class against the remaining classes. The number of SVMs used in this method isM. Test dataxare classified using a decision strategy, i.e., the class with the maximum value for the discriminant functionf(x) is assigned to the data. All thentraining examples are used to construct the SVM for one class. The SVM for one classpis built using the set of training data (x) and the desired outputs (y).
In the one-against-one method, a SVM is built for a pair of classes through training, for the discrimination of two classes. In this way, the number of SVMs used in the method isM(M− 1)/2. One SVM for a pair of classes (p, m) is built using training examples belonging only to these classes.
The second approach is a generalization of the binary clas-sification to more than two classes and one of the methods that uses this approach is the method of Crammer and Singer
[25]. In this method all the training examples are used at the same time.
MammoSys CBIR system is a multi-class problem that uses the one-against-one method, separating the four breast den-sity categories two by two for classification and retrieval.
In the following section, the experiments for the develop-ment of the proposed system are presented.
5.
Experiments
The MammoSys system was implemented using MatLab (Matrix Laboratory) through the image processing and sym-bolic math toolboxes, and the LIBSVM library[27]. Feature extraction was performed on an Intel Core2Quad 2.66 GHz pro-cessor with 8 GB of RAM under Microsoft Windows operating system and image retrieval was executed on an Intel Core2Duo 2 GHz processor with 3 GB of RAM, also under Microsoft Win-dows operating system.
The mammographies used in this work are taken from the database of radiological images of the IRMA project that were generated using several film digitizers (the reader is referred to
[7]for acquisition details). In the IRMA project, all images are coded according to a mono-hierarchical, multi-axial coding scheme[28], and this codification provides the ground truth of all mammographies, as all the images have been previ-ously verified by an experienced radiologist. The size of the images varies from 1024×300 pixels to 1024×800 pixels. For the application of the 2DPCA technique, it is necessary that all the images have the same size. Therefore, from each image, a region of interest (ROI) of size 300×300 pixels was extracted through an automatic process, from both cranio-caudal (CC) and medio-lateral (MLO) views. This allows for the selection of regions containing only breast tissue, excluding artifacts such as annotation and exam labels from mammographies.
Although the IRMA database offers more than 10,000 images, they are not equally distributed in all categories. For instance, there are 1396 images in BI-RADS I category and 2023 images in BI-RADS IV category. So, in a way to perform the experiments more accurately without favoring a specific category, we selected a total of 5024 images. Additionally, the selection was performed so as to consider the direction (right and left) for breast imaging and the anatomy (CC and MLO) of the breast. Experiments were performed using the following number of images, for each BI-RADS breast density category and in a way to consider the direction (right and left) for breast imaging and anatomy (CC and MLO) of the breast: 314 images from CC and right breast; 314 images from CC and left breast; 314 images from MLO and right breast; and 314 images from MLO and left breast, in a total of 1256 images for each one of the four BI-RADS categories.
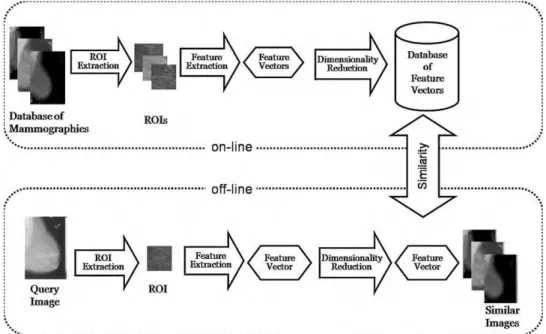
The methodology applied to the experiments is depicted in
Fig. 2, and the steps followed for the development of the CBIR system were:
Fig. 2 – MammoSys CBIR system scheme. In the off-line stage of the system, the images of the database are processed and characterized as vectors in a lower-dimensional feature space. The on-line stage comprehends the processing of the query and the search for similar images in the database.
covariance matrix were used in the experiments: 1 to 10, 15, and 20. These values were chosen in order for the results to be compared to previous works[18].
Step 2→Measurement of similarity between images: SVM was used to indicate the relevance of the images to a certain query. Using the LIBSVM library, that deals with unbalanced data, a 10-fold cross validation was performed and the tests were done using the polynomial kernel.
Step 3→Evaluation of the CBIR system: Measures of pre-cision and recall were obtained and the average prepre-cision for 10% of recall was chosen, since radiologists pay more attention to the top returned images.
The performance of 2DPCA technique was compared to the ones using principal component analysis (PCA) and singular value decomposition (SVD) for breast density characteriza-tion, as these two techniques are also able to represent texture and reduce the dimensionality of the feature vector. SVM was evaluated for the task of image retrieval.
6.
Results and Discussion
Table 1lists the execution time of the MammoSys system, comparing the breast tissue characterization using 2DPCA, PCA, and SVD for different values of d. 2DPCA took more time to execute the retrieval, as expected, since each principal component is a vector, while for PCA and SVD each princi-pal component is a scalar. Also, withd=1, . . . ,4, 2DPCA was slower than for others values. Machine learning algorithms like SVM are influenced by data, i.e., the number of features may degrade computational performance. If the number of features is too small or not significant, the support vectors may not be able to correctly separate the data and indicate the rel-evance of the images, therefore taking more time in this task. Also, there was no significant difference between the values of
the second, third, and fourth principal components of 2DPCA, and this may have delayed convergence in the computation of the hyperplane that separates data.
The average precision, for alldfirst values, comparing the breast tissue characterization using 2DPCA, PCA, and SVD, and with SVM for the retrieval task, is listed inTable 3.
It can be observed fromTable 3that 2DPCA overcame PCA and SVD for all the values of parameterd. The highest value was 97.83% of average precision for the first five principal com-ponents of 2DCPA. That also, according toTable 1, was the fastest on the retrieval task. This suggests that the choice of few principal components allies images characterization with dimensionality reduction of the feature vector.
For 2DPCA technique, the average precision was not constant for all d values. The insertion of more principal components could be considered as confounders, since the diagonal matrix that contains these principal components
Table 2 – Execution time, in seconds, for the CBIR system, using 2DPCA, PCA, and SVD for breast density characterization.
d 2DPCA PCA SVD
1 809.4 10.1 11.2
2 720.8 10.6 11.4
3 705.9 11 12.1
4 448.2 11.3 12.8
5 154 11.5 12.8
6 156.1 12.2 13.9
7 157.3 12.5 14.7
8 167.1 13.1 14.8
9 215.4 13.4 14.9
10 221 16.2 18.1
15 274.5 16.2 19.3
Table 3 – Average precision for the selecteddfirst eigenvalues.
d 2DPCA SVD PCA
1 83.86% 65.93% 67.86%
2 86.03% 74.23% 68.30%
3 87.96% 77.5% 69.05%
4 90.87% 78.49% 69.56%
5 97.83% 78.27% 69.98%
6 97.67% 78.23% 69.8%
7 97.09% 78.36% 70.39%
8 97.00% 78.39% 70.27%
9 96.46% 78.63% 70.24%
10 96.22% 79.01% 70.45%
15 95.50% 80.31% 70.44%
20 93.85% 80.83% 70.86%
hasd values that are significantly higher than others, and they are ordered from the highest to the lowest values. The lowest values are close to zero and can be considered insuffi-cient to properly characterize the images, explaining the fact that average precisions decrease as the number of principal components increases. Also, the retention of few principal components may be not enough for a good breast tissue char-acterization. For the SVD and PCA techniques, for which the principal components are scalars and not vectors as in 2DPCA, the use of few principal components is not enough for breast tissue characterization. In this case, greater numbers of prin-cipal components will provide better average precision.
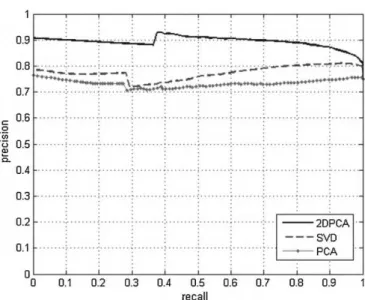
Fig. 3shows the average precision and recall curve using the first five principal components for 2DPCA, PCA, and SVD for breast density characterization and SVM for image retrieval. The texture of breast tissue was better represented by the features extracted using 2DPCA, which was able to capture
Fig. 3 – Precision×recall curve for the average precision
using the first five principal components for breast density characterization, 2DPCA, SVD, and PCA for breast density characterization and SVM for image retrieval.
the difference between the gray level intensities of the breast densities. Concerning 2DPCA, for 10% of recall, a precision of 90% means that from 502 mammographies returned by the MammoSys CBIR system, 452 were relevant for the user.
Fig. 4shows an example of a query image from breast den-sity category BI-RADS I and retrieved images based on the first five values for the 2DPCA-SVM design. All the retrieved images are not only from the same BI-RADS category of the query image but they share the same view (CC) and direction
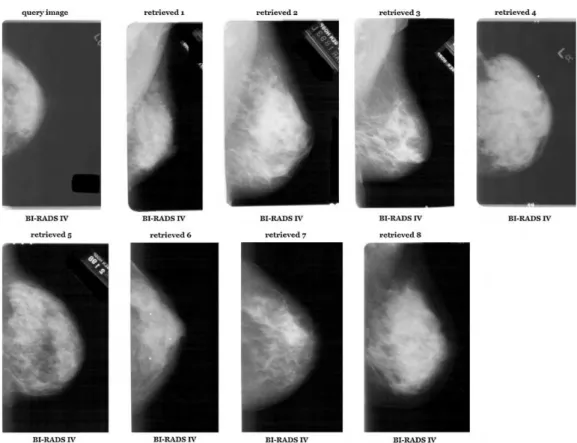
Fig. 5 – Second retrieval example of one query of the MammoSys system using the first five eigenvalues for 2DPCA and SVM with polynomial kernel.
(right breast). Another example of retrieval is depicted inFig. 5, using a BI-RADS IV image. Even though all the retrieved images are from the same category of the query image and from the same direction (right), they are from different views: Retrieved images 1, 2, 3, and 8 are from MLO view while the others are from CC view. This may occur due to the fact that the ROI selected from these MLO images contains a good portion of pectoral muscle that was confused with the white part of the breast density. The texture attribute was not able to differen-tiate these gray level intensities, for this particular BI-RADS category.
7.
Conclusion
In this paper we presented a CBIR system that uses breast density as a pattern for image retrieval and is able to aid radiologists in their diagnosis. MammoSys can also be seen as a pre-processing stage of a CAD system for breast lesions detection. In the proposed system, ROIs containing only breast density were characterized using 2DPCA, a novel and promising method for the characterization texture in low-dimensional feature spaces. Experiments were designed to choose the best number of principal components that would be able to effectively represent texture. Furthermore, the retrieval of the mammographies was performed by SVM, enabling the development of a system that can really aid radi-ologists in their diagnosis. Another important characteristic of the MammoSys CBIR system is the availability of prior breast density classification, as all the images contained in the IRMA
database have their ground truth already set by an experi-enced radiologist.
Although the results of the proposed method are superior when compared to the average precision of related works, they could be improved if texture attributes were used together with the gray level histogram, which is also able to capture differences between breast tissues. This could be done by con-catenating these attributes – histogram and texture, at the feature vector, with proper weighting of their importance to breast tissue representation. Also, other similarity measures may be investigated, in a way to define the most appropri-ated one to this specific problem and to the feature vectors determined by the proposed method.
Future works may additionally consider other patterns for retrieval, such as breast lesions, masses and calcifications, characterized by size and shape. Breast lesions may be used together with breast density, providing a more instructive CBIR system for radiologists, as more information may become available to support diagnosis.
Acknowledgements
r e f e r e n c e s
[1] J.N. Wolfe, Breast patterns as an index of risk for developing breast cancer, American Journal of Roentgenology (1976) 1130–1139.
[2] A. del Bimbo, Visual Information Retrieval, Morgan Kaufmann Publishers Inc., 1999.
[3] H. Müller, N. Michoux, D. Bandon, A. Geissbuhler, A review of content-based image retrieval systems in medical applications – clinical benefits and future directions, International Journal of Medical Informatics 73 (2004) 1–23. [4] J. Yang, D. Zhang, A.F. Frangi, J. Yang, Two-dimensional PCA:
a new approach to appearance-based face representation and recognition, IEEE Transactions on Pattern Analysis and Machine Intelligence 26 (1) (2004) 131–137.
[5] V.N. Vapnik, The Nature of Statistical Learning Theory, Springer-Verlag, New York, 1995.
[6] T.M. Lehmann, M.O. Güld, C. Thies, B. Fischer, K. Spitzer, D. Keysers, H. Ney, M. Kohnen, H. Schubert, B. Wein,
Content-based image retrieval in medical applications, Methods of Information in Medicine 43 (4) (2004) 354–361. [7] J.E.E. de Oliveira, M. Güld, A.A. Araújo, B. Ott, T.M. Deserno,
Towards a standard reference database for computer-aided mammography, Proceedings of SPIE Medical Imaging 6915 (69151Y) (2008).
[8] S.K. Kinoshita, P.M.A. Marques, R.R. Pereira, J.A.H. Rodrigues, R.M. Rangayyan Jr., Content-based retrieval of
mammograms using visual features related to breast density patterns, Journal of Digital Imaging 20 (2) (2007) 172–190. [9] A. Oliver, J. Freixenet, R. Martí, J. Pont, E. Pérez, E.R.E. Denton,
R. Zwiggelaar, A novel breast tissue density classification methodology, IEEE Transactions on Information Technology in Biomedicine 12 (1) (2008) 55–65.
[10] J. Suckling, The Mammographic Image Analysis Society digital datagram database, Exerpta Medica International Congress Series 1069 (1994) 375–378.
[11] M. Heath, K. Bowyer, D. Kopans, Current status of the digital database for screening mammography, in: Digital
Mammography, Kluwer Academic Publishers, 1998, pp. 457–460.
[12] C. Castella, K. Kinkel, M.P. Eckenstein, P.E. Sottas, F.R. Verdun, F.O. Bochud, Semiautomatic mammographic parenchymal patterns classification using multiple statistical features, Academic Radiology 14 (2007) 1486–1499.
[13] X.H. Wang, W.F. Good, B.E. Chapman, Y.H. Chang, W.R. Poller, T.S. Chang, L.A. Hardesty, Automated assessment of the composition of breast tissue revealed on
tissue-thickness-corrected mammography, American Journal of Roentgenology 180 (2003) 257–262.
[14] R. Baeza-Yates, B.R. Neto, Modern Information Retrieval, Addison-Wesley Professional, 1999.
[15] V. Castelli, L.D. Bergman, Image Databases – Search and Retrieval of Digital Imagery, Wiley-Interscience, 2001. [16] R.O. Dudda, P.E. Hart, D.G. Stork, Pattern Classification, John
Wiley Sons, 2001.
[17] R.C. Gonzalez, R.E. Woods, S.L. Eddins, Digital Image Processing using Matlab, Prentice-Hall, 2003.
[18] W. Zuo, D. Zhang, K. Wang, An assembled matrix distance metric for 2DPCA-based image recognition, Pattern Recognition Letters 27 (2006) 210–216.
[19] Z.Q. Zhao, D.S. Huang, W. Jia, Palmprint recognition with 2DPCA + PCA based on modular neural networks, Neurocomputing 71 (2007) 448–454.
[20] P.N. Belhumeur, J.P. Hespanha, D.J. Kriengman, Eigenfaces vs. Fisherfaces: recognition using class specific linear
projections, IEEE Transactions of PAMI 19 (7) (1997) 711–720. [21] M.F. Akay, Support vector machines combined with feature selection for breast cancer diagnosis, Expert Systems with Applications 36 (2009) 3240–3247.
[22] W.T. Wong, S.H. Hsu, Application of SVM and ANN for image retrieval, European Journal of Operational Research 173 (2006) 938–950.
[23] L. Yang, R. Jin, R. Sukthankar, B. Zheng, L. Mummert, M. Satyanarayanan, M. Chen, D. Jukic, Learning distance metrics for interactive search-assisted diagnosis of mammograms, Proceedings of SPIE 6514 (65141H) (2007). [24] C.J. van Rijsbergen, Information Retrieval, Butterworth & Co.,
1979.
[25] K. Crammer, Y. Singer, On the learnability and design of output codes for multiclass problems, Computer Learning Theory (2000) 35–46.
[26] C.W. Hsu, C.J. Lin, A comparison of methods for multiclass support vector machines, IEEE Transactions on Neural Networks 13 (2002) 415–425.
[27] C.C. Chang, C.J. Lin, LIBSVM: a library for support vector machines, 2001. Software available at
http://www.csie.ntu.edu.tw/ cjlin/libsvm.