Tree Plantation Will Not Compensate Natural Woody
Vegetation Cover Loss in the Atlantic Department of
Southern Benin
M.S. Toyi1*
, Y.S.S. Barima2
, A. Mama1,3
, M. André4
, J.-F. Bastin3,4
, C. De Cannière3
, B. Sinsin1
& J. Bogaert4
Keywords: Land use and land cover change- Probability matrix- First-order Markov model- Tree plantation- Benin
Mots clés: Changement d’occupation et d’utilisation du sol- Matrice de probabilité- Modèle de Markov de premier ordre- Plantation forestière- Bénin
Summary
This study deals with land use and land cover changes for a 33 years period. We assessed these changes for eight land cover classes in the south of Benin by using an integrated multi-temporal analysis using three Landsat images (1972 Landsat MSS, 1986 Landsat TM and 2005 Landsat ETM+). Three scenarios for the future were simulated using a first-order Markovian model based on annual probability matrices. The contribution of tree plantations to compensate forest loss was assessed. The results show a strong loss of forest and savanna, mainly due to increased agricultural land. Natural woody vegetation (“forest”, “wooded savanna” and “tree and shrub savanna”) will seriously decrease by 2025 due to the expansion of agricultural activities and the increase of settlements. Tree plantations are expected to double by 2025, but they will not compensate for the loss of natural woody vegetation cover. Consequently, we assist to a continuing woody vegetation area decrease. Policies regarding reforestation and forest conservation must be initiated to reverse the currently projected tendencies.
Résumé
Les plantations forestières ne compenseront pas les pertes de végétations naturelles boisées dans le Département de l’Atlantique au sud du Bénin
La présente étude traite des processus de changements d’occupation et d’utilisation du sol sur une durée de 33 années. Ces changements ont été évalués pour huit classes d’occupation du sol au sud de Bénin à partir d’une analyse multi-temporelle de trois images satellitaires de type Landsat MSS 1972, Landsat TM 1986 et Landsat ETM+2005. Trois scénarii ont été simulés à partir d’une chaîne de Markov de premier ordre basée sur des matrices de probabilité. La contribution des plantations forestières en vue de compenser les pertes de végétation naturelle a été évaluée. Les résultats indiquent une perte importante des végétations naturelles boisées (“forêt”, “savane boisée” et “savanes arborée et arbustive”), principalement due à une augmentation des superficies agricoles. Les végétations naturelles boisées seront drastiquement réduites jusqu’en 2025 au profit des exploitations agricoles et des habitations. Les plantations forestières pourraient doubler leur superficie en 2025, mais elles ne pourront pas compenser les pertes de végétation naturelle boisée. Par conséquent, on assistera à une dégradation constante des végétations naturelles boisées.Des politiques de développe-ment durable basées sur le reboisement et la conservation des forêts doivent être initiées en vue d’inverser les tendances actuelles.
1 Université d’Abomey-Calavi, Faculté des Sciences Agronomiques, Laboratoire d’Ecologie Appliquée, Cotonou, Bénin. 2 Université Jean Lorougnon Guédé, Unité de Formation et de Recherche en Environnement, Daloa, Côte d’Ivoire.
3 Université Libre de Bruxelles, Ecole Interfacultaire de Bioingénieurs, Service d’Ecologie du Paysage et Systèmes de Production Végétale, Bruxelles, Belgique.
Introduction
Demographic pressure, urbanization and traditional shifting agriculture are the main causes of landscape changes which may have a long-term impact on sustainable food production, forest resources, climate and hence, human welfare (3, 10, 19, 25). The Atlantic Department in Benin constitutes an important agricultural and economic centre. This situation reinforces the annual net decrease in vegetation cover area estimated at 2.5 % (18). Is reforestation initiated by the government able to compensate this alarming degradation? Since this is still an open question, the assessment of changes occurring in land cover is an important issue enabling the improvement of the management of the ecosystems and their services (26).
Land use and land cover change analysis, using satellite imagery and geographic information systems (GIS) is a basic tool in assessing the environmental consequences of human activity (6, 11, 16). In this study, land cover is the bio-geophysical state of the Earth’s land surface including biota, soil, topography and other aspects focusing on the conversion of one land cover class
into another (33). Land use involves the mechanisms by which the bio-geophysical attributes of a land are changed (34). To assess the possibilities for natural vegetation conservation, future scenarios are explored using a Markov model (7). This study aims to use satellite imagery and GIS analysis to quantify landscape changes from 1972 to 2005 and to predict land cover changes till the year 2025.
Methods
Study area
The south of Benin (Atlantic Department) is located within the Region of Interest (ROI) between 6°25’- 7°00’N and 1°30’- 2°36’E (Figure 1). Ferrallitic soils of red hue represent the most frequently occurring soil type. The Guinean vegetation types with varying land cover categories characterize this ROI (2). Agriculture is the main activity in this ROI which also represents nearly 60% of the population and hence undergoes a strong anthropogenic pressure (18).
Data acquisition and image analysis
Three images of Landsat Multi-Spectral Scanner (MSS, 1972), Landsat Thematic Mapper (TM, 1986) and Landsat Enhanced Thematic Mapper Plus (ETM+, 2005) were processed (12). Acquisition took place during the dry season to minimize variations in vegetation phenology. The 13 classes obtained after an unsupervised classification (10) of the 2005 image using the ISODATA algorithm of the ENVI 4.1 software, were merged into 11 classes by visual interpretation based on local expertise, radiometric characteristics and existing vegetation maps.
From the 2008 National Forest Inventory database, we adopted eight classes: forest, wooded savanna, tree and shrub savanna, degraded savanna, tree plantation, agroforestry oil palm plantation, field and fallow and settlement (including bare soil and roads). We added three classes: swampy meadow, water surface, and a class representing cloud cover ; the latter was excluded for further analysis to avoid bias. In addition, swampy meadow and water surface were excluded for the good of the study. To assess classification accuracy, 586 reference points were chosen using a stratified sampling scheme.
A confusion matrix and a Kappa coefficient (κ) were established (14). The 2005 image was assessed for accuracy, assuming that similar patterns hold for the classification of the other Landsat scenes. The spectral features obtained after this classification were used to classify the 1972 and 1986 images using the Maximum Likelihood Algorithm.
Land use change analysis
The classified images were incorporated into ArcGis 9.3 software for change assessment. To allow a comparative analysis between dates based on the same area and to avoid bias, a mask was generated to eliminate the classes “no data”, “swampy meadow” and “water surface” (23). The resulting remaining area is 2494.80 km² for further analysis. The changes concerned: vegetation cover loss (from forest to the other classes, from savannas to plantations or fields or from tree to shrubs, to weed and to settlements); vegetation regeneration (pathways of change which flow in the opposite case of loss) and unchanged. Three maps were generated: from 1972 to 1986, from 1986 to 2005 and from 1972 to 2005. A minimum mapping unit of 490 m² was applied using the “Dissolve by area” function of Arcview 3.2 to homogenize the precision of the maps. To quantify land use changes between two dates, a change rate (Cr)
was calculated for each land cover class :
C
r=
A
2−
A1
A
1×
100
(I)where A1 and A2 are, respectively, the initial and
final land cover area. Positive values of Cr indicate
an increase of class area and negative values indicate a loss. Transition matrices were elaborated with the information of classes to describe land use changes (31).
Scenarios for the future
Transition matrices were standardized to obtain an annual probability matrix P. The area proportions of classes during the initial year were put in a state vector MA(t). By considering land cover as a
stochastic process (29) and its changes as states of a Markov model (21, 36), the proportion that can be reached at a given time t+1 by the first-order model is MA(t) x P= MA(t+1).
Three different scenarios are developed for the period 2006-2025. The first scenario assumed that the changes observed for the period 1972-1986 would occur unaltered until 2025. The second scenario assumed that the probabilities recorded for the period 1986-2005 were sustained. The third scenario assumed that the long-term change probabilities of change would be those recorded from 1972 to 2005. The accuracy was assessed by testing the model with data not used to construct it (21). Hence, the area proportions expected from the model for 2005, based on the (1972-1986) scenario are compared with those of the 2005 map. The proportions expected for 1986 based on the (1972-2005) scenario are compared with those of the 1986 map. The
χ
2 test was used with (m-1) degrees of freedom at a threshold of 5% and m equal to the number of land cover classes (7).Results
Landscape composition
giving the way to “Degraded savanna”. “Tree plantation” occupies 10.7% in 1972 and 26.4% of the total area in 2005.
Land cover change
Table 3 shows the transition matrices for the three periods. Numbers represent landscape fractions persisting within a given category (values on the diagonal) or undergoing transformation to another class. Classes are ordered along a gradient of increasing anthropogenic impact so that values under the diagonal represent vegetation regeneration and those above it vegetation cover loss. Whatever the period considered, natural woody vegetation is to a large extent converted into “Tree plantation” and into agricultural land which
increase significantly. Regeneration occurs to a lesser extent as shown in figure 3.
Model validation and scenarios for the future
The
χ
2test for the comparison of observed and simulated proportions for 1986 and 2005 did not show significant differences (
χ
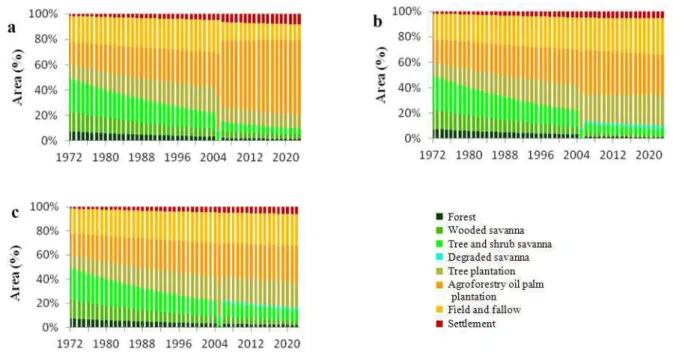
2<14,07; p>0,05). Hence, the model can be applied to assess scenarios of which the dynamics (1972-1986; 1986-2005 or 1972-1986-2005) hold for the future (Figure 4). It is important to emphasize the specific case of the 2005 data in this figure where values are those really observed in the image. We make this exception for the year 2005 to bring out the fact that “Wooded savanna” is absent from the landscape in this year.
Table 1
Confusion matrix for the classification accuracy assessment (Atlantic Department, Benin, Landsat ETM+ 2005 image). All the values are expressed in percentage of the total number of pixels.
Classif ication
Forest
Forest 61.23 0.00 3.45 8.17 6.70 3.45 6.54 0.00
0.00 0.00 0.00 0.00 0.00 0.00 0.00 0.00
10.44 0.00 83.41 0.88 1.87 0.00 1.02 0.00
17.24 0.00 6.32 83.24 2.96 3.61 5.52 0.00
9.06 0.00 2.29 3.09 82.70 1.30 2.04 0.00
0.00 0.00 0.00 0.00 0.11 90.36 2.87 0.00
2.06 0.00 4.57 3.75 5.41 1.41 75.86 3.63
0.00 0.00 0.00 0.00 0.00 0.00 2.07 96.66
Ground truth
Wooded savanna
Tree and shrub savanna
Degraded savanna
Tree plantation
Agrof orestry Oil palm plantation
Field and
f allow Settlement
Wooded savanna
Tree and shrub savanna
Degraded savanna
Tree plantation
Agrof orestry oil palm plantation
Field and f allow
Settlement
Table 2
Landscape composition in 1972, 1986 and 2005 (Atlantic Department, Benin) and change rates for 1972-1986, 1986-2005, and 1972-2005. Values are expressed in area (km²) and in percentage of the total landscape area.
Change (%)
1972 1986 2005
1972-1986 1986-2005 1972-2005
km² % km² % km² %
Forest 184.23 7.38 81.96 3.29 14.81 0.59 -55.51 -81.93 -91.96
391.92 15.71 211.16 8.46 0.00 0.00 -46.12 -100.00 -100.00
655.53 26.28 286.59 11.49 158.99 6.37 -56.28 -44.52 -75.75
0.00 0.00 0.00 0.00 43.60 1.75 - -
-266.12 10.67 308.68 12.37 659.42 26.43 15.99 113.63 147.79
446.90 17.91 1035.63 41.51 827.48 33.17 131.74 -20.10 85.16
509.17 20.41 465.41 18.66 664.96 26.65 -8.59 42.88 30.60
40.93 1.64 105.38 4.22 125.53 5.03 157.46 19.12 206.69
Land cover classes
Years
Wooded savanna
Tree and shrub savanna
Degraded savanna
Tree plantation
Agrof orestry oil palm plantation
Field and f allow
In fact, the simulated values of “Wooded savanna” in 2005 (1.6%, 0.9% and 1.6% respectively for the dynamics 1972-1986; 1986-2005 and 1972-2005) show its presence to some extent. Apart from this exception for the year 2005, the simulation normally takes its course, hence the similarity between the 2004 and 2006 data.
Assuming a persistence of the landscape dynamics
recorded for the period 1972-1986, natural woody vegetation would lose 40.3% of the landscape area by 2025 while “Tree plantation” would gain only 1.2% of the total area. If the dynamics recorded for 1986 to 2005 were to hold, the natural woody vegetation would lose 16.4% of the ROI area while “Tree plantation” would gain 11.8% by 2025. Natural woody vegetation would lose 36.2% of the total area while “Tree plantation” would gain 10.9% Figure 2: Land-cover maps of the study area (Atlantic Department, Benin) for 1972,
1986 and 2005 and based upon Landsat images. The land cover class corresponding to “No data” was excluded from the land use/land cover analysis to avoid bias; “Swampy meadow” and “Water” areas were not included in the change analysis in order to enable comparison of the three maps.
by 2025 if the dynamics recorded from 1972 to 2005 were to continue. Whatever the dynamics considered, woody areas would lose more than “Tree plantation” could gain by 2025.
Discussion
Our results show a significant natural vegetation cover loss from 1972 to 2005, due to the increase of agricultural land area. This tendency was observed in other regions of Africa as well (6, 8, 10, 28). The extensions of villages and road networks, inappropriate agricultural practices and wood extraction have a significant impact on this area
loss (5, 9, 15, 37). The loss of natural woody area has negative implications on the environment (loss of biodiversity, increased emissions of carbon dioxide to the atmosphere and impacts on climate and soil) as well as on economy and society welfare (1, 17, 24). The specific case of natural woody vegetation cover loss into “Tree plantation” is the result of complex processes. In fact, the Forestry Administration and other landowners intensify agroforestry planting activities to compensate for woody cover losses. However, the “Tree plantation” class cannot replace the ecosystem services provided by natural forests (7). Table 3
Transition matrix for the areas (in percent) of the land cover classes for the three time periods observed (1972-1986, 1986-2005, 1972-2005). Each value of the table corresponds to the fraction of the landscape converted within a period. Values on
the diagonal denote class proportion stability during the period analyzed (Atlantic Department, Benin).
Fo = Forest; Ws = Wooded savanna; Ts = Tree and shrub savanna; Ds = Degraded savanna; Tp = Tree plantation; Op = Agroforestry oil palm plantation; Ff = Field and fallow; Se = Settlement.
1986
Ts Op Se
1.79 1.43 0.77 0.00 0.78 0.92 1.62 0.07 0.41 4.16 0.36 0.00 1.29 6.75 2.53 0.22 Ts 0.84 2.26 9.55 0.00 2.09 9.50 0.96 1.08
1972 0.00 0.00 0.00 0.00 0.00 0.00 0.00 0.00
0.16 0.11 0.16 0.00 7.26 2.63 0.32 0.02 Op 0.02 0.20 0.23 0.00 0.68 16.11 0.49 0.19 0.07 0.30 0.42 0.00 0.27 5.57 12.73 1.05 Se 0.00 0.00 0.00 0.00 0.00 0.03 0.01 1.59
2005
Ts Op Se
0.35 0.00 1.00 0.04 0.29 0.42 1.13 0.06 0.03 0.00 1.18 0.56 4.57 0.55 1.43 0.15 Ts 0.00 0.00 2.73 0.18 4.52 0.38 3.40 0.27
1986 0.00 0.00 0.00 0.00 0.00 0.00 0.00 0.00
0.05 0.00 0.42 0.20 6.35 2.22 3.10 0.04 Op 0.15 0.00 0.55 0.42 7.92 27.53 4.50 0.43 0.00 0.00 0.39 0.35 2.71 2.01 12.68 0.51 Se 0.01 0.00 0.09 0.00 0.09 0.06 0.40 3.58
2005
Ts Op Se
0.17 0.00 1.06 0.38 1.68 1.36 2.61 0.13 0.10 0.00 0.65 0.21 6.92 5.03 2.54 0.24 Ts 0.12 0.00 3.80 0.59 6.85 10.10 3.40 1.42
1972 0.00 0.00 0.00 0.00 0.00 0.00 0.00 0.00
0.05 0.00 0.23 0.09 5.68 1.96 2.63 0.03 Op 0.07 0.00 0.33 0.21 2.62 11.29 2.99 0.40 0.08 0.00 0.30 0.26 2.67 3.42 12.46 1.22 Se 0.00 0.00 0.00 0.00 0.01 0.01 0.03 1.59
Fo Ws Ds Tp Ff
Fo Ws
Ds Tp
Ff
Fo Ws Ds Tp Ff
Fo Ws
Ds Tp
Ff
Fo Ws Ds Tp Ff
Fo Ws
Ds Tp
The scenarios of the future show an increase in agricultural land while natural woody vegetation declines. “Tree plantation” would double its area by 2025. However, the significant increase in “Tree plantation” cannot compensate for the natural vegetation cover losses, whatever the base period selected for the model. Forest conservation,
sustained reforestation and participative
management are therefore crucial to preserve biodiversity and other services from (natural) forests (27).
Landsat imagery is useful in the identification of land cover classes despite their relative low resolution. Our study provides an integrated approach with a detailed multi-temporal analysis, useful in evaluating the current dynamics in the study area. In figure 4, the actual data of 1972, 1986 and 2005 are given together with the simulated data for the years in between them. Therefore, the year 2005 looks rather exceptional when compared to the adjacent years.
Nevertheless, the coherent smooth trends suggest indirectly the validity of the simulations. It should be noted, however, that the determination of annual transition probabilities remains subject to debate (32).
The first-order Markov model used is based on the
hypothesis that variable and potential factors influencing landscape dynamics remain unaltered for the periods 1986, 1986-2005 or 1972-2005. This hypothesis assumes that transition matrices are stationary (21). In fact, the results of simulation show that the loss of “Wooded savanna” is progressive in the landscape, contrary to the reality observed in the 2005 map where this class completely disappears. In addition, first-order Markov models do not take into account the history of land cover change, moreover, such models are not spatially explicit (4, 20).
Spatially explicit models must be used in the future, which take socio-environmental variables (such as demographic data) into account to reach a better understanding of the causes, locations and pathways of observed and simulated vegetation dynamics (35). Nevertheless, the first-order Markov model is useful for an exploratory analysis and to depict contrasting scenarios. Furthermore, its limitations are well understood (7, 13, 22). Overall, the trends observed did provide precise information on land cover changes.
Conclusion
Through a detailed analysis of land use and land cover change from 1972 to 2005, landscape dynamics were assessed in the Benin Atlantic Figure 4: Simulation of the evolution of land-cover classes within the study area (Atlantic Department, Benin) under three future
Department, using Landsat imagery and GIS. The main driver of land cover change is anthropogenic pressure. Our study shows the importance of a multi-temporal approach and the pertinence of discrimination between the different pathways of change.
The first-order Markov model used to explore future trends shows a slightly positive impact due to the increase in “Tree plantation” by 2025. However, this increase does not compensate for the loss of the natural woody vegetation cover. Policies regarding the promotion of tree planting and forest conservation must be initiated to reverse the evolution described. Another challenge is to analyse the spectral signature of an important
forest tree species, e.g., teak (Tectona grandis L.f) to permit its rigorous monitoring.
Acknowledgements
The authors thank the CUD-PIC “Contribution au développement d’une filière du teck au départ des forêts privées du Sud Bénin (Département Atlantique)”. Dr. Peter Neuenschwander (International Institute of Tropical Agriculture, Benin) helped us for improving the manuscript. The research of J.-F. Bastin is supported by the FRIA/FNRS and by the Ecole Régionale post-universitaire d'Aménagement et de gestion Intégrée des Forêts et Territoires tropicaux (ERAIFT, UNESCO, Kinshasa, D.R. Congo).
Literature
1. Achard F., Eva H.D., Mayaux P., Stibig H.-J. & Belward, A., 2004, Improved estimates of net carbon emissions from land cover change in the tropics for the 1990s. Global Biogeochemical Cycles, 18, 1-11.
2. Adjanohoun E.J., Adjakidjè V., Ahyi M.R.A., Ake Assi L., Akoègninou A., d’Almeida J., Apovo F., Boukef K., Chadare M., Cusset G., Dramane K., Eyme J., Gassita J.-N., Gbaguidi N., Goudote E., Guinko S., Houngnon P., Issa L.O., Keita A., Kiniffo H.V., Kone-Bamba D., Musampa Nseyya A., Saadou M., Sodogandji Th., de Souza S., Tchabi A., Zinsou Dossa C. & Zohoun Th., 1989, Contribution aux études ethnobotaniques et floristiques en République Populaire du Bénin. Agence de Coopération Culturelle et techniques, Paris, 895 p.
3. Alignier, A., 2010, Distribution des communautés végétales sous l’influence des lisières forestières dans des bois fragmentés. Thèse de doctorat. Institut National Polytechnique de Toulouse, Université de Toulouse. 239 p. 4. Baker W.L., 1989, A review of models of landscape change.
Landscape Ecology, 2, 2, 111-133.
5. Bamba I., Yedmel M.S. & Bogaert J., 2010, Effets des routes et des villes sur la forêt dense dans la Province Orientale de la République Démocratique du Congo. European Journal of Scientific Research, 43, 3, 417-429.
6. Barima Y.S.S., Barbier N., Bamba I., Traore D., Lejoly J. & Bogaert J., 2009, Dynamique paysagère en milieu de transition forêt-savane ivoirienne. Bois et Forêts des tropiques, 299, 1, 15-25.
7. Barima Y.S.S., Egnankou M.W., N’doumé C.T.A., Kouamé F.N. & Bogaert J., 2010, Modélisation de la dynamique du paysage forestier dans la région de transition forêt-savane à l’Est de la Côte d’Ivoire. Télédétection, 9, 2, 129-138. 8. Bogaert J., Bamba I., Kabulu J.P., Koffi K. J., De Cannière
C., Visser M. & Sibomana S., 2008, Fragmentation of forest landscapes in central Africa: causes, consequences and management. In: Lafortezza R., Chen J., Sanesi G. & Crow Th.R. (Editors), Patterns and Processes in Forest Landscapes: Multiple Use and Sustainable Management. Springer, Verlag, New York, pp. 67-87.
9. Bogaert J., Barima Y.S.S., Iyongo W.M.L., Bamba I., Mama A., Toyi M. & Lafortezza, R., 2011, Forest fragmentation: causes, ecological impacts and implications for landscape management. In: C. Li, R. Lafortezza and J. Chen (editors), Landscape Ecology in Forest Management and Conservation: Challenges and Solutions for Global Change. HEP-Springer, pp. 273-296.
10. Brink A.B. & Eva H.D., 2009, Monitoring 25 years of land
cover change dynamics in Africa: a sample based remote sensing approach. Applied Geography, 29, 501-512. 11. Brown D.G., 2003, Land use and forest cover on private in
the upper Midwest USA, 1970 to 1990. Landscape Ecology, 18, 777-790.
12. Clerici N., Bodini A., Eva H.D., Grégoire J.-M., Dulieu D. & Paolini C., 2006, Increased isolation of two biosphere reserves and surrounding protected areas (WAP Ecological Complex, West Africa). Journal for Nature Conservation, 15, 26-40.
13. Cohen W.B., Spies T.A. & Fiorella M., 1995, Estimating the age and structure of forests in a multi-ownership landscape of western Oregon, U.S.A. International Journal of Remote Sensing, 16, 721-746.
14. Congalton R.G. & Green K., 1999, Assessing the accuracy of remotely sensed data: principles and practices. Boca Raton, FL: Lewis Publishers, Florida, 137 p.
15. DeFries R. & Pandey D., 2010, Urbanization, the energy ladder and forest transitions in India’s emerging economy. Land Use Policy, 27, 130-138.
16. Dunn R.R., 2004, Recovery of faunal communities during tropical forest regeneration. Conservation Biology, 18, 302-309.
17. Eva H.D., Brink A.B. & Simonetti D., 2006, Monitoring land-cover dynamics in sub-Saharan Africa. Luxembourg. Office for Official Publication of the European Communities, EUR 22498 EN.
18. F.A.O., 2005, Global Forest Resources Assessment 2005. FAO, Rome, Italy, 319 p.
19. Farina A., 2000, Landscape ecology in action. Kluwer Academic Publishers, Dordrecht 317 p.
20. Geoghegan J., Villar S.C., Kleipeis P., Mendoza P.M., Ogneva-Himmelberger Y. Chowdhury R.R., Turner II B.L. & Vance C., 2001, Modeling tropical deforestation in the southern Yucutan peninsular region: comparing survey and satellite data. Agriculture, Ecosystems and Environment, 85 25-46.
21. Haefner J.W., 1996, Modeling biological systems: principles and applications. Chapman and Hall, New York.
22. Hall F.G., Botkin D.B., Strebel D.E., Woods K. D. & Goetz S.J., 1991, Large-scale patterns of forest succession as determined by remote sensing. Ecology, 72, 628-640. 23. Hall C.A.S., Tian H., Qi Y., Pontius G., Cornell J. & Uhlig J.,
1995, Modelling spatial and temporal patterns of tropical land use change. Journal of Biogeography, 22, 753-757. 24. Hanski I., 2005, Landscape fragmentation, biodiversity loss
25. Harini N., Darla K.M. & Jane S., 2004, From pattern to process: landscape fragmentation and the analysis of land use/land cover change. Agriculture, Ecosystems and Environment, 101, 111-115.
26. Lu D., Mausel P., Brondızio E. & Moran E., 2004, Change detection techniques. International Journal of Remote Sensing, 12, 2365-2407.
27. Marien J-N. & Mallet B., 2004, Nouvelles perspectives pour les plantations forestières en Afrique centrale. Bois et Forêts des tropiques, 282, 4, 15-25.
28. Mayaux P., Bartholome E., Fritz S. & Belward, A., 2004, A new land-cover map of Africa for the year 2000. Journal of Biogeography, 31, 861–877.
29. Moore A.D., 1990, The semi-Markov process: a useful tool in the analysis of vegetation dynamics for management. Journal of Environmental Management, 30, 111-130.
30. Pontius R.G.Jr., 2000, Quantification error versus location in comparison of categorical maps. Photogrammetric Engineering and Remote Sensing, 66, 8, 1011-1016.
31. Schlaepfer R., 2002, Analyse de la dynamique du paysage. Laboratoire de gestion des écosystèmes. École Polytechnique Fédérale de Lausanne, Suisse, 11 p.
32. Takada T., Miyamoto A. & Hasegawa S.F., 2010, Derivation of a yearly transition probability matrix for land-use dynamics
and its applications. Landscape Ecology, 25, 561-572. 33. Turner II B.L. & Mayer W.B., 1994, Global land-use and
land-cover change: an overview. In: Mayer W.B., Turner B.L., IIII (Editors), Changes in land-use and land-cover: a global perspective. Cambridge University Press, Cambridge, pp. 3-10.
34. Turner II B.L., Skole D., Sanderson S., Fisher G., Fresco L. & Leemans R., 1995, Land-use and land-cover change. Science/Research Plan, International Geosphere-Biosphere Programme Report N°35, Human Dimensions of Global Environmental Change Programme Report N°7, Stockholm and Geneva.
35. Verburg P.H. & Veldkamp A., 2005, Introduction to the special issue on spatial modelling to explore land use dynamics. International Journal of Geographic Information Science, 19, 2, 99-102.
36. Weng Q., 2002, Land use change analysis in the Zhujiang Delta of China using satellite remote sensing, GIS and stochastic modelling. Journal of Environmental Management, 64, 273-284.