Impact of the WTO Agreement on
Textiles & Clothing on Brazilian Exports of
Textiles and Clothing to the United States
Guido Soares Silva (USP - colaborador EDESP)
Maria Lúcia Pádua Lima (Professor EAESP-EESP)
Maria Carolina Mendonça de Barros (Advogada, colaboradora EDESP)
Michelle Ratton Sanchez (Professora EDESP)
Sérgio Goldbaum (Professor EAESP-EESP)
The third and last stage of the World Trade Organization (WTO) Agreement on Textiles & Clothing (ATC) ends on December 31, 2004. The ATC was designed as an instrument for the gradual dismantling of the Multifiber Arrangement and consequently for the integration of textile and clothing industry products into the General Agreement on Tariffs & Trade (GATT).
According to the timetable established by the ATC, countries must integrate into the GATT all products not yet integrated, which represented up to 49% of their imports by volume in 1990.
This paper sets out to:
(i) describe recent trends in Brazilian exports of textiles and clothing to the United States, European Union and Mercosur;
(ii) assess the impact of the ATC on Brazilian exports of textiles and clothing to the U.S.;
(iii) assess the rivalry between Brazilian exports and Chinese exports in the same sector;
(iv) analyze how the special terms for China’s accession to the WTO influence its role in multilateral trade in textiles and clothing.
1. Recent trends in Brazilian exports of textiles and clothing to the U.S.
Figure 1: Harmonized System Chapters for Textiles & Clothing
HS
Code Description
50 Silk
51 Wool, Fine or Coarse Animal Hair; Horsehair Yarn and Woven Fabric 52 Cotton
53 Other Vegetable Textile Fibres; Paper Yarn and Woven Fabrics of Paper Yarn
54 Man-Made Filaments 55 Man-Made Staple Fibres
56 Wadding, Felt and Nonwovens; Special Yarns; Twine; Cordage, Ropes and Cables and Articles Thereof
57 Carpets and Other Textile Floor Coverings
58 Special Woven Fabrics; Tufted Textile Fabrics; Lace; Tapestries; Trimmings; Embroidery
59 Impregnated, Coated, Covered or Laminated Textile Fabrics; Textile Art. of a Kind Suitable For Industrial Use
60 Knitted or Crocheted Fabrics
61 Articles of Apparel and Clothing Accessories, Knitted or Crocheted 62 Articles of Apparel and Clothing Accessories, Not Knitted or
Crocheted
63 Other Made Up Textile Articles; Sets; Worn Clothing and Worn Textile Articles; Rags
Source: Brazilian Ministry of Development, Industry & Commerce (MDIC)
Based on data from the Ministry of Development, Industry & Trade (MDIC) “ALICE” System (Sistema de Análise das Informações de Comércio Exterior via Internet), the following figures show the evolution of Brazilian textile and clothing exports to Mercosur, the United States1 and European Union, as well as total exports. The data for textile exports cover HS chapters 50-60; the clothing data cover chapters 61-63.
Figure 2: Brazilian Exports of Textiles (HS ch. 50-60) and Clothing (HS ch.
61-63) to Mercosur, U.S.1, EU and Total Exports, in US$ Million FOB, 1989-2003
1
Textiles Clothing Total % Total
Exports Textiles Clothing Total
% Total
Exports Textiles Clothing Total
% Total
Exports Textiles Clothing Total
% Total Exports
1989 39 23 62 4 259 123 382 28 144 210 353 26 929 451 1.380 100
1990 43 30 73 6 291 139 429 34 106 166 272 22 821 427 1.248 100
1991 87 63 150 11 250 211 461 34 141 127 268 20 872 487 1.359 100
1992 132 100 233 16 212 196 408 28 194 174 368 25 892 571 1.463 100
1993 175 134 309 22 113 225 338 24 147 209 356 26 713 670 1.383 100
1994 176 123 298 21 145 178 324 23 173 214 387 28 795 608 1.404 100
1995 202 107 309 21 163 174 336 23 172 150 322 22 915 527 1.441 100
1996 272 135 408 32 111 141 252 19 112 116 228 18 817 475 1.292 100
1997 314 168 482 38 89 97 186 15 137 100 238 19 821 446 1.267 100
1998 292 175 468 42 78 73 151 14 88 85 173 16 702 411 1.113 100
1999 233 167 400 40 65 74 139 14 91 94 185 18 612 398 1.010 100
2000 238 201 439 36 86 81 167 14 94 174 268 22 688 534 1.222 100
2001 201 179 380 29 144 72 215 16 71 212 283 22 770 536 1.306 100
2002 133 37 170 14 130 83 213 18 76 300 377 32 679 507 1.185 100
2003 339 63 402 24 148 111 259 16 104 361 465 28 1.033 623 1.656 100
Mercosur European Union USA Total Exports
Source: MDIC (Sistema de Análise das Informações de Comércio Exterior via Internet) The charts show a fall in Brazilian exports of textiles and clothing to both the U.S. and EU in the 1990s, possibly reflecting the tariff preference agreements entered into by these countries and trading blocs with export platforms (Turkey, Caribbean and Mexico, among others). However, the fall was partially offset by a rise in exports to Mercosur, especially Argentina.
These trends began reversing early in 2000. Brazilian exports to Mercosur were severely affected by the crisis in Argentina, while exports of clothing to the U.S. as well as exports of textiles to Europe showed signs of a recovery. In 2003 exports to Mercosur rebounded, triggering the adoption of protectionist measures by Argentina’s textile and clothing sector.2
The charts in Figure 3 display disaggregated data referring to the products specified and described in the relevant HS chapters, for Brazilian exports to the main consumer countries or blocs. It is important to note that out of a total of approximately US$1.6 billion FOB for Brazilian exports of textiles and clothing slightly more than US$1.0 billion FOB went to the U.S., Mercosur and EU. Thus these three markets accounted for almost two-thirds of Brazilian exports in the sector.
Figure 3: Brazilian Exports of Textiles and Clothing to Mercosur, U.S.,3 EU and Total Exports (HS 2-digit level), US$ Million FOB, 1989-2003
2
See on this subject a report published by Folha de S. Paulo on March 13, 2004 (Vila-Nova, 2004).
3
Mercosur
0 100 200 300 400 500 600
1989 1990 1991 1992 1993 1994 1995 1996 1997 1998 1999 2000 2001 2002 2003
M
illion
52 - Cotton 55 - Man-Made Staple Fibres
Other HS 50-60 chaps. 61 - Art. of Apparel and Clothing Access., Knitted or Crocheted
62 - Art. of Apparel and Clothing Access., Not Knitted or Crocheted 63 - Other Made Up Textile Articles...
United States
0 50 100 150 200 250 300 350 400 450 500
1989 1990 1991 1992 1993 1994 1995 1996 1997 1998 1999 2000 2001 2002 2003
Million
52 - Cotton 56 - Wadding, Felt and Nonwovens...
Other HS 50-60 chaps. 61 - Art. of Apparel and Clothing Access., Knitted or Crocheted
European Union
0 50 100 150 200 250 300 350 400 450 500
1989 1990 1991 1992 1993 1994 1995 1996 1997 1998 1999 2000 2001 2002 2003
M
illion
51 - Wool, Fine or Coarse Animal Hair... 52 - Cotton
Other HS 50-60 chaps. 61 - Art. of Apparel and Clothing Access., Knitted or Crocheted
62 - Art. of Apparel and Clothing Access., Not Knitted or Crocheted 63 - Other Made Up Textile Articles...
Total Exports
0 200 400 600 800 1.000 1.200 1.400 1.600 1.800
1989 1990 1991 1992 1993 1994 1995 1996 1997 1998 1999 2000 2001 2002 2003
M
illion
52 - Cotton 54 - Man-Made Filaments
55 - Man-Made Staple Fibres 56 - Wadding, Felt and Nonwovens...
Other HS 50-60 chaps. 61 - Art. of Apparel and Clothing Access., Knitted or Crocheted
62 - Art. of Apparel and Clothing Access., Not Knitted or Crocheted 63 - Other Made Up Textile Articles...
The following can be inferred from the charts with respect to the increase in total Brazilian exports at the start of the 21st century:
(i) The increase mainly reflected a recovery in exports of cotton to the EU and Mercosur;4
(ii) The recovery in Brazil’s exports to the U.S. should be attributed to the three clothing chapters (the top three strips in the charts), especially chapter 63, which includes cotton-derived bed, table, toilet and kitchen linen;
(iii) Exports of cotton continued to account for a significant proportion of total exports.
2. Impact of ATC expiration on Brazilian exports to U.S.
2.1. Methodology: the competitiveness matrix5
A simple methodology was used to measure the impact on Brazilian exports of the transition period defined by the ATC and its expiration, with integration of the sector into the 1994 GATT system. The methodology consists of a matrix in which textile and clothing products disaggregated to the 2-digit and 6-digit levels of the Harmonized System6 are classified into four possible types of competitiveness, as shown in Figure 4.
Figure 4: Competitiveness Matrix
Stagnant Product Dynamic Product
Waning Stars Rising Stars
+ Variation in Percentage of
Exports –
Retreats Missed Opportunities
– Variation in Percentage of Imports +
where Variation in Percentage of Imports is the change in the value of imports of product i to importer market B expressed as a percentage of the total value of imports to importer market B between periods 0 and 1, i.e.:
4
It should be noted that U.S. cotton subsidies severely limit Brazilian cotton exports to the U.S.
5
The competitiveness matrix methodology is used in many studies by ECLAC/CEPAL. See for example Fajnzylber, F. (1991).
6
]
10 1
0 ( )
) ( = M M PI i
and Variation in Percentage of Exports is the change in the value of exports of product
i from exporter country A to importer country B expressed as a percentage of the total value of exports from exporter country A to importer country B between periods 0 and 1, i.e.:
]
1 0 , , 1 0 , ) ( ) ( = B A B A B A X Xi PEIf an importer country increases imports of product i relative to total imports, that product is termed “dynamic”; conversely, if it imports less, the product is considered “stagnant”. If a product increases as a percentage of the total exported by a given country, it is termed a “rising star” if it is dynamic or a “waning star” if it is stagnant. Lastly, a product that decreases as a percentage of total exports is termed a “missed opportunity” if it is dynamic or a “retreat” if it is stagnant.
The analysis looks at the variations in four distinct periods as plotted by three charts:
(i) variations in the percentages of imports and exports between the three-year period prior to the ATC (1992-1994) and Stage 1 of the ATC (1995-1997);
(ii) variations in the percentages of imports and exports between Stage 1 of the ATC (1995-1997) and Stage 2 (1998-2001);
(iii) variations in the percentages of imports and exports between Stage 2 of the ATC (1998-2001) and the years 2002 and 2003, the only year of Stage 3 for which data are available.
Data for total Brazilian exports to the U.S. and for Brazilian exports of textiles and clothing, disaggregated according to the Harmonized System (chapters 50-63), were obtained from the Brazilian Development Ministry’s ALICE system.7 Data for total U.S. imports were obtained from the Web site of the U.S. Commerce Department’s Bureau of Economic Analysis. Data for U.S. imports of textiles and clothing were obtained from the U.S. International Trade Commission’s Dataweb.8, 9
2.2. Competitiveness Matrix: findings for 2-digit and 6-digit levels of
Harmonized System
The findings are presented below. Figure 5 shows that chapter 61 (“Articles of apparel and clothing knitted”) and chapter 63 (“Other made up textile articles”) moved from “missed opportunities” in the first chart to “rising stars” in the others.
Figure 5: Competitiveness Matrices – HS 2-digit level
MATRIX 0 - 1
55 63
52 61
62
-0,60% -0,40% -0,20% 0,00% 0,20% 0,40% 0,60%
-0,50% -0,40% -0,30% -0,20% -0,10% 0,00% 0,10% 0,20% 0,30%
MATRIX 1 - 2
61 63
62
52 56
-0,60% -0,40% -0,20% 0,00% 0,20% 0,40% 0,60%
MATRIX 2 - 3
56
62 61
63
-0,60% -0,40% -0,20% 0,00% 0,20% 0,40% 0,60%
-0,50% -0,40% -0,30% -0,20% -0,10% 0,00% 0,10% 0,20% 0,30%
Source: Authors, based on data from MDIC Brazil, U.S. Department of Commerce, and U.S. International Trade Commission.
It can also be seen that the percentage of Brazilian exports of chapter 62 goods (“Articles of apparel not knitted”) increased after the start of ATC Stage 3. As noted in the introduction to this paper, chapters 61, 62 and 63 are the most relevant for Brazilian exports of textiles and clothing to the U.S.
The analysis of the ATC’s impact on Brazilian exports of textiles and clothing to the U.S. becomes more precise when the data are disaggregated to 6 digits of the HS. The charts in Figure 6 display the results.
Matrix 06 0 - 1
620342*
610910 610510
620462*
611090
630260 620610
611020
-0,400% -0,300% -0,200% -0,100% 0,000% 0,100% 0,200% 0,300% 0,400%
-0,200% -0,150% -0,100% -0,050% 0,000% 0,050% 0,100% 0,150% 0,200%
Matrix 06 1 - 2
611020
620462 610910
620342 560721*
630260
620520
-0,400% -0,300% -0,200% -0,100% 0,000% 0,100% 0,200% 0,300% 0,400%
Matrix 06 2 - 3
630222 630232*
620520 611010
560721
611011 611020 620462 630260*
-0,400% -0,300% -0,200% -0,100% 0,000% 0,100% 0,200% 0,300% 0,400%
-0,200% -0,150% -0,100% -0,050% 0,000% 0,050% 0,100% 0,150% 0,200%
Source: Authors, based on data from MDIC Brazil, U.S. Department of Commerce, and U.S. International Trade Commission.
In all three charts the vast majority of observations (as shown by individual dots) are close to the point of origin, which means the competitiveness of the products they represent did not vary significantly. The products with significant variations in competitiveness are identified by its HS numbers. Three (underlined) can be seen in all three charts: 630260, 611020, and 620462. The others appear only in one or at most two charts.
Additionally, products identified here and also listed among imports liberalized by the U.S. in each stage of the ATC are marked with an asterisk. The following can be noted with respect to these products:
(i) Product 630260, which includes cotton toilet and kitchen linen, showed a positive variation in the percentages of both exports and imports. In 2003 it accounted for 28.85% of Brazil’s sales of textiles and clothing to the U.S. and was the largest single category in Brazilian exports to the U.S. Imports of the product were liberalized only in Stage 3 of the ATC, however. The improvement in its competitiveness must therefore be due to favorable conditions of supply (such as the recovery in cotton production) rather than the reduction in quotas promoted by the ATC.
U.S. accounted for 8.52% of all Brazilian exports of textiles and clothing in 2003 and were the second-largest single item.
(iii) Product 630232, which includes bed linen of man-made fibers, seems to have benefited from the liberalization of imports in Stage 3 of the ATC. In 2003 it accounted for 7.12% of the sector’s exports to the U.S. and ranked third in the total.
(iv) Product 611020, which includes knitted cotton jerseys, pullovers etc., showed improved competitiveness without liberalization of imports under the ATC. Exports accounted for 3.17% of the total exports of textiles and clothing to the U.S. (7th place).
(v) Product 620342, which includes cotton dresses, was favorably affected by liberalization in ATC Stage 1 but exports fell back again in the subsequent period. In 2003 it accounted for only 1.90% of the sector’s exports (11th place).
The analysis suggests that from the standpoint of market access the increase in Brazilian exports of textiles and clothing to the U.S. should be attributed not just to the ATC but above all to improving domestic conditions for production and supply of the products involved, particularly the investment in machinery and technology10 as well as the recovery in domestic production of cotton.
2.3. Brazil-China Rivalry in the U.S. market
China is potentially the main beneficiary of the liberalization of markets for textiles and clothing by the WTO’s multilateral trade system. The U.S. industry is concerned about this and is lobbying hard for protection of its market against the alleged “Chinese threat”.11
As shown in the next figure, Chinese exports to the U.S. did indeed increase significantly in the 1990s, especially in clothing segments. Altogether, Chinese goods accounted in 2002 for some 13% of U.S. textile and clothing imports. In comparison, Brazilian exports accounted for 0.51% in the same year.
10
According to IEMI (2003), the average annual investments in textile machinery between 1997 and 2002 was of US$ 630 million. The participation of imported machinery was 67% of the total amount invested in the period.
11
Figure 7: Evolution of Chinese Exports of Textiles and Clothing to the U.S., 1989-2002
0 2.000 4.000 6.000 8.000 10.000 12.000
19
89
19
90
19
91
19
92
19
93
19
94
19
95
19
96
19
97
19
98
19
99
20
00
20
01
20
02
Million
HS Chaps. 50 - 60 Art. of Apparel and Clothing Access., Knitted or Crocheted
Art. of Apparel and Clothing Access., Not Knitted or Crocheted Other Made Up Textile Articles...
Source: Authors, based on data from U.S. International Trade Commission.
To study the impact of increasing Chinese exports of textiles and clothing on the U.S. market, it is relevant to analyze the specific situation of Mexico, which has a significant share of world exports of textiles and clothing and enjoys tariff preferences in the U.S. market under the North American Free Trade Agreement (NAFTA). Figure 8 illustrates this point, showing the evolution of Mexico’s textile and clothing exports to the U.S. in the period 1989-2003.
Figure 8: Evolution of Mexican Exports of Textiles and Clothing to the U.S., HS 2-digit level, 1989-2003
0 2.000 4.000 6.000 8.000 10.000 12.000
1989 1990 1991 1992 1993 1994 1995 1996 1997 1998 1999 2000 2001 2002 2003
Million
HS Chaps. 50 - 60 Art. of Apparel and Clothing Access., Knitted or Crocheted
Source: Authors, based on data from U.S. International Trade Commission.
The period covered by Figure 8 includes Mexico’s entry into the NAFTA (1992) and China’s into the WTO (2001). The former coincided with the onset of a period of vigorous growth in Mexican exports to the U.S., particularly with respect to HS chapters 61 and 62. The latter coincided with the start of an apparent contraction in the volume of those exports.
This section presents a simple indicator of the rivalry between Chinese and Brazilian imports in the U.S. The proposed indicator compares the market share of Brazilian exports of textiles and clothing in the U.S. with the market share of Chinese exports of textiles and clothing in the U.S. as a percentage of total imports of textiles and clothing by the U.S.
Algebraically:
= − US−
C T US CHI i US C T US BRA i M X M X SP & &
The indicator measures specialization: the higher the number, the more specialized Brazilian exports to the U.S. will be compared with Chinese exports, and the closer the number is to zero, the more specialized Chinese exports will be compared with Brazilian exports. In both cases there will be no significant rivalry. However, a ratio close to 1, say between 0.5 and 1.5, will indicate significant rivalry.
The analysis is based on data for U.S. imports of textiles and clothing from China and Brazil, disaggregated to the 4-digit level, from the U.S. International Trade Commission’s Dataweb. Figure 9 shows the specialization ratios for products with the largest shares of total U.S. imports in 2003.
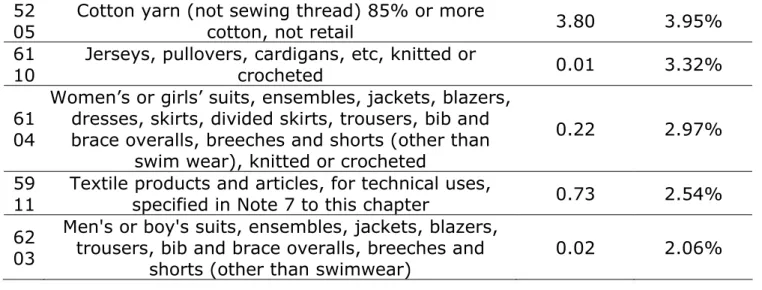
Figure 9: Specialization ratios for the main Brazilian and Chinese exports of textiles and clothing to the U.S., HS 4-digit level, 2003
HS Description
Market share Brazil/Mar ket share China % Brazilian exports of T&C to U.S. 63
02 Bed, table, toilet and kitchen linen 0.52 41.64% 62
04
Women's or girl’s suits, ensembles, jackets, blazers, dresses, skirts, divided skirts, trousers, bib and brace overalls, breeches and shorts (other than
swimwear)
0.02 9.39%
61 09
T-shirts, singlets and other vests, knitted or
crocheted 0.62 7.91%
56 07
Twine, cordage, ropes and cables, whether or not plaited or braided and whether or not impregnated,
coated covered or sheathed with rubber or plastics
52 05
Cotton yarn (not sewing thread) 85% or more
cotton, not retail 3.80 3.95%
61 10
Jerseys, pullovers, cardigans, etc, knitted or
crocheted 0.01 3.32%
61 04
Women’s or girls’ suits, ensembles, jackets, blazers, dresses, skirts, divided skirts, trousers, bib and brace overalls, breeches and shorts (other than
swim wear), knitted or crocheted
0.22 2.97%
59 11
Textile products and articles, for technical uses,
specified in Note 7 to this chapter 0.73 2.54% 62
03
Men's or boy's suits, ensembles, jackets, blazers, trousers, bib and brace overalls, breeches and
shorts (other than swimwear)
0.02 2.06%
Source: Authors, based on data from U.S. International Trade Commission.
An analysis of Figure 9 suggests that Chinese-Brazilian rivalry in exports of textiles and clothing to the U.S. is both intense and significant: of the three main product categories exported to the U.S., two (6302 and 6109) reflect substantial rivalry. Category 6302 (bed, table, toilet and kitchen linen) is particularly striking, since individually it accounts for almost half of Brazil’s textile and clothing exports to the U.S. At the same time, Brazil’s exports in this category to the U.S. correspond to half of China’s, indicating a high level of rivalry.
A more detailed breakdown of category 6302 shows the opposite, however. As can be seen from Figure 10, Brazilian exports of product group 6302600020, which alone accounts for almost 60% of Brazilian exports in position 6302, are almost twice those of China to the U.S., indicating specialization.
Figure 10: Specialization ratios for the main Brazilian and Chinese exports of textiles and clothing to the U.S. in position 6302, HS 10-digit level, 2003
HS Description
Market share Brazil/Ma rket share China % Brazilian exports of 6302 to U.S. 63026000 20
Toilet linen and kitchen linen, of terry toweling or similar terry fabrics, of cotton:
other than dishtowels
1,97 58,05%
63023220 40
Bed linen: other than printed, not knit man-made fiber sheets, not napped, not embroidered, lace, braid, edging, trimming,
piping or applique work
5,87 13,99%
63022220 20
Bed linen: printed, not knit man-made fiber sheets, not embroidered, lace, braid, edging,
trimming, piping or applique work
63026000 30
Toilet linen and kitchen linen, of terry toweling or similar terry fabrics, of cotton:
other than towels
0,77 6,35% 63029100
35
Other towels, of cotton, jacquard figuered,
not of pile or tufted construction 9,45 3,65% 63023220
20
Bed linen: other than printed, not knit man-made fiber pillowcases, not napped, not embroidered, lace, braid, edging, trimming,
piping or applique
6,42 3,10%
63022220 10
Bed linen: printed, not knit man-made fiber pillowcases, not embroidered, lace, braid, edging, trimming, piping or applique work
10,26 1,56%
63022190 20
Other bed linen: printed, not knit, cotton sheets, not napped, not containing embroidery, lace, braiding, edging, trimming,
piping or applique work
0,49 1,53%
Source: Authors, based on data from U.S. International Trade Commission.
With the exception of products 6302600030 and 6302219020, the rest all have very high specialization ratios, suggesting that not rivalry but specialization prevails (and hence complementarity) in Brazilian and Chinese exports of textiles and clothing to the U.S.
3. Chinese accession and special terms
China’s accession to the WTO and its adaptation to the rules for international trade have had a significant impact on world trade in textiles and clothing. China-U.S. relations, in which the former exports textiles and clothing to the latter, account for a significant proportion of this trade. It is important to note that the largest consumer of Chinese exports in the sector coincides with the largest consumer of Brazilian exports in the same specific sector.
China was not a contracting party to the GATT throughout the period 1947-1994. Owing to its closed, command-and-control economy with almost universal state ownership China’s participation in international trade took on unique characteristics, mostly in the form of bilateral agreements with some plurilateral agreements. China has always played a very significant role in world trade in textiles despite its closed economy. Data for 2001 show China accounting for 10.2% of world trade in textiles (US$16.14 billion) and 18.1% of world trade in clothing (US$36.07 billion).12 Altogether, textiles and clothing accounted for 20% of China’s total exports in 2001.13
The process of economic opening begun as the “Open Door Policy” by Deng Xiaoping in 1978 included permission for foreign investment in textile manufacturing
12
Cf. WTO (2001).
13
through joint ventures with Chinese state-owned enterprises. Even today the state has a significant share in the equity of a large proportion of China’s manufacturers and exporters of textiles and clothing.14
China’s accession to the WTO was concluded in 2001 on special terms that took into account the specific features of its economic organization and its significance to world trade in terms of both volume and value. In textiles and clothing, the principal concern among developed countries, which are all major consumers of these goods, is with the sharp increase in Chinese imports and the threat to their own domestic manufacturers, while developing countries are concerned that in the short to medium term their exports will lose competitiveness in comparison with Chinese exports.15
The special rules negotiated for China’s accession include those designed to allow the other members of the WTO to adapt while China gradually began competing in the global marketplace on the same terms.16 This included the textile and clothing sector. Just as the ATC stipulates for members of the WTO, China has to phase out quotas for textiles and clothing by 2005.17 However, a special safeguard mechanism for textiles and clothing has been created with respect to China, lasting until 2008 (“China textile safeguard”).
Under the special textile safeguard, once China’s textile and clothing products are included in the ATC, if a WTO member believes (and can show) that imports of certain Chinese textile and clothing products are “threatening to impede orderly development of trade in these products” due to “market disruption,” the WTO member can request bilateral consultations with China “with a view to easing or avoiding such market disruption”.18 The definition of these conditions and identification of the “role” of such products in market disruption are the only specific terms for invoking the China textile safeguard.
Upon receipt of a request for bilateral consultations, the special safeguard mechanism calls on China to limit the number of textile and clothing shipments to the WTO member in question. It should be noted that this provision is similar to the concept of voluntary export restraints (VER) in force under the GATT exception regime.
The China textile safeguard mechanism returns to old concepts for restricting world trade in textiles and clothing because the process of negotiating China’s accession to the WTO entailed an attempt to reconcile the specific provisions of the
14
V. WTO, WT/L/432, Annex 2.A.2.
15
For a discussion of the impact of China’s accession to the multilateral trade system on developing countries, see Adhikari & Yang (2002). Their analysis focuses on China’s competition with other developing countries in Asia, particularly in labor-intensive products, which of course include textiles and clothing. On the regional impact, see also Suthiwart-Narueput (2002).
16
The main WTO documents that summarize the terms for China’s accession are WT/L/432 and WT/MIN(01)/3. For more information and full details of the accession process, see WT/ACC/CHN.
17
A number of specific waivers or exceptions to tariff removal were requested by some WTO members, such as Argentina and Mexico, which notified the Organization of their intention to maintain restrictions on Chinese imports for a longer period. See WT/L/432, Annex 7.
18
ATC with other existing agreements, especially the U.S.-China bilateral accord on textiles and clothing. This meant returning to many of the vague concepts that favored distortions in world trade in textiles and clothing and had been discarded during the Uruguay Round thanks to strenuous efforts involving tough negotiations and political concessions. The following differences can be identified between the conditions for applying ATC safeguards (article 6 of the ATC) and the conditions for application of the WTO’s China textile safeguard:
Figure 11: Differences between ATC and WTO China textile safeguards
Criteria/Provisions ATC safeguards China textile safeguard
(WTO)
Condition
Increase in imports causes serious damage or actual
threat thereof
Market disruption or threat to orderly development of trade
Causal Relationship
Damage or threat must be demonstrably caused by
increase in imports
Vague terms for justifying complaint: need to show “role” of Chinese products
Restrictions
Restrictive measures, with definition of parameters for
quantitative restrictions
Based on VER parameters for quantitative restrictions
Selectivity Selective application Selective application
Duration of Measure
Limited period (max. 3 years or to end of ATC)
Limited period (max. 12 months, renewable by
consensus only)
Monitoring
Multilateral control (notification of TMB and TMB oversight of measures taken)
No oversight: bilateral agreement
Validity From Jan. 1, 1995 to Dec. 31,
2004
From Nov. 11, 2001 to Dec. 31, 2008
Source: Authors.
The textile safeguards written into the ATC are generally considered fragile compared with the WTO Safeguards Agreement, insofar as they permit selectivity and require a smaller number of procedures to define a safeguard measure and monitor its application. However, it should be stressed that the China textile safeguard is even more fragile than the ATC regime, given that the China textile safeguard reverts to the vague and arbitrary concepts of the pre-ATC period and omits multilateral enforcement. Thus in principle in the period 2001-2008 China will be submitted to more difficult conditions than other WTO members as regards its position in the international market for textile and clothing products.
market disruption. These findings should be taken by WTO members as a warning of exceptions to the system that could potentially be advocated in future.
In addition to the China textile safeguard mechanism, the China accession process also defined safeguards for specific products known as the China transitional safeguards.19 In principle these safeguards are applied to products other than textiles and clothing, which are covered by specific safeguard provisions (China textile safeguard regulations). According to paragraph 242, item (g), of the Report on the Accession of China,20 China textile safeguard measures cannot be applied to the same product at the same time as the China transitional safeguards.
However, there is an ongoing debate about whether the China transitional safeguards (which expire in 2013) will continue to apply to textile and clothing products after the special extension of the ATC China textile safeguard expires in 2008. U.S. experts tend to argue that the transitional safeguard mechanism should be applied to all products covered by the general regime for trade with China until 2013, including textiles and clothing.21 Figure 13 presents a brief comparison of the China transitional safeguards and the general provisions of the WTO Safeguards Agreement:
Figure 12: China transitional safeguards
Criteria/Pro
visions Safeguards Agreement
China Transitional Safeguards
Condition Serious damage
Market disruption (presents definition and requires objective
criteria for justification)
Causal Relationship
Causal link must be
demonstrated for restraint to be allowed. Parameters for
quantitative restriction
Causal link must be
demonstrated for restraint to be allowed. No parameters for
quantitative restriction
Restriction No provision for VER
China must take steps to avoid market disruption (VER
suggested)
Selectivity Non-selectivity Selectivity
Duration of Measure
Limited period (max. 4 years, renewable once for 4 more
years)
No limitation (“only for time necessary to prevent or remedy
market disruption”)
Monitoring
Multilateral control (notification of WTO Committee on Safeguards, which oversees application of any measures
taken)
Bilateral consultation and only notification of Safeguards
Committee
19
See WT/MIN(01)/3, item 13 (paragraphs 245-250) and WT/L/432, item 16 (paragraphs 1-9).
20
WT/MIN(01)/3
21
Validity From Jan. 1, 1995 From Nov. 11, 2001 to Dec. 31, 2013
Source: Authors.
The transitional safeguards also left China in an unfavorable position compared with the other WTO members covered by the Safeguards Agreement. The China transitional safeguards, like the China textile safeguard mechanism, revert to the market disruption concept. Although the former do so in greater detail, they still do not offer more objective criteria for a definition of “market disruption”. An important point is that the China transitional safeguards also define as market disruption cases in which an increase in imports from China may limit market diversification in the importer country.
From the above, it is possible to infer that China is more vulnerable than other WTO members to the application of measures to restrict its exports of textiles and clothing. It can be inferred from this that the China textile safeguard mechanism will remain in force until 2008 and that the China transitional safeguards are likely to be applied to textile and clothing products between 2008 and 2013.
4. Conclusions
In light of recent trends in Brazilian exports of textiles and clothing, especially to the United States, the following conclusions can be drawn:
(i) Brazilian exports of clothing and other made-up articles to the U.S. have increased significantly since the late 1990s;
(ii) The increase could be due either to the impact of liberalization under the ATC or to improving domestic conditions for production and supply of the products involved investment. The analysis described in this paper suggests that in the Brazilian case more importance should not be attributed to the liberalization under the ATC;
(iii) Although one of the expectations for the ATC implementation period was that market access would increase, this has not happened so far. The main importer countries that are WTO members have delayed liberalization of the products of greatest relevance to the exporter countries until the last stage of the Agreement (starting January 2005);
(iv) On the other hand, the ATC represents an important step forward in the definition of rules for world trade in textiles and clothing compared with the rules in place before the Uruguay Round;
(vi) In the case of Brazil, it is demonstrated that the main exports of textiles and clothing to the United States do not seem to compete directly with Chinese exports of the same product category to that important consumer market.
5. References
ADHIKARI, Ramesh; YANG, Yongzheng. “China's increasing openness: threat or opportunity to others?” In: ABCDE-EUROPE CONFERENCE, Oslo, 2002,. Disponível em:
<http://wbln0018.worldbank.org/eurvp/web.nsf/Pages/Paper+by+Adhikari+and+ Yang+1/$File/ADHIKARI+AND+YANG.PDF>. Último acesso em 18 de março de 2004.
BAGCHI, Sanjoy. International trade policy in textiles: fifty years of protectionism. Geneva: International Textiles and Clothing Bureau, 2001.
CONGRESSO NORTE-AMERICANO, Office of Technology Assessment. The US Textile and Apparel Industry: A Revolution in Progress: Special Report. OTA-TET-332, Washington D.C., US Government Printing Office, 1987. Disponível em
<http://www.wws.princeton.edu/cgi-bin/byteserv.prl/~ota/disk2/1987/8733/873301.PDF>. Último acesso em 07 de maio de 2004.
CURTISS, Catherine; ATKINSON, Kathryn C. “United States-Latin American Trade Laws”. North Carolina Journal of International Law & Commercial Regulation, Chapel Hill, v. 21, n. 1, pp. 111-167, 1995.
DIAO, Xinshen; SOMWARU, Agapi. Impact of the MFA Phase-out on the World Economy an Intertemporal, Global General Equilibrium Analysis. International Food Policy Research Institute 2001. (TMD Discussion Paper n. 79), Disponível em <http://econpapers.hhs.se/ paper/fprtmddps/79.htm>. Último acesso em 07 de maio de 2004.
DUNN, K. Kristine. “The Textiles Monitoring Body: Can It Bring Textile Trade into GATT?”. Minnesota Journal of Global Trade, Minneapolis, v. 7, n.1, pp. 123-155, 1998.
FAJNZYLBER, F.: “Inserción Internacional e Inovación Institucional”. Revista de la Cepal, n. 44, 1991.
FINGER, J. Michael. GATT experience with safeguards: making economic and political sense of the possibilities that the GATT allows to restrict import. Washington DC : World Bank. (Working Paper Trade, Development Research Group n. 2000). Disponível em <http://www.worldbank.org/ html/dec/Publications/Workpapers/ wps2000series/wps2000/wps2000-abstract.html>. Último acesso em 02 de setembro de 2004.
GORINI, Ana Paula F.; SIQUEIRA, Sandra H. G. O Complexo Têxtil Brasileiro.RJ : BNDES, 2002. Disponível em <http://www.bndes.gov.br/conhecimento/bnset/ bsesptex.pdf>. Último acesso em 07 de maio de 2004.
IEMI. Relatório Setorial da Cadeia Têxtil Brasileira: Brasil Têxtil 2003. São Paulo, IEMI, 2003.
ITCB (2002a). ATC Implementation: Where it stands?. CR/35/VNM/3. Geneva, 21 de Abril de 2002.
ITCB (2002b). Products Categories Liberalized. CR/35/VNM/4. Geneva, 25 de Abril de 2002.
ITCB (2002c). Textile and Clothing in Doha Work Programme: The Issue of Tarifs. CR/35/VNM/5. Geneva, 27 de Abril de 2002.
JIMÉNEZ, Claudia. “El Tratamiento del Sector Textil en la Ronda Uruguay”. Revista
CIDOB d'Afers Internacionals, n. 29-30. Disponível em
<http://www.cidob.org/Castellano/Publicaciones/ Afers/claudia.html>. Último acesso em 07 de maio de 2004.
McGEE, Robert W. “An Economic Analysis of Protectionism in the United States with Implication for International Trade in Europe”. George Washington Journal of International Law & Economics, Washington D.C., v. 26, n.3, pp. 539-573, 1993. McGOVERN, Edmon. International Trade Regulation. 3.a ed., Exeter: Globefield Press,
1995.
OECD. International Trade by Commodity Statistics: Historical Series 1961-1190. SITC Revision 2, Volume 2002, Suplemento 1, 2002.
PELZMAN, Joseph, and Kathleen REES. "The Control of Textile and Apparel Trade Under the WTO: What is the Track Record?". In: Gulser Meric and Susan E. W. Nichols: The Global Economy at the Turn of the Century, Vol. III, pp. 811-830, 1998.
PERLOW, Gary H.: “The multilateral Supervision of International Trade: Has the Textiles Experiment Worked?” The American Journal of International Law, Washington D.C., v. 75, n. 1, pp. 93-133, 1981.
PROCHNIK, Victor. “A cadeia têxtil/confecções perante os desafios da ALCA e do acordo comercial com a União Européia”. Economia, Niterói, v. 4, n. 1, pp. 53-83, 2003.
PROCHNIK, Victor. Cadeia: Têxtil/Confecções. In: UNICAMP-IE-NEIT; MDIC; MCT; FINEP. Estudos da Competitividade de Cadeias Integradas no Brasil: Impactos das Zonas de Livre Comércio. Campinas: Unicamp-IE-NEIT, 2002. Disponível em http://www.desenvolvimento.gov.br/arquivo/
sdp/proAcao/forCompetitividade/impZonLivComercio/16textilCompleto.pdf>. Último acesso em 07 de maio de 2004.
SPINANGER, Dean. “Faking Liberalization and Finagling Protectionism: The ATC at its Best”. In: Preparing For The WTO 2000 Negotiations: Mediterranean Interests
<http://www1.worldbank.org/wbiep/ trade/papers_2000/BPatc.pdf>. Último acesso em 07 de maio de 2004.
SPINANGER, Dean. Textile Beyond the MFA Phase-Out. Alemanha : Kiel Institute of World Economics. (CSGD Working Paper n. 13/98). Disponível em <http://papers.ssrn.com/sol3/ papers.cfm?abstract_id=146963>. Último acesso em 07 de maio de 2004.
SUTHIWART-NARUEPUT, Sethaput. Regional impact of China accession. Washington
DC : World Bank, 2002. Disponível em <http://lnweb18.worldbank.org/eap/eap.nsf/
Attachments/021107-tradeworkshop-sp8/$File/021107-Suthiwart-Narueput.pdf>. Último acesso em 18 de março de 2004.
THONGPAKDE, Nattapong; PUPPHAVESA, Wisarn. Returning Textiles and Clothing to
GATT Disciplines. Washington DC : World Bank, 1999. Disponível em
<http://www1. worldbank.org/wbiep/trade/manila/textiles.pdf>. Último acesso em 07 de maio de 2004.
VAGTS, Detlev (2001). “The United States and Its Treaties: Observance and Breach”.
The American Journal of International Law, Washington D.C., v. 95, n. 2, pp. 313-334, 2001.
VILA-NOVA, Carolina: “Argentina suspende barreira contra têxteis”. Jornal Folha de São Paulo, 13 de março de 2004.
WILLIAMS, Mark; YUK-CHOI, Kong; YAN, Shen (2002). “Bonanza or mirage? Textiles and China's accession to the WTO”. Journal of World Trade: Law, Economics, Public Policy, Geneve, v. 36, n. 3, pp. 577-591, 2002.
WTO (2001a). International Trade Statistics 2001. Disponível em <http://www.wto.org/english/ res_e/statis_e/its2001_e/its01_toc_e.htm>. Último acesso em 18 de março de 2004.
WTO (2001b). Comprehensive Report of the Textiles Monitoring Body to the Council for Trade in Goods on the Implementation of the Agreement on Textiles and Clothing During the Second Stage of the Integration Process. G/L/459: 31 July
2001. Disponível em <http://docsonline.wto.org/ gen_search.asp?searchmode=simple>. Último acesso em 07 de maio de 2004.
WTO (2001c). Background Statistical Information with Respect to Trade in Textiles
and Clothing. G/L/474: 12 September 2001. Disponível em <
http://docsonline.wto.org/ gen_search.asp?searchmode=simple> . Último acesso em 07 de maio de 2004.
WTO (2001d). Second Major Review of the Implementation of the Agreement on Textiles and Clothing by the Council for Trade in Goods: Communication from
Uruguay. G/C/W/304: 26 september 2001. Disponível em <
http://docsonline.wto.org/gen_search.asp?searchmode=simple>. Último acesso em 07 de maio de 2004.
Uruguay. G/C/W/325: 22 october 2001. Disponível em < http://docsonline.wto.org/gen_search.asp?searchmode=simple>. Último acesso em 07 de maio de 2004.
WTO (2001f). Accession of the People's Republic of China: Decision of 10 November 2001. WT/L/432: 23 November 2001. Disponível em: <http:// docsonline.wto.org/DDFDocuments/t/WT/L/432.doc>. Último acesso em 18 de março de 2004.
WTO (2001g). Report of the Working Party on the Accession of China. WT/MIN(01)/3: 10 November 2001. Disponível em: < http://docsonline.wto.org/ DDFDocuments/t/WT/min01/3.doc >. Último acesso em 18 de março de 2004.
WTO (2002). Doha Ministerial Decision on Implementation-Related Issues and Concerns: CTG Examination of Proposals Contained in Paragraphs 4.4 and 4.5 Relating to hte Agreement on Textiles and Clothing: Communication from Hong
Kong, China. G/C/W/368: 24 April 2002. Disponível em <
http://docsonline.wto.org/gen_search.asp?searchmode=simple>. Último acesso em 07 de maio de 2004.
WTO (2003). Anti-dumping Actions in the Area of Textiles and Clothing: Developing
Members’ Experience and Concerns. TN/RL/W/48/Rev.1: 3 February 2003.
Disponível em < http://docsonline.wto.org/gen_search.asp?searchmode=simple>. Último acesso