THE PORTUGUESE ECONOMY
IN THE LIGHT OF IRISH EXPERIENCE
A comparison of the 1990 years
Joaquim Ramos Silva
ISEG/Technical University of Lisbon
1. INTRODUCTION
The performance of the Irish economy throughout the nineties, particularly the remarkable catching up of EU level, has been largely acclaimed in terms of the feat of the "Celtic tiger". At the same time, the Portuguese economy is also credited of some achievements, it qualified to EMU from its inception,1 and it is
behaving more similarly to the other European economies (in relation to most of the 70's and 80's years). For instance, its intra-industry trade has approached European levels2 and it is now significantly exporting capitals. However, if we
look not only globally at the decade, but also at the trend of its late years, and we make the appropriate comparisons, it becomes clear that, in contrast with Ireland, Portugal has one of the least performing economies amongst the "cohesion countries". In fact, during 1995-1999, it had, in relative terms, the most significant reduction of the pace of real convergence, even if it still remained slightly positive. It is no surprise that in a note issued in October 1999, by the IMF, it was pointed out that "the key economic challenge was to secure continued, and preferably even more rapid, real economic convergence with other EU economies". In addition, one year later, the central bank even forecast that the Portuguese economy would not converge with EU in 2000-1.
In this paper, we sustain that the unfavorable turn in the Portuguese economy’s EU convergence in the late nineties, is not a mere reflection of the economic cycle but it is tied with deeper causes, particularly related to insufficient openness, and to confusing and inert views on specialization and competitiveness matters.
But, if Portugal has this kind of problems, let us first explain why the comparison with Ireland is economically relevant. As F. Barry put the question pretty clear: "a useful perspective can be gained by comparing the growth experiences of EU-periphery economies with each other rather than with their larger and wealthier neighbors. A number of structural similarities were pointed out which suggest that there is coherence to this argument" (1999a: 62). Moreover, despite the recent evolution, it is worth to remember that both countries, which also belong to the same Atlantic periphery of EU (and that are relatively isolated in face of their respective powerful neighbor, having had
with them significant historical contentious), were in the outset of the nineties, in a very similar position, if not more favorable to Portugal.3 Why then, such an
uneven, and in a way - if we consider the entry of the escudo into the EMS in 1992 as the passage to a higher economic maturity and credibility -, almost unexpected development?
Taking into account the previous observations, and for the sake of simplicity, in this paper, we will mainly focus on the comparison between Portuguese and Irish economies. We shall try to explain their divergent performances in the nineties, presenting some empirical data, and inquiring about the main causes that are behind it, emphasizing in particular the role of the external sector and related policies and strategies.
2. OVERVIEW OF THE CATCHING UP PROCESS
First of all, let us look at the basic facts. Portugal was in the postwar period, particularly since 1960, one of the most fast growing European economies, if not the fastest (Mateus, 1998), only depending on the starting point of the analysis. However, after a substantial increase in the decade following EC membership, the pace of convergence declined in the late nineties (tables 1 and 2). In turn, Ireland had first a long period of weak growth, including the fifteen years just after EC membership in 1973. In fact, as shown by Ó Gráda and O'Rourke (1995: 212), average annual growth rates of GDP per capita, were smaller than those of Europe from 1950 up to 1973, and therefore, Ireland was diverging; they became slightly higher in 1973-1988 (2.1% to 1.9%), and only afterwards, they strongly accelerated. In the space of a short decade, beginning in the late 1980s, the Irish level (measured by GDP per head, in PPS terms), jumped from two thirds to the EU average and even more (figure 1 and table 1), achieving what has been widely recognized as a brilliant and rare success.
3 Based on the Cecchini’s Report calculations, F. Barry reminds us that it was predicted that Portugal should
Figure 1
GDP per head, as a % of EU-15 average
(Purchasing Power Standard Terms)
Table 1
GDP per head, as a percentage of EU-15 average
(Purchasing Power Standard Terms)
1986 1987 1988 1989 1990 1991 1992 1993 1994 1995 1996 1997 1998 1999
Greece 59.2 57.4 58.3 59.1 57.4 60.1 61.9 64.2 65.2 66.4 67.5 69.2 68.6 69.3
Ireland 60.8 62.5 63.8 66.3 71.1 74.7 78.4 82.5 90.7 96.8 96.5 96.4 102.1 105.1
Portugal 55.1 56.7 59.2 59.4 58.5 63.8 64.8 67.7 69.5 70.1 70.5 70.7 71.1 71.8
Table 2
Change in GDP Per Head, %
Country 1986-1990 1990-1995 1995-1999
Number of years to reach average EU level according to
the trend of late 1990s (base 1997)
Greece -0.7 2.9 1.1 34
Ireland 4.0 6.4 2.1 -
Portugal 1.53 3.8 0.6 56
Source: EUROSTAT, European Commission estimates
40 50 60 70 80 90 100 110
1986 1887 1988 1989 1990 1991 1992 1993 1994 1995 1996 1997 1998 1999 Anos
%
As far as the catching up process is concerned, one of the most important consequences of the Irish experience in the nineties was the open challenge to the argument that real convergence “usually takes a long time” (Barro, 1996: 14). In fact, according to the so-called “iron law of convergence” based on US evidence, the global gap between the States was reduced at the pace of 2% per annum from 1880 up to 1990.4 However, not only Ireland in the 1990s, but also
South Korea and Taiwan in the 1970s and 1980s, and Japan and Italy in the two preceding decades, show a rather different pattern. Indeed, from a secular trend point of view, all these countries in a relatively short period of time (one or two decades), reached or approached significantly the average level of the leading economies.5 Here is one of the reasons why the Irish and the other similar
experiences are so important for countries seriously aiming at the catching up process.
Let us now look more closely at the evolution both economies in a comparative basis. Using GDP per capita as indicator, the pace of quick convergence of the Portuguese economy was clearly broken in the 1990s, more strikingly in their second half. During the two periods 1986-90 and 1990-95, Portugal had the second highest growth rate of cohesion countries, which has even more than doubled between them, approaching the Irish momentum.6 In contrast, later, in
1995-99, we observe a general curbing of this rate (table 2). However, among the three countries considered, this is much more felt in Portugal than in Ireland or Greece (6 times to around only 3). It is true that the average Portuguese GDP growth rate was 3.3% in 1996-1999 (European Commission, 2000: 131). At first glance, it seems a reasonably fair rate. However, because of the reduction of its gap towards EU rate, it only provided a very small increment to the convergence process.
The Portuguese growth performance appears to be still less satisfactory if we take into account some exceptional factors operating in the late nineties, like
4 For details, see Barro and Sala-i-Martin, 1991, and Barro, 1994.
5 Also Portugal, from 1870 up to 1990, had its most significant advances in the road to European convergence in
relatively short periods of time, in particular 1960-1973 and 1986-1990; see Aguiar and Figueiredo, 1999.
6 Due to frequent revisions, caused mainly by enlargements (in the nineties, to Eastern Germany in 1991, and to
EXPO 98 and correlated public works7, with its multiplier effects - no
comparable public spending stimulus is found in Ireland during the decade -, whilst in the preceding years growth was affected by the recessions of US and other countries in 1991, and of most continental EU economies in 19938. In due
and rigorous terms we should discount or at least to blur over time these short term strong effects that, in a certain sense, favorably biased the results of the late 1990s. So, it is hard to deny that we are in face of a poor performance of the Portuguese GDP in this period (either in per capita in PPS terms or even in the single growth rate case).
The parallel with Greece is also highly interesting. In terms of GDP per capita (in PPP), Portugal had overtaken this “cohesion” country in the late 1980s but the gap remained narrow. During the nineties, Greece clearly improved its relative performance, and according to the calculations based on the trend of their late years (table 2), it will reach EU average level much earlier than Portugal.
3. ON LARGE AND FLEXIBLE OUTWARD ORIENTATION
Examining Irish experience since the 1960's, Barry (1999b: 40) points out the specific features of the last decade developments in the following terms:
"Industrial policy from the 1960s to the mid-1980s concentrated almost exclusively on encouraging high productivity foreign manufacturing companies to use Ireland as an export base. This raised productivity substantially, but Ireland failed to converge on Europeans living standards because its rate of job creation lagged behind. In terms of the balance constraint, while foreign-owned industry rose exports, indigenous industry lost market share to competing imports. What then is different in the 1990s?
Foreign export-oriented industry has expanded considerably and
7 Like the new bridge Vasco da Gama over the Tagus river, in Lisbon; similarly, the coming into work of
Auto-Europa in 1995, that had a profound impact in production and exports was also one of these exceptional factors having strong short term effects in the growth of this period, that nevertheless was comparatively poor.
8 In fact, according to the figures presented by A. Mateus (1998: 218), the years of high growth in Portugal had
a much more competitive indigenous manufacturing sector has stopped the loss in home market share while raising its export orientation. The internationally-tradable market services are booming. All of these developments raise demand for the non-traded sectors, which have been stimulated on the supply side by deregulation and by improved wage and non-wage competitiveness".
Table 3
Openness in Small and Medium Sized EU Economies and NIEs
Country
X of goods/PIB*
X of goods
and services/
PIB* 1990 1997** % change 1997
Austria 26.0 28.4 9.2 42.3
Belgium-Lux. 61.5 70.8 15.1 72.9***
Denmark 27.1 28.6 5.5 36.0
Finland 19.4 34,3 76.8 39.8
Greece 12.2 9.3 -23.8 16.1
Ireland 56.0 69.1 23.4 79.7
Korea - 33.1 - 38.1
Netherlands 47.2 53.4 13.1 56.0
Portugal 27.4 23.6 -13.9 31.4
Spain 11.3 19.6 73.5 28.4
Sweden 25.2 36.4 44.4 43.8
Taiwan - 37.9 - -
Euro zone - - - 32.1
* current prices and exchange rates, % ** Korea and Taiwan, 1998 *** Only Belgium
Source: OECD International Comparisons; OECD Economic Outlook; SEDES
traditionally much higher than exports,9 calculations suggest that in the
threshold of the nineties, Portugal had one of the highest degrees of self-sufficiency in manufacturing goods among small and medium sized OECD economies.10
Across the nineties, it became clear that the degree of openness of the Portuguese economy, measured by the relation of exports of goods to GDP,11
remained not only relatively low, but also, unlike most other small and medium sized European economies, it has even decreased between 1990 and 1997 (table 3). Total exports of goods and services (where Portugal has an important comparative advantage in tourism) show a similar pattern: their relation to GDP is comparatively low (including lower to that of Euro zone), and also has decreased between 1990 and 1996.12
On the other hand, it must be stressed that Ireland is not alone; some other small European countries that performed well in the same period, Finland for example, also became significantly more open. Furthermore, despite its greater economic size, that presupposes a lesser degree of openness, Spain is also doing far better in this regard, and is now very close to the Portuguese level, and the gap is still narrower in the exports of goods and services (table 3).13
9 Anyone who is familiar to Portuguese economic problems knows well that the external equilibrium has
historically been reached mainly through transfers, first of all emigrants’ remittances, more recently, transfers from EU also played a significant role in this equilibrium.
10 This degree was for Portugal 72.5%, Ireland 68.6%, Greece 71.3%, Austria 31.6%, Belgium-Luxembourg
29.5%, Denmark 44.3%, Netherlands 51.7%, Sweden 70.6%, Vilares, 1997: 141.
11 There are several reasons that suggested that this is by far the most appropriate measure of openness (in
comparison, for example, with the average of the sum exports plus imports), for the set of countries examined in the table 3. We present here one of them (others are mentioned in the text). Taking into consideration that the Portuguese and Irish economies have no significant formal protective barriers towards foreign exporters (at least in the European context, where are their main trading partners), to measure the degree of openness by the relation of exports (of goods, or goods and services), to GDP, fits well the objective of showing their ability to penetrate and responsiveness to world market.
12 This relation was 34.3% in 1990, and 33.7% in 1996; the decrease is larger if we compare the periods
1986-1990 (32.6%), and 1991-1995 (30.1%); European Commission, 1997: 15.
13 According to OECD figures, the degree of openness (exports of goods to GDP) of the Portuguese economy
Table 4
Public Spending*
(Percentage of GDP)
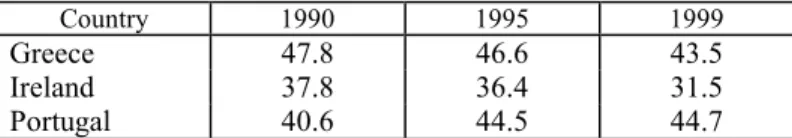
Country 1990 1995 1999
Greece 47.8 46.6 43.5
Ireland 37.8 36.4 31.5
Portugal 40.6 44.5 44.7
* Current expenditures plus capital expenditures Source: OECD Economic Outlook, 2000
We may thus conclude that Portugal has not yet embraced an outward orientation, particularly in the field of export promotion, so characteristic of many of the just mentioned industrialized small countries or the NIEs (Newly Industrialized Economies), and that Portuguese economy remains relatively closed.14 This is not a simple feature without policy consequences, on the
contrary. On this matter, as was stressed by some authors:
“Small open economies to a large extent differ from the policy questions encountered by the bigger (and often less open) economies … whereas small open economies cannot influence the stance of the world economy, they are often substantially exposed to the process of globalization. Indeed, they have no other option but to constantly adjust their economic system … At a more pragmatic level, small open economies lack the financial means and economic leverage to implement policies aimed at specific industries and, consequently, have to focus in generic measures. They opt, for example, for trade liberalization rather than for so-called strategic trade policies” (van Bergeijk et al., 1999: 5).
14 In this sense, we should note that the standard presentation of Portugal "as a small open economy", so popular
Table 5
Portugal and Ireland: Trade with EU and main neighboring partner
1980 1986 1990 1994 1998 1999
PORTUGAL
European Union
Exports (% total) 65.7 75.0 80.5 80.7 82.0 82.8
Imports (% total) 48.7 61.8 71.9 74.3 78.1 77.4
Spain
Exports:
% total 3.6 6.7 13.3 14.6 15.9 17.7
% total intra-EU 5.5 8.9 16.5 18.1 19.4 21.4
Imports
% total 5.5 11.0 14.4 20.0 24.4 24.8
% total intra-EU 11.3 17.7 20.0 26.9 31.2 32.1
IRELAND
European Union
Exports (% total) 79.1 75.7 78.6 73.5 69.3 65.9
Imports (% total) 78.5 76.1 73.9 66.0 61.6 62.4
United Kingdom
Exports
% total 43.1 34.4 34.0 28.1 22.4 21.7
% total intra-EU 54.5 45.2 43.3 38.3 32.4 33.0
Imports
% total 55.5 46.3 47.2 41.4 38.2 37.5
% total intra-UE 70.8 60.8 63.9 62.8 62.0 60.0
Source: INE, Estatísticas do Comércio Externo and Eurostat
We also must note that, as a consequence of the lack of an export drive, Portugal has not benefited from the increasingly higher elasticity of world trade that characterized the nineties in relation to previous postwar decades.15
Illustrative of this weakness, is the fact that, whilst Ireland moved to a large surplus in the current account, the Portuguese current deficit reached very high and increasing levels (8.8% of the GDP in 1999, more than doubling from 1996). As referred above by F. Barry, external and domestic dimensions of
15 According to WTO figures, the elasticity of world merchandise exports to world production was 3.3 in
competitiveness are of course linked and therefore, this contrasting evolution must not, once more, be a surprise.
In relation with the preceding empirical evidence, it is also appropriate to remind that, according to the classical analysis of Balassa, a lower degree of openness has a negative impact on productivity (in so far, due to greater competition, exposed sector tends to be more productive), and consequently in the overall performance of the Portuguese economy, and of course, in the pace of real convergence. In addition, it is interesting to note that, as external trade was decreasing its part, a “non-exposed” sector like public administration – also undoubtedly one of the less efficient across Western Europe -, was increasing its own part in Portuguese GDP, contrary to what happened in Ireland and Greece (table 4).
From a free trade point of view, it must be underlined that, as shown in the Bhagwati’s classical work Protectionism (1988: 73), the emergence of strong and competitive exporting industries is one of the most effective barriers to all kinds of protectionism. This is highly true for small open economies inasmuch they absolutely need imports of inputs, out of any restriction. In these circumstances, imports as well as exports are quite good. Obviously, Portugal still seems far from the fundamentals of this modern economic logic that fosters the world economy.
Considering the global relevance of the external economic relations, other contrasts between the two countries must also be raised. Let us look now at the geographic concentration issue. As tables 5 and 6 show well, the Portuguese trade in the nineties became much more concentrated in Europe, particularly in Spain.16 In fact, Portugal has the highest concentration ratio in EU of all
member States (Silva, 2000), and the smallest participation in extra-EU exports (table 6). The situation can also be illustrated through the fact that, in 1998, extra-EU trade GDP ratio was only 6% for Portugal, and 9,7% for EU-15 (European Commission, 2000: 134).
16 As can be confirmed in the table 5, this is strikingly in contrast with the case of trade between Ireland and
Table 6
Extra-EU Trade by Countries,
Breakdown and Evolution 1990, 1995, 1996 and 1985-1996
(ranked according to exports of goods in 1996)
Imports Exports
1990 1995 1996
% annual change 1985-96
1990 1995 1996
% annual change 1985-96 Germany 23.2 25.7 24.7 5.0 28.8 29.2 28.3 5.3 France 13.9 12.8 12.7 2.9 15.5 14.9 14.5 4.5 Italy 12.3 11.3 11.0 0.8 12.7 13.3 14.2 5.4 United Kingdom 17.3 17.0 17.9 3.9 15.6 13.3 13.8 3.3 UEBL 5.8 6.3 6.1 5.0 5.0 5.5 5.2 5.0 Netherlands 8.8 9.6 11.0 4.2 5.2 5.4 5.0 3.6 Sweden 3.5 2.9 2.9 2.0 4.3 4.3 4.6 4.6 Spain 5.7 5.0 5.0 2.6 3.8 4.2 4.3 6.3 Austria 2.6 2.2 2.4 3.3 2.7 2.6 2.6 5.3 Finland 1.9 1.4 1.5 0.2 2.0 2.3 2.4 4.8 Denmark 1.8 1.8 1.8 2.8 2.3 2.2 2.1 3.2 Ireland 1.0 1.6 1.6 9.6 1.0 1.6 1.8 10.4 Greece 1.1 1.1 1.3 1.6 0.5 0.6 0.7 4.7 Portugal 1.1 1.2 1.1 2.2 0.6 0.6 0.6 4.4 TOTAL 100.0 100.0 100.0 3,5 100.0 100.0 100.0 4.8 (Total*) (439.4) (544.8) 580.0) - (390.6) (572.2) (623.4) -
* thousand millions ECU Source: Eurostat
Moreover, despite all efforts and advice for a more balance external trade that have been done (Silva, 1990), Portuguese economic links with world regions others than Europe remain quite negligible in the globalization era. This is notably true, as far as US, the growth pole of the last decade at a world scale, are concerned.17 In 1994-1999, US market only absorbed 4.8% of Portuguese
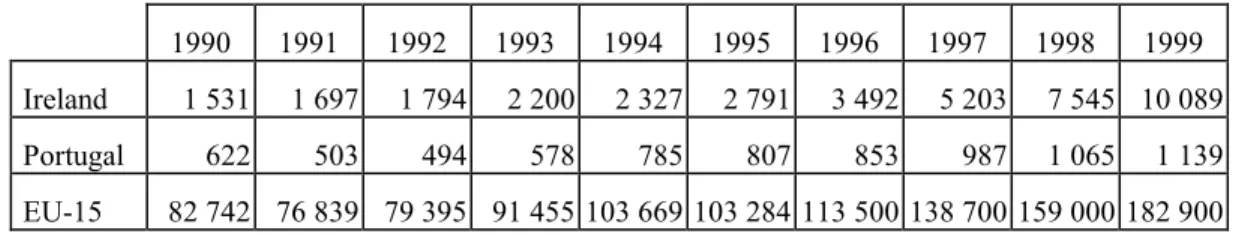
exports, much less than the EU average, 7.5%.18 Moreover, as can be seen in the
table 7, between 1990 and 1999, Irish exports to US had been multiplied by 6.5, those of EU-15 more than doubled, whilst the Portuguese exports had only been increased by 83%, well below the former rates. This evolution not only shows the limited geographical scope of Portuguese trade orientation but also its great lack of flexibility in a constantly changing world economy. Furthermore, unable of taking advantage of the “strong dollar”, and unlike EU-15, the rate of increase of Portuguese exports to US market has even decreased from 1994-1996 to 1997-1999 (the correspondent European rate more than doubled).19
Table 7
Exports to the United States
(Millions of Ecu/euro)
1990 1991 1992 1993 1994 1995 1996 1997 1998 1999
Ireland 1 531 1 697 1 794 2 200 2 327 2 791 3 492 5 203 7 545 10 089
Portugal 622 503 494 578 785 807 853 987 1 065 1 139
EU-15 82 742 76 839 79 395 91 455 103 669 103 284 113 500 138 700 159 000 182 900
Source: Eurostat
In another major aspect of its outward orientation, Ireland favored strongly the inflow of FDI since the 1960s, and it has been highly successful in this regard during the nineties, in particular in the last years of the decade. This is shown in the tables 8 and 9. Portugal had peaks of FDI inflows in 1989-91 (what corresponds, as referred to above, more or less to its period of high growth), later the annual flows became unstable and the pace of increase was clearly reduced (despite a new peak in 1997-98). As far as the stock of FDI inflows is concerned, Portugal also gained some ground in relation to Ireland in the early 1990s but lost it following years, and was, by the end of the decade, in the weakest position amongst all “cohesion countries” (as well as in 1985).20
Table 8
FDI net inflows
(Millions of US dollars)
1985-1990*
1991-1995*
1996-1999* 1991 1992 1993 1994 1995 1996 1997 1998 1999
Ireland 192 1 182 8 066 1 062 1 442 1 121 838 1 447 2 618 2 743 8 579 18 322
Portugal 1 041 1 562 1 755 2 448 1 873 1 534 1 270 685 1 368 2 278 2 802 570
* Annual average
Source: World Investment Report, several issues
Why such a success of Ireland in attracting foreign capitals? According to a report of the European Commission, published in 1999, the answer mainly lies in the following reasons:
20 In fact, in the postwar, Portugal had already a much lower degree of FDI, in comparison with all these
"Ireland now has the largest share in manufacturing of research intensive industries, although these are mainly subsidiaries of MNEs with headquarters outside of the country. Ireland's share of labor intensive industries is the lowest in Europe. Ireland is positively specialized in high growth, highly globalized industries, in the high productivity sector, and has reinforced all of these strengths during the last decade. The structural funds, a tax policy favorable for businesses, the upgrading of its educational system and the return of skilled workers have together created a successful policy mix which attracts and upgrades firms in dynamic industries".
Table 9
Stock FDI inflows
(Millions of US dollars)
1985 1990 1995 1999
Greece 8 309 14 016 19 306 22 948
Ireland 4 649 5 502 11 706 43 969
Portugal 3 463 9 436 17 246 20 513
Spain 8 939 65 916 112 136 112 582
Source: World Investment Report, several issues
This means that Ireland had a comprehensive approach about how to attract FDI, and fully played the internationalization game.
As far as FDI outflows are concerned, the two countries also diverge (table 10). Portugal arrived later to the process, but during the early nineties it had accelerated these flows more quickly than Ireland. However, the relation between the two countries had completely changed by the end of the decade, with Ireland, once more, ahead of Portugal. On the other hand, we must take into account that the Portuguese figures in this regard, are influenced by the strong move to invest in Brazil in 1997-99, one of the main features of Portuguese internationalization (Silva, 2000).
Table 10
(Millions of US dollars)
1985-1990*
1991-1995*
1996-1999* 1991 1992 1993 1994 1995 1996 1997 1998 1999
Ireland 340 378 2 765 195 215 220 438 820 727 1 008 3 906 5 418
Portugal 57 454 2 006 463 687 147 287 688 776 1 667 2 901 2 679
* Annual average
Source: World Investment Report, several issues
It is thus clear that the two economies are in a very different position in relevant areas of the external sector like trade and investment, and all these facts must be considered in the evaluation of their performance in the decade.
4. ON SPECIALIZATION AND COMPETITIVENESS ISSUES
Why these relative difficulties in production of the Portuguese economy, particularly in its links with the world economy? The answer leads us to a deeper inquire about how far have gone the specialization and competitiveness processes. Let us see this point more closely.
Firstly, as far as Portuguese agricultural sector is concerned, Castro (1991) refers that in the first years of EC membership, instead of starting the necessary specialization of agriculture, where comparative advantages were not so obvious in many sectors, the diversification was maintained, if not increased, and the situation has not yet changed substantially. In an overall view, Portuguese agriculture lagged far behind all the others of member States, and inner rural areas became the poorest of the Community. Meanwhile, Ireland had been specialized in the sector, promoted the increase of production and productivity, and contrary to Portugal became a beneficiary of CAP (Mateus, 1998: 153). Certainly, Ireland has its own agriculture problems, but similar to those of most other EU member States (Matthews, 1995).
However, Portuguese specialization lies more on manufacturing industries and in the services (Silva, 2000). So, concerning the specialization of the manufacturing,21 the authors of the Report to the European Commission (1999)
21 Here, we analyze only the manufacturing industries. In relation to services, it is possible that they will have in
on this matter, found a basically stable European context in the nineties ("a weak overall tendency to an increasing production specialization", and "a weak overall tendency for export specialization to decrease"). However, they underlined the peculiarities of our two countries:
"Ireland maintained its position as the most specialized country - during the decade, it continued to intensify its specialization ...
Portugal is the exception, insofar as specialization is decreasing strongly and robustly in both production and trade. This declining specialization reflects the shrinking share of the textile industry, which once accounted for 13.4% of production, but dropped to 9.4% in 1998. Food production and wood related industries also lost ground" (European Commission, 1999:18).
Therefore, in the main industries and sectors, Ireland has deeply been specialized, whilst Portugal has not yet known a comparable process, and is still in a changing landscape in this crucial regard. More precisely, Portugal has not yet coped at a mature stage, with specialization and competitiveness issues and decisions. It is true that the textile, clothing and footwear industries had likely an excessive high proportion of Portuguese production and exports in the early nineties, because of European protection against outside world, particularly developing countries (Silva, 2000). Of course, in our view, this protectionist situation should change without delay, but a radical shift with neglect of these industries, without their competitive transformation, would be a very costly and uncertain process that puts in question a well-established comparative advantage of the country. In 1998, a certain number of advanced economies remain quite competitive in these areas: Germany was the first world exporter in textile, and Italy is the second in clothing (after China/Hong Kong). Moreover, the United States, despite their leading role in the information technology sector that propelled the world economy in the meantime, also increased the participation in the world exports of textile and clothing between 1990 and 1998.22
However, in 1998, they only represented a quarter of total Portuguese exports, and the problems put by their upgrading (in tourism for example, Silva, 2000), are rather similar to those
of manufacturing industries.
22 Textile from 4.8% of the world exports in 1990 to 6.1% in 1998; clothing 2.4% to 4.9%. In this point, we use
Concerning the Portuguese situation, the fate of the Porter Report is very meaningful in this regard.23 When publicly presented in the initial years of the
nineties, it was of course something imperfect, but it was also a step forward in the good direction, i.e., the search for a more comprehensive Portuguese orientation and to enable crucial decisions in the field of specialization and international competitiveness. Moreover, instead of waiting for a "revolution in competitiveness", coming from above, the Report advocated a more subtle way based mainly on the upgrading of the so-called “traditional” sectors where Portugal had some degree of comparative advantage (including the improvement of use and production of correlated equipment and machinery, in the logic of the clusters). In short, refusing high and risky stakes through the launching of completely new capital intensive industries, Porter’s proposition only followed the historical pattern of many other European countries.24 In this
regard, the example of Italy’s upgrading in the postwar is of course relevant to Portugal.25 In fact, a lot of similarities in production and trade exist between
these two countries, in particular as far as clothing, textile, shoe, ceramics, and marble industries are concerned (Silva, 1990: 94). However, not only about Italy, but also in general terms, a serious debate was never started on this decisive subject, still less the implementation of any policies deriving from it, and the project the Report was supposed to promote, was given up and sadly forgotten afterwards26.
So, it is far from well established what Portugal must produce and how, to which production and exports the country should guide its efforts or address its incentives. Without a profound debate followed by practical measures, the country fell in a persistent ambiguity, if not in a state of confusion and inertia, on central issues of specialization and international competitiveness. This has obvious effects in the global economic performance and for taking advantage of existing opportunities in the world economy. The Irish experience shows
23 For details on this document, see M. E. Porter, 1994.
24 See in particular, his work The Competitive Advantage of Nations, 1990.
25 In this sense, it is also worth to remember the case of textile industries in Italy, the same European Report we
have been quoting, points out: "The shares of textile industries have been decreasing slightly, but less so than in other countries. This led to increasing market shares for Italy in this sector, and more generally to its share in labor intensive industries. It has also increased the dissimilarity in Italy's production structure compared to the EU average. However, Italy is focusing on the quality segment of textile industries, and the unit value of its exports is significantly higher than the European average"; European Commission, 1999: 16.
26 Taking into account the suggestions made by the Report (Porter, 1994), in order to strengthen the wood
well the importance of a strategy, existing since the 1960s, in favor of capital intensive industries and foreign capitals; the definition of adequate policies by the end of the 1980s, strongly enhanced the overall ability of Irish economic strategy to cope with the problems of real convergence. The two main options (or the mix, eventually to be adopted) require a different treatment and preparation, and these problems have not yet been satisfactorily put and solved in Portugal. For instance, newly capital intensive industries, like in Ireland, will benefit less from the learning curve, and consequently demand a long period to bear fruits.27 Whatever the strategy and policies that may be followed, great
resources for training and high quality standards in education that sometimes demand quite a generation to be created and developed, are always required. Without a clearer and more transparent orientation in these matters, established in due time, Portugal has not yet enough high qualified skills neither for the launching of new capital intensive industries nor for the improvement of quality in the so-called “traditional” industries.
5. CONCLUDING REMARKS
During most of the nineties, Portugal has thus slowed down the pace of convergence to EU level, particularly in the late years. This move puts a set of problems that we cannot dodge. Very likely, this is the result of policies and strategies adopted (or not!) throughout the decade. So far that are no clear and appropriate decisions taken on central issues for a sustainable upgrading of Portuguese economy. After trying to explain its difference in relation to Irish economic performance, we want to raise some more points in the final part of this paper.
First, in particular since 1987, Portugal is benefiting from EU structural funds, including cohesion funds, whose raison d'être is just for accelerating not to
27 We must point out that the Irish strategy, based on capital intensive industries was criticised in the seventies,
reduce the pace of real convergence.28 From an economic as well as political
point of view, these funds should be by their own nature, temporary and not to last indefinitely.29 This is why the Marshall Plan remained such an important
mark in European economic history. On the other hand, this means that beneficiary countries should be aware of how to use them wisely and to look effectively for reaching the major objective of convergence, and not taking them for granted whatever happens (what, for instance, would be a practical obstacle to future enlargements, and in the case of misuse, would contribute to weaken the country’s position). If necessary, the successful experience of Ireland in the nineties, where structural funds played a relevant role too, gave still more weight to the argument of an open recognition of their temporary nature.
Second, now, when the Irish experiment is widely celebrated, it is worth to remind with more details that it was not a strategy without costs. By the end of the eighties, the country has engaged a set of structural reforms like a balanced budget, a fiscal reform (reduction of the revenue tax, improvement of fiscal administration, etc.), social policies combining more equity with improved efficiency of social systems, and the implementation of development-oriented policies (Geary, 1992: 269). Because of the painful industrial restructuring, unemployment has increased, and only in the last years it decreased significantly (the standardized unemployment rate was, in annual base de 14,5% em 1990, reaching a maximum of 15,6% in 1993, being 6,2% at the end of 1999). However, "this program has benefited from a large political consensus, it reached a high level of credibility (domestically, as well as in EU and in the rest of the world), and it took wisely advantage of the expectations of economic agents" (Silva and Lima, 1997: 5). So, the main political and social forces had the courage to implement the necessary reforms that paved the way for future economic convergence.30
28 Clearly, in the nineties, the Portuguese economy was more successful in the nominal convergence (European
Commission, 1997), than in the real convergence. The Cohesion Fund in particular, aimed at a better combination of both.
29 In principle, structural funds should of course be maintained, but applied according to the trade cycle,
long-term industrial restructuring and other similar reasons, which are obviously temporary and can affect any part of the European Union.
30 This is particularly true as far as European integration is concerned. In contrast, in the middle of the nineties,
Third, it is clear by the end of the nineties, that Portugal will have increased overseas responsibilities in the near future, particularly in Brazil, Portuguese-speaking African countries and East Timor. This bigger international role only can be efficiently played, if it is based on a higher level of development and sound economic foundations in order to release a greater amount of resources, namely financial, to the partnership with all these countries (as well as triangular partnerships), and giving them good examples in economic management, macro or micro. This increases and not diminishes the importance of the catching up process and of the adoption of policies that can lead to it (and requires more not less qualified ties with European Union and other developed regions of the world like the United States), particularly in the fields where the country needs them more as is obviously the case of the external sector.
Of course, Irish experience cannot be transplanted to Portugal, but there is at least one lesson to be learned. Putting it into the context: in no way we question macroeconomic stability and the well-founded principles of the Maastricht Treaty and of the Stability and Growth Pact. However, under the circumstances prevailing in most time of the last decade, for a truly small open economy, the criteria for nominal convergence, after their achievement (or credible trend in this sense) should have been seen as given, and also, we should look at beyond them. In fact, overemphasizing exclusively the need of macroeconomic stability, we have neglected since the early 1990s, the implementation of a commercial strategy (including the stimulus to develop an export and competitive culture).31 Of course, it only would be successfully achieved as a
part of a set of structural reforms. In the absence of such a strategy, Portuguese economy remained too closed and without active and sustained long term external policies. However, from a global point of view, this is the main practical lesson of postwar to countries seriously aiming at a catching up
rejected on the basis of the large national consensus on Portuguese European integration. At the same time, Ireland looked closely attached to EMU economic strategy (the referendum already belonged to the traditional Irish standing towards European integration main steps). This courageous and far-reaching Irish strategy (as well as that of Finland), accepting fully the essential of EMU, must be emphasized taking into consideration the rather different position of neighboring United Kingdom. Likely, outside observers and economic agents negatively perceived the Portuguese fluctuation.
31 In particular, after the entry of escudo in EMS, in 1992, the policy incentives to extra-price competitiveness
REFERENCES
AGUIAR, Álvaro, e FIGUEIREDO, Octávio, (1999), “Abertura e Convergência da Economia
Portuguesa, 1870-1990”, Estudos de Economia, Vol. XIX, nº 2, Spring, pp. 209-232.
BALASSA, Bela, (1976), “Industrial and Trade Policy in Portugal”, 1ª Conferência
Internacional sobre Economia Portuguesa, The German Marshall Fund of the United
States / Fundação Calouste Gulbenkian, Lisbon, pp. 223-252.
BARRO, Robert J., (1994), Economic Growth and Convergence, Occasional Papers nº 46, International Center for Economic Growth, ICS Press, San Francisco.
BARRO, Robert J., (1996), Getting it Right, Markets and Choices in a Free Society, The MIT Press, 3rd edition, Cambridge, Massachusetts.
BARRO, Robert J., and SALA-I-MARTIN, Xavier, (1991), “Convergence Across States and
Regions”, Brookings Papers on Economic Activity, nº 1, pp. 107-158.
BARRY, Frank, (1999a), "The European Dimension to EU - Periphery Growth: Ireland and Portugal Compared", Issues on the European Economics, Vol. 1, CEDIN/ISEG, Technical University of Lisbon, pp. 47-65.
BARRY, Frank, Ed. (1999b), Understanding Ireland's Economic Growth, MacMillan Press, London.
BARRY, Frank, BRADLEY, John and O'MALLEY Eoin, (1999), "Indigenous and Foreign Industry: Characteristics and Performance", Understanding Ireland's Economic Growth, Ed. F. Barry, Mac Millan Press, London, pp. 45-74.
BHAGWATI, Jagdish, (1988), Protectionism, Paperback edition (7th), The MIT Press, Cambridge, Mass.
CASTRO, Armando A. (1991), "O Uruguay Round e as Opções Portuguesas", Diário de
Notícias, Suplemento Empresas, Outubro.
EUROPEAN COMMISSION, (1997), The Economic and Financial Situation in Portugal – Portugal in the Transition to EMU, Reports and Studies, European Economy, nº 1.
EUROPEAN COMMISSION, (1999), The Competitiveness of European Industry, 1999 Report, Luxembourg, xiv-100 p.
EUROPEAN COMMISSION, (2000), Report on the Implementation of the Broad Economic Policy Guidelines, European Economy, nº 1.
GEARY, Patrick T., (1992), "Ireland's Economy in the 1980s: Stagnation and Recovery - A Preliminary Review of Evidence", The Economic and Social Review, Vol. 23, nº 3, April, pp. 253-281.
LAINS, Pedro, (1994), “O Estado e a Industrialização em Portugal, 1945-1990”, Análise
Social, Vol. XXIX (128), 4º, Lisbon, pp. 923-958.
MATEUS, Abel, (1998), Economia Portuguesa desde 1910, Verbo, Lisbon.
MATTHEWS, Alan, (1995), "Agricultural Competitiveness and Rural Development", The
Economy of Ireland, Policy and Performance of a Small European Country, Ed. J. W.
O'Hagan, MacMillan Press / St. Martin Press, London & New York, pp. 328-362.
NEVES, João L. César, (1995), "Portuguese Postwar Growth: A Global Approach",
Economic Growth in Europe since 1945, Eds N. Crafts and G. Toniolo,
CEPR/Cambridge University Press, pp. 329-354.
OECD, (1999), Portugal, Economic Surveys, Paris.
Ó GRÁDA, Cormac, and O'ROURKE, Kevin, (1995), "Economic Growth: Performance and Explanations", The Economy of Ireland, Policy and Performance of a Small European
Country, Ed. J. W. O'Hagan, Macmillan Press / St. Martin's Press, London & New
York, pp. 198-227.
O'HAGAN, J.W., Ed., (1995), The Economy of Ireland, Policy and Performance of a Small
European Country, MacMillan Press / St. Martin Press, London & New York.
PORTER, Michael E., (1990), The Competitive Advantages of Nations, Free Press, New York.
PORTER, Michael E., Dir., (1994), Construir as Vantagens Competitivas de Portugal, Forum para a Competitividade, Lisboa.
SILVA, Joaquim Ramos, (1990), "Luso-American Economic Relations and Portuguese Membership of the European Community", Portugal: An Atlantic Paradox,
Portuguese/US Relations after EC Enlargement, IEEI, Lisbon, pp. 77-139.
SILVA, Joaquim Ramos, (1995), “Duas Vias para a Economia Portuguesa: Entre Adesão
Plena e Adesão Relutante”, Por Onde Vai a Economia Portuguesa? Actas da Conferência Realizada por Ocasião do Jubileu Académico de Francisco Pereira de Moura, ISEG, Lisboa, pp. 553-561.
SILVA, Joaquim Ramos, (1997), "As Grandes Correntes do Comércio Mundial", Comércio e
Investimento Internacional, Teorias e Técnicas; Coord. António Romão, ICEP, pp.
61-94.
SILVA, Joaquim Ramos, (2000), Panorama das Relações Económicas Luso-Brasileiras: A
SILVA, Joaquim Ramos, and LIMA, Maria Antonina, (1997), L'expérience européenne des
"pays de la cohésion": rattrapage ou périphérisation accrue?, Institut Orléanais de
Finance (Série "Économie Internationale", 1-1997/1/EI), Faculté de Droit, d'Économie et de Gestion, 41 p.
Van BERGEIJK, Peter A. G., SINDEREN, Jarig van, and VOLLAARD, Ben A., Eds (1999),
Structural Reform in Open Economies: A Road to Success? Edward Elgar , Cheltenham,
UK/Northampton, MA, USA.
VILARES, Manuel J., et al., (1997), Indicadores de Competitividade da Economia