“The relative roles of CO
2
and palaeogeography in determining late
Miocene climate: results from a terrestrial model-data comparison”
published in Clim. Past, 8, 1257–1285, 2012
C. D. Bradshaw1, D. J. Lunt1, R. Flecker1, U. Salzmann2, M. J. Pound2,3,4, A. M. Haywood3, and J. T. Eronen5,6 1Bristol Research Initiative for the Dynamic Global Environment (BRIDGE), School of Geographical Sciences, University of
Bristol, University Road, Bristol, BS8 1SS, UK
2School of the Built and Natural Environment, Northumbria University, Newcastle upon Tyne, NE1 8ST, UK 3School of Earth and Environment, University of Leeds, Leeds, LS2 9JT, UK
4British Geological Survey, Kingsley Dunham Centre, Keyworth, Nottingham, NG12 5GG,UK
5Department of Geosciences and Geography, P.O. Box 64, 00014, University of Helsinki, Finland
6Biodiversity and Climate Research Centre LOEWE BiK-F, Senckenberganlage 25, 60325 Frankfurt am Main, Germany
Correspondence to:C. D. Bradshaw ([email protected])
In the original manuscript, Figs. 7–16 included fonts which were not correctly embedded in the file. As such, unless cer-tain propriety software (ArcGIS) is installed on the viewing platform, the figures will appear corrupted. In this Corrigen-dum, Figs. 7–16 and their captions are reproduced with the fonts correctly embedded.
Please find the correct figures below.
> 5°C warmer 2 - 5°C warmer < 2°C warmer overlap < 2°C cooler 2 - 5°C cooler > 5°C cooler
Late Miocene Data - Modern Observations (CTRLc) Microflora
Late Miocene Data - Modern Observations (CTRLc) Macroflora
Late Miocene Data - Modern Observations (CTRLc) Fauna
M
e
s
s
in
ia
n
T
o
rt
o
n
ia
n
A
B
C
> 5°C warmer 2 - 5°C warmer < 2°C warmer overlap < 2°C cooler 2 - 5°C cooler > 5°C cooler
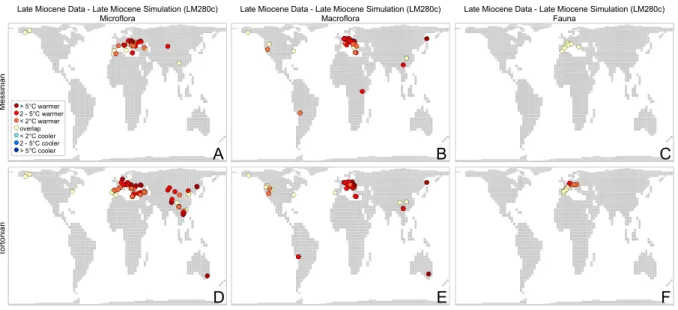
Late Miocene Data - Late Miocene Simulation (LM280c) Microflora
Late Miocene Data - Late Miocene Simulation (LM280c) Macroflora
Late Miocene Data - Late Miocene Simulation (LM280c) Fauna
M
e
s
s
in
ia
n
T
o
rt
o
n
ia
n
A
B
C
D
E
F
Fig. 8.Results from the model–data comparison for mean annual temperature, late Miocene data–LM280c.
> 5°C warmer 2 - 5°C warmer < 2°C warmer overlap < 2°C cooler 2 - 5°C cooler > 5°C cooler
Late Miocene Data - Late Miocene Simulation (LM400c) Microflora
Late Miocene Data - Late Miocene Simulation (LM400c) Macroflora
Late Miocene Data - Late Miocene Simulation (LM400c) Fauna
M
e
s
s
in
ia
n
T
o
rt
o
n
ia
n
A
B
C
D
E
F
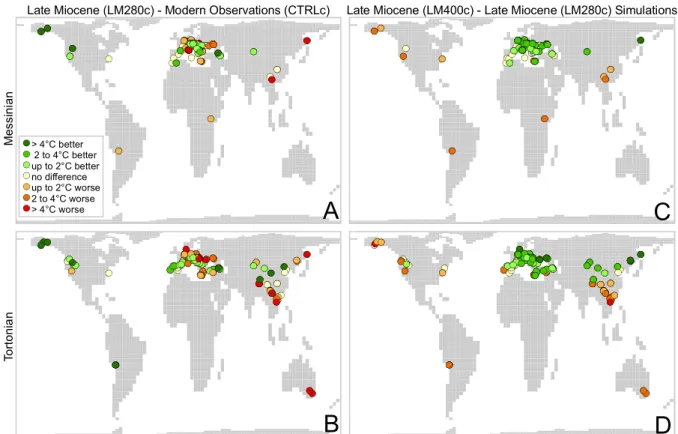
> 4°C better 2 to 4°C better up to 2°C better no difference up to 2°C worse 2 to 4°C worse > 4°C worse
M
e
s
s
T
o
rt
o
n
ia
n
A
C
B
D
Fig. 10. Improvements in the model–data comparison for mean annual temperature. The lefthand column(A, B)shows the improvement that the late Miocene palaeogeography makes to the model–data comparison. The righthand column(C, D)shows the improvement that higher CO2makes to the model–data comparison. Green circles indicate an improvement; red circles indicate a deterioration. The datapoints
showing “no difference” are plotted underneath the other datapoints in order to highlight the differences.
> 500mm drier 250-500mm drier < 250mm drier overlap < 250mm wetter 250-500mm wetter >500mm wetter
Late Miocene Data - Modern Observations (CTRLc) Microflora
Late Miocene Data - Modern Observations (CTRLc) Macroflora
Late Miocene Data - Modern Observations (CTRLc) Fauna
M
e
s
s
in
ia
n
T
o
rt
o
n
ia
n
A
B
C
> 500mm drier 250-500mm drier < 250mm drier overlap < 250mm wetter 250-500mm wetter >500mm wetter
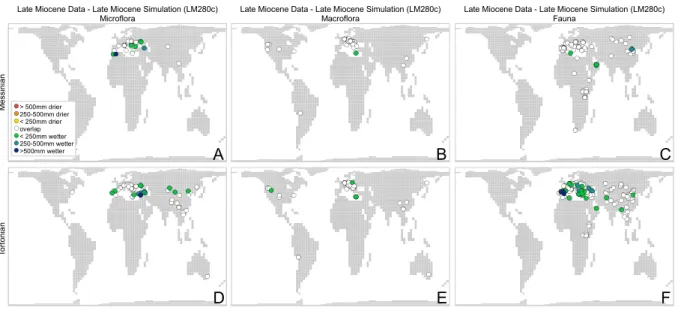
Late Miocene Data - Late Miocene Simulation (LM280c) Microflora
Late Miocene Data - Late Miocene Simulation (LM280c) Macroflora
Late Miocene Data - Late Miocene Simulation (LM280c) Fauna
M
e
s
s
in
ia
n
T
o
rt
o
n
ia
n
A
B
C
D
E
F
Fig. 12.Results from the model–data comparison for mean annual precipitation, late Miocene data–LM280c.
> 500mm drier 250-500mm drier < 250mm drier overlap < 250mm wetter 250-500mm wetter >500mm wetter
Late Miocene Data - Late Miocene Simulation (LM400c) Microflora
Late Miocene Data - Late Miocene Simulation (LM400c) Macroflora
Late Miocene Data - Late Miocene Simulation (LM400c) Fauna
M
e
s
s
in
ia
n
T
o
rt
o
n
ia
n
A
B
C
D
E
F
> 10cm better 5 - 10cm better < 5cm better no difference < 5cm worse 5 - 10cm worse > 10cm worse
Late Miocene (LM280c) - Modern Observations (CTRLc) Late Miocene (LM400c) - Late Miocene (LM280c) Simulations
M
e
s
s
in
ia
n
T
o
rt
o
n
ia
n
A
C
B
D
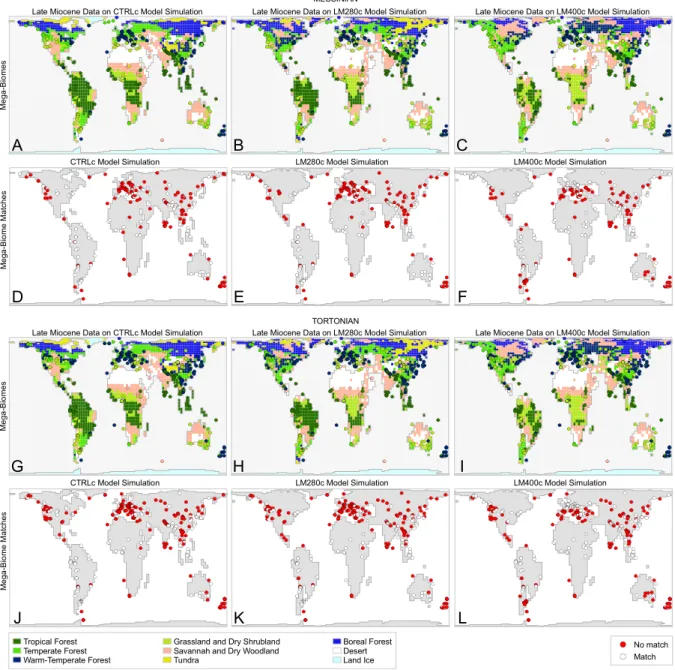
Tropical Forest Temperate Forest Warm-Temperate Forest
Grassland and Dry Shrubland Savannah and Dry Woodland Tundra
Boreal Forest Desert Land Ice
No match Match MESSINIAN
TORTONIAN
M
e
g
a
-B
io
m
e
M
a
tc
h
e
s
D
E
F
M
e
g
a
-B
io
m
e
s
Late Miocene Data on CTRLc Model Simulation Late Miocene Data on LM280c Model Simulation Late Miocene Data on LM400c Model Simulation
A
B
C
CTRLc Model Simulation LM280c Model Simulation LM400c Model Simulation
M
e
g
a
-B
io
m
e
M
a
tc
h
e
s
J
K
L
M
e
g
a
-B
io
m
e
s
Late Miocene Data on CTRLc Model Simulation Late Miocene Data on LM280c Model Simulation Late Miocene Data on LM400c Model Simulation
G
H
I
CTRLc Model Simulation LM280c Model Simulation LM400c Model Simulation
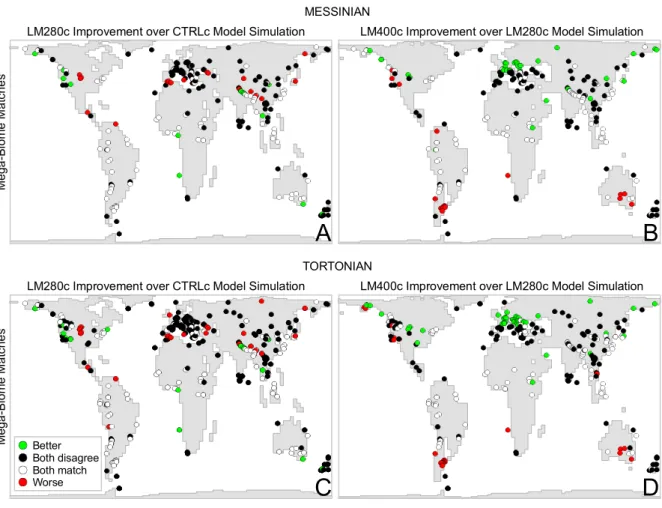
Better Both disagree Both match Worse
M
e
g
a
-B
io
m
e
M
a
tc
h
e
s
C
D
LM280c Improvement over CTRLc Model Simulation LM400c Improvement over LM280c Model Simulation TORTONIAN
M
e
g
a
-B
io
m
e
M
a
tc
h
e
s
A
B
LM280c Improvement over CTRLc Model Simulation LM400c Improvement over LM280c Model Simulation MESSINIAN
Fig. 16. Improvements in the model–data comparison for megabiomes. Panels(A)and(C)show the improvement that the late Miocene palaeogeography makes to the model–data comparison. Panel(B)and(D)show the improvement that higher CO2makes to the model–data