Comparative Evaluation of Transcriptomes Based on RNA
Sequencing and Microarrays
Rajandeep S. Sekhon1,2, Roman Briskine3, Candice N. Hirsch4,5, Chad L. Myers3, Nathan M. Springer6, C. Robin Buell4,5, Natalia de Leon1,2, Shawn M. Kaeppler1,2*
1Department of Agronomy, University of Wisconsin, Madison, Wisconsin, United States of America,2Department of Energy Great Lakes Bioenergy Research Center, University of Wisconsin, Madison, Wisconsin, United States of America,3Department of Computer Science and Engineering, University of Minnesota, Minneapolis, Minnesota, United States of America,4Department of Plant Biology, Michigan State University, East Lansing, Michigan, United States of America,5Department of Energy Great Lakes Bioenergy Research Center, Michigan State University, East Lansing, Michigan, United States of America,6Microbial and Plant Genomics Institute, Department of Plant Biology, University of Minnesota, Saint Paul, Minnesota, United States of America
Abstract
Transcriptome analysis is a valuable tool for identification and characterization of genes and pathways underlying plant growth and development. We previously published a microarray-based maize gene atlas from the analysis of 60 unique spatially and temporally separated tissues from 11 maize organs [1]. To enhance the coverage and resolution of the maize gene atlas, we have analyzed 18 selected tissues representing five organs using RNA sequencing (RNA-Seq). For a direct comparison of the two methodologies, the same RNA samples originally used for our microarray-based atlas were evaluated using RNA-Seq. Both technologies produced similar transcriptome profiles as evident from high Pearson’s correlation statistics ranging from 0.70 to 0.83, and from nearly identical clustering of the tissues. RNA-Seq provided enhanced coverage of the transcriptome, with 82.1% of the filtered maize genes detected as expressed in at least one tissue by RNA-Seq compared to only 56.5% detected by microarrays. Further, from the set of 465 maize genes that have been historically well characterized by mutant analysis, 427 show significant expression in at least one tissue by RNA-Seq compared to 390 by microarray analysis. RNA-Seq provided higher resolution for identifying tissue-specific expression as well as for distinguishing the expression profiles of closely related paralogs as compared to microarray-derived profiles. Co-expression analysis derived from the microarray and RNA-Seq data revealed that broadly similar networks result from both platforms, and that co-expression estimates are stable even when constructed from mixed data including both RNA-Seq and microarray expression data. The RNA-Seq information provides a useful complement to the microarray-based maize gene atlas and helps to further understand the dynamics of transcription during maize development.
Citation:Sekhon RS, Briskine R, Hirsch CN, Myers CL, Springer NM, et al. (2013) Maize Gene Atlas Developed by RNA Sequencing and Comparative Evaluation of Transcriptomes Based on RNA Sequencing and Microarrays. PLoS ONE 8(4): e61005. doi:10.1371/journal.pone.0061005
Editor:Meng-xiang Sun, Wuhan University, China
ReceivedDecember 18, 2012;AcceptedMarch 5, 2013;PublishedApril 23, 2013
Copyright:ß2013 Sekhon et al. This is an open-access article distributed under the terms of the Creative Commons Attribution License, which permits unrestricted use, distribution, and reproduction in any medium, provided the original author and source are credited.
Funding:This work was supported by the Department of Energy Great Lakes Bioenergy Research Center (Department of Energy Biological and Environmental Research Office of Science grant no. DE–FC02–07ER64494). RB and CLM were partially supported by Grant DBI-0953881 and Grant IOS-1126950 from the National Science Foundation. The funders had no role in study design, data collection and analysis, decision to publish, or preparation of the manuscript.
Competing Interests:The authors have declared that no competing interests exist.
* E-mail: [email protected]
Introduction
Knowledge of the genome, transcriptome, proteome, and metabolome is the basis of systems biology, a holistic approach that strives to understand the role and interaction of individual components in shaping the phenotype. Revolutionary genomic technologies developed over the past decade have resulted in the generation of rich information about the genomes and transcrip-tomes of many species. This has led to increased efforts to understand gene function and expression networks that vary temporally and spatially through development of an organism. In plants, transcriptome profiles during development have been documented in several species including Arabidopsis (Arabidopsis thaliana) [2], maize (Zea mays) [1], rice (Oryza sativa) [3], soybean (Glycine max) [4], barley (Hordeum vulgare) [5], and Medicago (Medicago truncatula) [6].
Traditionally, genome-wide transcriptional analysis has been performed using microarray technologies. For instance, some of the early work in maize was based on spotted cDNA amplicons [7–10], a technology which was replaced by spotted oligonucle-otide arrays [11]. With the development ofin situDNA synthesis approaches, platforms such as Affymetrix served as the primary tool for transcriptomic analysis [12–14]. Transcriptome analysis efforts have been further enabled by the completion of reference genomes [15]. Previously, we utilized the maize genome sequence to design a custom NimbleGen array and develop a gene atlas that documents expression patterns through maize development [1].
annotation, the use of microarrays could result in missing expression information for a substantial number for genes not available or annotated at the time of array design. Second, reliance of microarray technology on DNA-DNA hybridization can potentially lead to inaccurate expression estimates for genes sharing high sequence homology. Finally, due to background noise and signal saturation, the dynamic range of expression obtained from microarrays is limited and, therefore, may not be suitable for comparing very highly or lowly expressed genes.
The development of high-throughput ‘‘next-generation’’ se-quencing technologies has enabled the use of RNA sese-quencing (RNA-Seq) as an attractive alternative to microarrays for transcriptome analyses [16]. A major advantage of RNA-Seq technology is flexibility since the data can be reanalyzed to obtain updated information as the genome sequence and annotation evolves, and the stringency of mapping parameters can be adjusted to potentially discern expression of highly homologous genes. In addition, with the cost of sequencing decreasing in recent years, this technology is rapidly decreasing in cost. Several recent studies have exploited this technology to generate transcriptome infor-mation for many plant species including Arabidopsis [17], rice [18,19], and soybean [4,20]. In maize, RNA-Seq has been used to develop detailed transcriptome information for leaf [21] and inflorescence [22,23].
In this study, we used RNA-Seq to obtain expression profiles for samples previously profiled using a microarray [1] to enhance the resolution in expression of gene family members and to permit assessment of expression across the entire genome. We performed several analyses to compare the effectiveness of the two technologies in providing genome-wide gene expression estimates. We also examined the quality of co-expression networks developed from the two data sets. This data is available to the community to serve as a complementary resource to the microarray-based expression atlas.
Materials and Methods
Plant materials, growing conditions and RNA extraction
Remnant total RNA from a subset of samples used for the microarray-based maize gene atlas [1] was used for this experiment. The tissue samples were obtained from reference inbred line B73 plants grown at the West Madison Agricultural Research Station (Verona, WI) during summer 2008. Growing conditions, sampling method, and detailed description of the samples and other relevant information are as previously described [1]. The list of samples included in this study is provided in Table 1.
Calculation of RNA-Seq expression values
From approximately 5mg of total RNA, mRNA was isolated, fragmented, converted to cDNA, and PCR amplified according to the Illumina RNA-Seq protocol (Illumina, Inc. San Diego, CA). Sequence reads were generated using the Illumina Genome Analyzer II (San Diego, CA) and Illumina HiSeq 2000 (San Diego, CA) at the University of Wisconsin Biotechnology Center (Madison, WI). Illumina barcodes were used to multiplex a portion of the samples. Sequence reads generated were between 35 and 101 bp single-end reads. Sequencing platform, multiplexing, and read length for each sample can be found in Table S1. RNA-Seq read quality was evaluated based on the Illumina purity filter and distribution of base quality scores at each cycle. All data presented passed the quality control filtering based on these metrics. Sequences are available in the Sequence Read Archive at
the National Center for Biotechnology Information (accession number SRP010680).
Sequence reads for each tissue were mapped to v1 and v2 of the B73 reference pseudomolecules (http://ftp.maizesequence.org/) [15] using Bowtie version 0.12.7 [24] and the splice site aware aligner TopHat version 1.2.0 [25]. The minimum and maximum intron length was set to 5 bp and 60,000 bp respectively; all other parameters were set to the default values. Gene model annotation was not provided during the read mapping. Normalized gene expression values expressed as fragments per kilobase pair of exon model per million fragments mapped (FPKM) were determined using Cufflinks version 0.9.3 [26]. The maximum intron length was set to 60,000 bp and the quartile normalization option was used. For the alignments to the v1 pseudomolecules, the 4a.53 annotation (http://ftp.maizesequence.org/) was provided as the reference annotation and the v1 pseudomolecules were provided for the bias detection and correction algorithms. For the alignments to the v2 pseudomolecules, the 5b annotation (http://ftp.maizesequence.org/) and v2 pseudomolecules were provided. The default settings were used for all other parameters. An average of FPKM value of three replicates was used for all the analyses.
Microarray and RNA-Seq correlations
Microarray and RNA-Seq expression values were based on mapping the probes (microarray) or reads (RNA-Seq) to version 4a.53 for direct comparison of these analyses with the microarray data set published earlier [1]. In case of multiple annotated transcripts per genes, a transcript encoding the longest peptide was chosen. Since the microarray design did not cover all the 4a.53 gene models due to lack of a pseudomolecule assembly at the time of design, this comparison was based on 22,151 genes common between the microarray and RNA-Seq data sets. Correlations were calculated for all 22,151 genes as well as for a subset of genes that were expressed in both data sets. For the correlation estimates based only on expressed genes, 19,744 genes with average expression value of at least 200 in one of the 60 tissues included in earlier study [1] were selected from the microarray dataset. For RNA-Seq data set, genes with an FPKM 95% confidence interval lower boundary greater than zero [27], as defined by Cufflinks [26], in at least one of the tissues were designated as transcribed and chosen for correlation analysis. Based on this criterion, 1,933 genes from the set of 19,744 genes expressed in microarray were not expressed in RNA-Seq data set and hence removed. In all, 17,811 unique transcripts were used for this analysis. Log2
transformed values were used for correlation calculations. To avoid taking the log of a number less than 1, all such FPKM values were replaced by 1.
Principal Component Analysis
Principal Component Analysis (PCA) was performed using the Spotfire DecisionSite for Functional Genomics (DSFG) package (http://spotfire.tibco.com/). FPKM values and RMA-normalized log2-transformed expression values were used for the RNA-Seq
and microarray data, respectively. To avoid taking the log of a number less than 1, all such FPKM values were replaced by 1. The analysis involved k-means clustering in order to group genes into 1000 clusters followed by PCA.
Hierarchical clustering
Coexpression network analysis
Genes that did not have detectable expression levels in either dataset were removed leaving 19,328 filtered gene set (FGS) genes for further analysis. For the microarray dataset, genes with the average expression value exceeding 200 in at least one of the tissues were considered expressed. In case of RNA-Seq, the average expression value of a gene had to be greater than 0 FPKM in at least one of the 18 tissues. Due to the differences in dynamic ranges of the two platforms, we applied log2transformation to the
microarray expression data and inverse hyperbolic sine transfor-mation to the RNA-Seq data. The latter compresses larger values more than smaller values and works well for the values below 1. Individual coexpression networks were generated based on the transformed datasets by calculating Pearson correlation coefficient for each pair of gene expression profiles using Sleipnir library [28]. Fisher transformation and normalization were applied to the values in both coexpression networks [29]. Expression conserva-tion scores were derived by calculating Pearson correlaconserva-tion coefficient for each pair of gene coexpression profiles [30]. The significance of EC score was determined based on the gene’s null expectation derived from the bootstrapping analysis that involved generation of 1,000 random co-expression network pairs by selecting a mixture of RNA-Seq and microarray profiles for the 18 tissue samples.
Results and Discussion
Overview of samples and quality assessment
We used RNA-Seq to profile the transcriptome of 18 tissues representing distinct stages of maize plant development. These tissues are a subset of samples included in a microarray-based gene atlas described previously [1]. For direct comparison of the two
technologies, remnant total RNA from the microarray study was used for RNA-Seq. A complete list, brief description, and plant ontology terms of the samples included in this study are provided in Table 1. For each sample, total RNA from three biological replicates, each composed of pooled tissue from three randomly chosen plants, was subjected to sequencing. For each tissue, we generated between 5 and 28 million single-end (35–101 bp) reads averaged across all three replicates (Table S1). Of these, 55.8 to 88.8% of the reads were mapped to the B73 filtered gene set transcripts (version 5b; www.maizesequence.org) and expression values in units of fragments per kilobase of exon model per million fragments mapped (FPKM) was calculated. While multiple transcripts have been predicted for the majority of maize genes, for this analysis, we selected the transcript encoding the longest peptide to represent each gene. The biological replicates were highly correlated (Figure S1), with an average Pearson’s correlation coefficient between replicates of 0.97160.004 with 83% of the correlations over 0.950 (Table S2). These observations affirmed the technical reproducibility of the RNA-Seq technology and reproducibility of biological replicates despite having variable read numbers, read lengths, and percentage of reads mapped across the tissues and biological replicates.
Global gene expression trends
For all analyses performed on a gene basis, we worked with the transcripts from the FGS that exclude transposons, pseudogenes, contaminants, and other low-confidence annotations. Genes with an FPKM 95% confidence interval lower boundary greater than zero [27], as defined by Cufflinks [26], were designated as transcribed in the RNA-Seq data set. Based on this criterion, 29,447 (74.7%) of the 39,429 genes were transcribed in at least one tissue. Of the non-expressed genes, 18.3% are ab initio genes Table 1.List of tissues included in RNA-Seq-based gene atlas.
# Tissue name Plant ontology term Plant ontology tissue description
1 24H_Germinating Seed PO:0009001 Fruit (Kernel)
2 6DAS_GH_Primary Root PO:0020127 Primary root
3 V3_Stem and SAM PO:0020148 Soot apical meristem
PO:0020142 Stem internode
4 V5_Tip of stage-2 Leaf PO:0025142 Leaf tip
PO:0009025 Vascular leaf
5 V9_Immature Leaves PO:0009025 Vascular leaf
6 16DAP_Endosperm PO:0009089 Endosperm
7 16DAP_Embryo PO:0009009 Plant embryo
8 V9_Eighth Leaf PO:0009025 Vascular leaf
9 V9_Eleventh Leaf PO:0009025 Vascular leaf
10 V9_Thirteenth Leaf PO:0009025 Vascular leaf
11 VT_Thirteenth Leaf PO:0009025 Vascular leaf
12 R2_Thirteenth Leaf PO:0009025 Vascular leaf
13 10DAP_Whole seed PO:0009001 Fruit
14 12DAP_Whole seed PO:0009001 Fruit
15 12DAP_Endopsperm PO:0009089 Endosperm
16 14DAP_Whole seed PO:0009001 Fruit
17 14DAP_Endopsperm PO:0009089 Endosperm
18 16DAP_Whole seed PO:0009001 Fruit
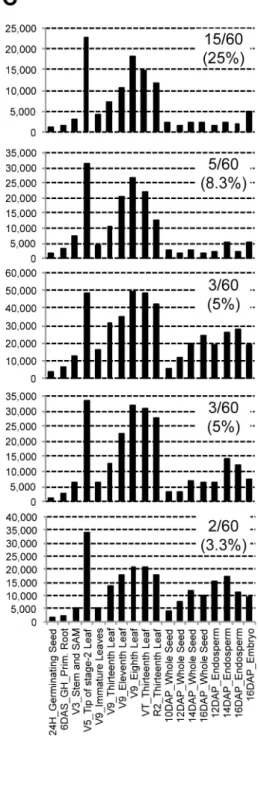
predicted by Fgenesh [31] which accounted for 60.1% of allab initio genes in the current version (5b) of the maize genome. Similarly, 22.3% of the non-expressed genes encode for transcripts with size below 500 bp, which account for 67.6% of all such genes. In contrast, only 0.2% encode for transcripts larger than 5 kb. Finally, 84.4% of the non-expressed genes lack functional annotation according the current data (www.maizesequence.org); these account for 42.6% of all non-annotated genes in the genome. Thus, while some of these genes likely represent those not expressed in the tissues included in this study, others might be poorly annotated. However, some of these genes might encode rare transcripts that were missed due to lower sequencing depth. This is suggested by higher number of non-expressed genes observed in V9_Immature Leaves and 16DAP_Endosperm (Figure S2); both these tissues have lowest number of reads (Table S1).
Classification of transcribed genes on their magnitude of expression showed substantial variation in the range of expression among tissues (Figure S2). Variation in expression was also evident from distribution of FPKM values for all genes (Figure S3A) and expressed genes (Figure S3B). To further investigate the repre-sentation of genes among tissues, a subset of highly expressed genes for each tissue were identified (Table S3) which, in many cases, tended to have specific biological activities characteristic of that tissue. For instance, consistent with initiation of a period of high increase in fresh weight of endosperm at 16 Days After Pollination (DAP), eight out of ten highly expressed genes at this stage encoded zein proteins. Zeins are the major seed storage proteins that account for roughly half of the endosperm proteins [32] and their up-regulation is consistent with dramatic endsperm growth and accumulation of storage compounds at this stage [33]. However, none of the zein-encoding genes were represented among the ten highest expressed genes in 12DAP endosperm in which a gene encoding defensin was the highest expressed gene.
Figure 1. Heat map showing hierarchical clustering of tissues based on global gene expression.Clustering was based on log2 -transformed Fragments Per Kilobase Exon model per Million mapped fragments (FPKM) values of 29,038 genes that were detected in at least one tissue based on the FPKM 95% confidence interval lower boundary greater than zero. Red, yellow, and blue colors indicate high, medium, and low levels of gene log2-transformed expression, respectively. doi:10.1371/journal.pone.0061005.g001
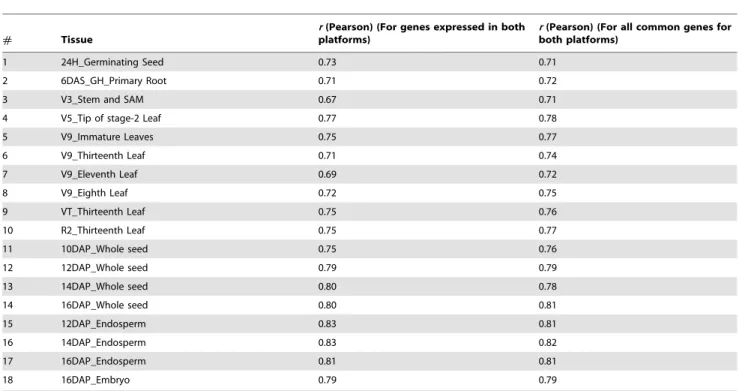
Table 2.Correlations between RNA-Seq and microarray-based expression values.
# Tissue
r(Pearson) (For genes expressed in both platforms)
r(Pearson) (For all common genes for both platforms)
1 24H_Germinating Seed 0.73 0.71
2 6DAS_GH_Primary Root 0.71 0.72
3 V3_Stem and SAM 0.67 0.71
4 V5_Tip of stage-2 Leaf 0.77 0.78
5 V9_Immature Leaves 0.75 0.77
6 V9_Thirteenth Leaf 0.71 0.74
7 V9_Eleventh Leaf 0.69 0.72
8 V9_Eighth Leaf 0.72 0.75
9 VT_Thirteenth Leaf 0.75 0.76
10 R2_Thirteenth Leaf 0.75 0.77
11 10DAP_Whole seed 0.75 0.76
12 12DAP_Whole seed 0.79 0.79
13 14DAP_Whole seed 0.80 0.78
14 16DAP_Whole seed 0.80 0.81
15 12DAP_Endosperm 0.83 0.81
16 14DAP_Endosperm 0.83 0.82
17 16DAP_Endosperm 0.81 0.81
18 16DAP_Embryo 0.79 0.79
Defensins are antimicrobial proteins that protect the seed and developing embryo against pathogens infections [34]. Interesting-ly, consistent with higher oil accumulation in maize embryos, a gene encoding oleosin - structural proteins found in vascular plant oil bodies - was most abundant in 16DAP embryo. Likewise, genes encoding proteins involved in photosynthesis were over-represent-ed in mature leaves e.g. eighth leaf at vegetative 9 (V9) stage and thirteenth leaf at vegetative tasseling (VT) stage. For such tissues with predominance of a specific biological activity, a large proportion of reads might represent the abundantly expressed
genes and, therefore, deeper sequencing will be needed for detection of genes with relatively low expression levels.
Biological identity of the tissues was well reflected in the RNA-Seq-based transcriptome analysis as revealed by hierarchical clustering (Figure 1). A distinct cluster of 6 Days After Sowing (DAS) primary root containing root apical meristem and V3 stem and shoot apical meristem (SAM) indicate commonalities in the transcriptome of meristematic tissues. Germinating seed and embryo each had a distinct transcriptome consistent with the specialized biological function of these tissues. Transcriptional
Figure 2. Principal Component Analysis (PCA) showing similarities between transcriptome profiles produced by RNA-Seq (A) and microarray (B).PCA was performed independently for both datasets. First principal component (PC1) is shown on x-axis while the second principal component (PC2) is shown on y-axis. Tissues belonging to same organ group are represented by different colors of the same shape.
differences among organs at different developmental stages were also well captured as exemplified by leaf tissues. Maize leaf, a developmentally complex organ, has been divided into at least three stages of active cell division and growth (designated as stages I, II, and III) followed by a fully mature state, with each of the stages having distinct morphological and anatomical features [35]. For instance, the transcriptome of V9 immmature leaves, which belong to stage II characterized by rapid blade and ligule growth [35], was quite distinct from V9 eighth leaf, a fully mature leaf (Figure 1).
While the depth of sequencing for some tissues was somewhat low (Table S1), very high correlations between biological replicates together with clustering of the tissues based on their biology indicates that the sampling depth is sufficient for drawing inferences about the transcriptome.
RNA-Seq and microarrays produce very similar global expression trends
We compared the RNA-Seq expression dataset with the previously published microarray based gene atlas [1] for various aspects of transcriptional analyses. The fact that both data sets were generated from the exact same RNA samples eliminated the variance due to growing conditions, tissue handling, and RNA extraction. For all comparisons, we used the microarray and RNA-Seq expression data generated based on the 4a.53 annota-tion for consistency as this was the version used for the microarray-based gene atlas [1]. Since microarray design covered only 22,151 genes, only these genes were used for calculating Pearson’s correlation coefficients between tissues. Correlation estimates were computed for all 22,151 genes as well as for only a subset of genes that were expressed in both data sets (See Materials and Methods). Gene expression estimates for the eighteen tissues from RNA-Seq and microarray were significantly (P,0.001) correlated with the Pearson’s correlation coefficients ranging between 0.70 and 0.83 (Table 2, Figure S4). The correlation estimates based on all common genes as well as those based only on the expressed genes
were very similar (Table 2). These correlation estimates are similar to those reported earlier [23,36,37]. For further comparison, we evaluated the effectiveness of both techniques in categorizing tissues based on global gene expression using PCA performed independently for RNA-Seq and microarray datasets. Interesting-ly, both technologies produced very similar tissue clusters that reflected biological relatedness and developmental stage of the tissues (Figure 2). For instance, seed and leaf tissues were separated by the first principal component owing to their distinct develop-mental profiles by both RNA-Seq and microarray (Figure 2 A and B). Similarly, whole seed and endosperm tissues were also separated by the second principal component in both analyses, wherein the differences can be attributed to transcriptomes of the embryo and pericarp – two tissues that differentiate these samples. To summarize, these analyses showed that RNA-Seq and microarray transcriptome profiles are highly correlated.
RNA-Seq based gene atlas provides better breadth of coverage of the transcriptome compared to the microarray-derived atlas
To compare the effectiveness of RNA-Seq and microarray technologies in transcriptome analyses, we compared the RNA-Seq data set with microarray-based gene atlas [1]. Of the 32,535 gene models (4a.53), 82.1% were detected in at least one tissue by RNA-Seq following the criterion described above and previously used [27], while only 56.5% were detected by microarray using a cutoff expression value of 200 as described previously [1]. Primarily, this disparity is due to lower coverage of the microarray platform as only 22,153 (68.1%) of the gene models (4a.53, see Materials and Methods) were represented on our custom NimbleGen microarray. Nevertheless, RNA-Seq clearly provided a more comprehensive picture of the transcriptome. RNA-Seq also provided better sampling of the classical maize genes that have been historically identified based on striking mutant phenotype and overrepresented in maize genetics literature [38]; of 464 classical genes, 427 were detected by RNA-Seq compared to 390 by the microarray. Furthermore, expression patterns of these genes followed expected trends. For instance,brown midrib3(bm3), which encodes caffeic acid O-methyltransferase enzyme involved in the lignin biosynthetic pathway [39], was predominantly expressed in developing leaves concomitant with active lignifica-tion (Figure S5). Expression of glossy15, an APETALA2-like gene that controls juvenile to adult vegetative phase change [40], was expressed only in shoot apical meristem at vegetative-3 stage. Interestingly, expression of DMT101, the closest homolog of the Arabidopsis MET1 gene [41], showed a developmental gradient in endosperm that was highest at 14DAP. This is consistent with notion that endosperm is the most likely target tissue for genomic imprinting and that imprinting is associated with DNA hyper-methylation [42]. Finally, expression of purple plant1, which encodes a Myb transcription factor that controls anthocyanin synthesis in leaves and sheaths [43], was expressed specifically in these tissues.
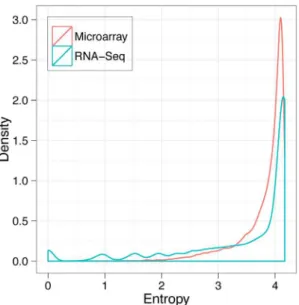
Shannon entropy [44,45] is often used to estimate the tissue-specificity of gene expression across samples. The tissue-tissue-specificity of gene expression was assessed in both platforms, and there were more examples of tissue-specific patterns in RNA-Seq data than in microarray data (Mann-Whitney U test, p,0.01; Figure 3). Thus, RNA-Seq provided enhanced coverage of the transcriptome with more tissue-specific patterns.
Figure 4. Relative efficiencies of RNA-Seq and microarray in discerning expression of two paralogous genes.A. Expression patterns of endosperm-specificBrittle-2 (Bt2) gene B. Expression patterns of leaf specificAgpslzm/L gene. C. Expression patterns of five individual probes representingAgpslzm/Lgene. Sequence differences of each of the 60-mer probes from the paralogousBt2, shown as number of mismatches, are in the inset of each graph.
Resolution of expression of paralogs by RNA-Seq and microarray
We compared the two technologies for discerning expression of paralogs. There were a total of 2,434 paralog pairs for which we had both microarray and RNA-Seq expression data. These pairs include genes from the two sub-genomes of maize resulting from a whole-genome duplication event [46]. The correlation of the expression levels for the two genes was assessed within each platform and was compared to random pairs of genes. Analysis of
RNA-Seq expression data showed that paralogs were highly correlated compared to random pairs of genes (Figure S6). However, there were more examples of highly correlated pairs of paralogs (.2 standard deviations above random gene pairs) within the microarray data (41.2%) than within the RNA-Seq data (31.1%). This higher correlation between paralogs within the microarray data is expected as the microarray was not always specifically assessing expression of individual genes.
As a specific example, we chose two paralogous genes,Brittle-2
(Bt2) [47] andAgpslzm/L2[48] which both encode a small subunit of ADP-glucose pyrophosphorylase (AGP). The two genes share high nucleotide similarity at the mRNA level (84%) and likely arose during tetraploidization of maize genome [49]. However, the two genes are tissue-specific; Bt2 encodes a cytosolic small subunit and is expressed in the endosperm while Agpslzm/L2
encodes a plastidial small subunit and is expressed in leaves [49,50]. Based on microarrays, the expression of endosperm-specific Bt2 was substantially higher in endosperm and whole seeds, but detectable levels of expression were also observed in some of the leaf samples (Figure 4A). Furthermore, expression was also detected in embryo which could actually be contributed by
Agp2, the third gene encoding a plastidial AGP small subunit specific to embryo [51]. Using RNA-Seq, however, expression was strictly limited to the seed tissues. Likewise, microarrays detected substantial expression of the leaf specificAgpslzm/L2in seed tissues while with RNA-Seq, detectable expression was only found in mature leaves which are expected to accumulate starch (Figure 4B). To determine if spurious expression in microarray data is due to cross-hybridization of the probes, we examined the expression of individual probes representing Agpslzm/L2 gene. Indeed, the
Agpslzm/L2 probes with 2–3 mismatches out of 60 nucleotides withBt2produced sizable spurious signal in seed tissues, and only with 5 or more mismatches did theAgpslzm/L2expression became specific to seed (Figure 4C). Therefore, it appears that cross hybridization is an important contributing factor for lower resolution of paralog expression in microarrays. Based on this data, RNA-Seq clearly provides better resolution of expression of genes with similar sequence.
Similarities and differences in RNA-Seq and microarray co-expression networks
The RNA-Seq and microarray transcriptome profiles from 18 samples were used to generate co-expression networks to assess how the profiling platform affected network properties. A set of 19,328 FGS genes that demonstrated detectable expression in the microarray profiles and had mapped reads in at least one RNA-Seq sample were used for this analysis. The two expression profiling platforms have different dynamic ranges, which can complicate comparisons of the data. The microarray data was log2
transformed while the RNA-Seq data was log transformed using an inverse hyperbolic sine function, which allows for greater compression of the larger values that are present in RNA-Seq data. Co-expression networks were generated for the averaged microarray and RNA-Seq data for the 18 tissues.
In general, the two networks contain many examples of similar co-expression relationships and exhibit a relatively high global correlation of R = 0.75 (Figure 5A). However, this correlation between the networks was slightly lower than the correlation between co-expression networks generated from two biological replicate samples of microarray data (R = 0.86) or RNA-Seq data (R = 0.90). The reduced similarity between the RNA-Seq and microarray networks was partially driven by a large set of gene-pairs that exhibit near perfect correlation (R = 1) in the RNA-Seq network but a range of correlations in the microarray network
(indicated by the cluster of points below and to the right of the dotted line in Figure 5A). We investigated a set of 1000 genes connecting a large fraction of these edges and found that they exhibited significantly lower mean RNA-Seq counts than the rest of the genome (Mann-Whitney U test, p,1e-55). Many of these co-expression relationships may be false-positives due to spurious correlations among genes with very low expression levels. Indeed, a more stringent criterion requiring FPKM .5 in at least one tissue removed 841 genes from the analysis and resulted in slightly improved matrix correlations for the microarray and expression data (R = 0.78) (not shown). This observation suggests that caution should be used when computing correlation for genes with very low coverage in RNA-Seq. Microarrays do not typically provide significant co-expression relationships for these genes, likely because the background noise accompanying the low intensity signal prevents measurement of spurious correlations.
We further explored the impact of computing co-expression networks from datasets composed of a mix of RNA-Seq and microarray expression profiles as compared to data from a single platform. A series of 1,000 pairs of co-expression networks were generated by randomly forming two groups of profiles, each composed of a mixture of RNA-Seq and microarray profiles for the 18 samples (Figure 5B). The similarity between each pair of co-expression networks generated from mixed data was compared to the observed similarity between the networks from pure RNA-Seq and microarray datasets. The observed similarity between the single-platform networks falls within the range of values for the mixed networks (Figure 5B), suggesting that robust co-expression networks could be generated from a mixture of RNA-Seq and microarray profiles.
Expression conservation (EC) provides one method for assessing the similarity of co-expression relationships for individual genes in two different networks. An EC score is based on a comparison of a gene’s neighbors in two different networks. Genes with signifi-cantly different EC scores show different patterns of co-expression, i.e. different neighbors, in the two networks. An analysis of EC scores computed for the RNA-Seq and microarray-derived co-expression networks revealed that the majority of genes (82.6%) have similar neighbors in both networks. However, there are 3,354 genes with significant differences, based on the EC score measure (p,0.01). We investigated several features of these genes to understand the factors that might contribute to divergent co-expression relationships between the two platforms. The genes with divergent EC values are enriched for genes with retained duplicates in the two sub-genomes (p,0.05). There was no evidence for significant enrichment for genes in one of the two sub-genomes [52]. A comparison of the mean expression levels for genes with significantly different co-expression relationships revealed several major groups of genes with distinct expression level characteristics (Figure 6). One group of divergent genes is highly expressed in both platforms. However, within the micro-array data, these genes are clustered around the maximum measurable expression value in some tissues and are likely expressed outside the dynamic range of microarrays. Therefore, one possibility is that the co-expression relationships derived from RNA-Seq data capture more information for these genes given the increased dynamic range on that platform. The other group of genes with divergent EC scores has very low expression levels in RNA-Seq data and a range of expression values in microarray data. In fact, most of these genes have a median expression level of zero in the RNA-Seq samples indicating that over half of the
Figure 6. Comparison of expression profiles for individual genes in RNA-Seq and microarray co-expression networks based on expression conservation.The 3,354 genes with significant differences (p,0.01) in expression conservation between RNA-Seq and microarray data were assessed. The mean expression level in microarray samples (x-axis; log2tranformed) and RNA-Seq samples (y-axis; inverse hyperbolic sine transformed) was compared. The color coding indicates connectivity in the two co-expression networks; red indicates the 122 genes with more connections in the microarray network, blue indicates the 796 genes with more connections in the RNA-Seq co-expression network and grey indicates relatively similar connectivity in both networks. The circles indicate two clusters of genes with divergent EC scores.
samples lack expression of the gene. The majority of these genes have significant EC scores due to having higher connectivity (several highly correlated partners) in the RNA-Seq data. Using a stringent criterion requiring FPKM.5 in at least one tissue (see above) removed a number of genes with significant differences (not shown). As discussed previously, this suggests that caution should be used in computing co-expression for genes with low coverage in RNA-Seq.
Availability of the maize transcriptome
To facilitate gene discovery and functional genomics of maize and related grasses, the RNA-Seq-based transcriptome is available to the community at Maize Genetics and Genomics Database (www.maizeGDB.org) MaizeGDB [53], and additional data to that described here will be incorporated as it becomes available. The dataset is linked to the B73 genome browser based on GBrowse2 (www.gmode.org) where viewers can quickly browse the expression (FPKM) of a gene of interest in all the tissues (Figure S7). Expression information is available at both the individual transcript level and the gene model level along with physical location, gene sequence, and a table of expression values. The microarray-based transcriptome [1] is also available in the same display for obtaining comprehensive expression information based on both technologies. A table of FPKM values for the tissues described in this manuscript is also provided (Table S4).
Conclusions
In this study, we performed transcriptional analysis of 18 representative maize tissues capturing important aspects of maize development using RNA-Seq. While we reported on a microarray-based maize gene atlas [1] earlier, this data set provides enhanced coverage of the transcriptome, and provides an opportunity for comparison of RNA-Seq and microarray technologies for tran-scriptional analysis. A coarse comparison showed that both technologies produced a very similar overview of the transcrip-tome. However, RNA-Seq provides enhanced coverage of the genome as microarrays are limited by the gene models represented on the microarray chip. RNA-Seq also provided better resolution of expression differences among paralogs. Co-expression networks are highly valuable tools for identification of novel genes in biological pathways and assigning functional annotation to genes of no known function. We found that co-expression networks developed from RNA-Seq and microarrays are highly compara-ble. The differences in co-expression networks from the two platforms can largely be attributed to differences in the dynamic range or in the precision of estimating exact levels of expression for low-expressed genes.
Supporting Information
Figure S1 Quality of the biological replicates. Pair-wise
Pearson’s correlation (r) was calculated for all three pairs of biological replicates for each tissue.
(TIF)
Figure S2 Distribution of genes based on magnitude of
expression in 18 maize tissues.For each tissue, a gene was considered expressed if the FPKM value and FPKM lower 95% confidence interval was more than 0. For each tissue, the expressed genes were further divided in to low (FPKM .0 to
#5), medium (FPKM .5 to #200), and high (FPKM .200) expression.
(TIF)
Figure S3 Distribution of FPKM values for all genes (A)
and expressed genes (B).Expression values of all 39,429 genes and 29,447 genes were used to make the distribution plots, respectively. Since the major differences in the smaller set is absence of genes with no expression, the two plots look very similar.
(TIF)
Figure S4 Correlations between gene expression
esti-mates for each of the eighteen tissues obtained by RNA-Seq and microarray.In each panel, the average (log2) FPKM
value for each gene is shown onx-axis while average (log2) relative
expression based on microarray is shown ony-axis. See Materials and Methods section for details of correlation analysis.
(TIF)
Figure S5 Expression profiles of selected classical
maize genes derived using RNA-Seq.
(TIF)
Figure S6 Density estimates for the distribution of the
correlation coefficients of paralogous genes in the RNA-seq co-expression network. The correlation co-efficients among tissues were calculated for 2,434 pairs of paralogs (from Schnable et al., 2011, PNAS) that were expressed in multiple tissues. The density plot illustrates the values for these correlation coefficients relative to a set of randomly selected genes.
(TIF)
Figure S7 Sreenshot of the RNA-Seq data display at
Maize Genetics and Genomics Database (www.maizeGDB. org).Data display is based on mapping the RNA-Seq reads to version 2 of the B73 reference genome (http://ftp.maizesequence. org). Data display and download of FPKM values based on transcript and gene level is available. FPKM values were calculated using Cufflinks version 0.9.3 [26] and the 5b annotation (http://ftp.maizesequence.org).
(TIF)
Table S1 Average number of reads, read length, and
other details of sequencing.
(XLSX)
Table S2 Pearson’s correlation coefficients for
biolog-ical replicates.All correlations had P,0.0001. (XLSX)
Table S3 Top 10 expressed genes in each tissue.
(XLSX)
Table S4 FPKM values for all transcript for all the
tissues included in the study based on mapping to v2 of the B73 reference pseudomolecules.
(TXT.ZIP)
Author Contributions
References
1. Sekhon RS, Lin H, Childs KL, Hansey CN, Buell CR, et al. (2011) Genome-wide atlas of transcription during maize development. Plant Journal 66: 553– 563.
2. Schmid M, Davison TS, Henz SR, Pape UJ, Demar M, et al. (2005) A gene expression map ofArabidopsis thalianadevelopment. Nature Genetics 37: 501– 506.
3. Jiao Y, Tausta SL, Gandotra N, Sun N, Liu T, et al. (2009) A transcriptome atlas of rice cell types uncovers cellular, functional and developmental hierarchies. Nature Genetics 41: 258–263.
4. Libault M, Farmer A, Joshi T, Takahashi K, Langley RJ, et al. (2010) An integrated transcriptome atlas of the crop modelGlycine max, and its use in comparative analyses in plants. Plant Journal 63: 86–99.
5. Druka A, Muehlbauer G, Druka I, Caldo R, Baumann U, et al. (2006) An atlas of gene expression from seed to seed through barley development. Functional & Integrative Genomics 6: 202–211.
6. Benedito VA, Torres-Jerez I, Murray JD, Andriankaja A, Allen S, et al. (2008) A gene expression atlas of the model legumeMedicago truncatula. Plant Journal 55: 504–513.
7. Lee J-M, Williams M, Tingey S, Rafalski A (2002) DNA array profiling of gene expression changes during maize embryo development. Functional & Integrative Genomics 2: 13–27.
8. Yu L-X, Setter TL (2003) Comparative transcriptional profiling of placenta and endosperm in developing maize kernels in response to water deficit. Plant Physiology 131: 568–582.
9. Casati P, Walbot V (2003) Gene expression profiling in response to ultraviolet radiation in maize genotypes with varying flavonoid content. Plant Physiology 132: 1739–1754.
10. Casati P, Walbot V (2004) Rapid transcriptome responses of maize (Zea mays) to UV-B in irradiated and shielded tissues. Genome Biology 5: R16.
11. Gardiner JM, Buell CR, Eluma lai R, Galbraith DW, Henderson DA, et al. (2005) Design, production, and utilization of long ougonucleonde microarrays for expression analysis in maize. Bergamo, ITALIE: Maydica.11 p. 12. Kirst M, Caldo R, Casati P, Tanimoto G, Walbot V, et al. (2006) Genetic
diversity contribution to errors in short oligonucleotide microarray analysis. Plant Biotechnology Journal 4: 489–498.
13. Doehlemann G, van der Linde K, Aßmann D, Schwammbach D, Hof A, et al. (2009) Pep1, a secreted effector protein of Ustilago maydis, is required for successful invasion of plant cells. PLoS Pathog 5: e1000290.
14. Zheng J, Fu J, Gou M, Huai J, Liu Y, et al. (2010) Genome-wide transcriptome analysis of two maize inbred lines under drought stress. Plant Molecular Biology 72: 407–421.
15. Schnable PS, Ware D, Fulton RS, Stein JC, Wei F, et al. (2009) The B73 Maize Genome: Complexity, Diversity, and Dynamics. Science 326: 1112–1115. 16. Wang Z, Gerstein M, Snyder M (2009) RNA-Seq: a revolutionary tool for
transcriptomics. Nature Reviews Genetics 10: 57–63.
17. Filichkin SA, Priest HD, Givan SA, Shen R, Bryant DW, et al. (2010) Genome-wide mapping of alternative splicing inArabidopsis thaliana. Genome Research 20: 45–58.
18. Zhang G, Guo G, Hu X, Zhang Y, Li Q, et al. (2010) Deep RNA sequencing at single base-pair resolution reveals high complexity of the rice transcriptome. Genome Research 20: 646–654.
19. Lu T, Lu G, Fan D, Zhu C, Li W, et al. (2010) Function annotation of the rice transcriptome at single-nucleotide resolution by RNA-seq. Genome Research 20: 1238–1249.
20. Severin A, Woody J, Bolon Y-T, Joseph B, Diers B, et al. (2010) RNA-Seq Atlas ofGlycine max: A guide to the soybean transcriptome. BMC Plant Biology 10: 160.
21. Li P, Ponnala L, Gandotra N, Wang L, Si Y, et al. (2010) The developmental dynamics of the maize leaf transcriptome. Nature Genetics 42: 1060–1067. 22. Eveland AL, Satoh-Nagasawa N, Goldshmidt A, Meyer S, Beatty M, et al.
(2010) Digital gene expression signatures for maize development. Plant Physiology 154: 1024–1039.
23. Davidson RM, Hansey CN, Gowda M, Childs KL, Lin H, et al. (2011) Utility of RNA sequencing for analysis of maize reproductive transcriptomes. Plant Genome 4: 191–203.
24. Langmead B, Trapnell C, Pop M, Salzberg S (2009) Ultrafast and memory-efficient alignment of short DNA sequences to the human genome. Genome Biology 10: R25.
25. Trapnell C, Pachter L, Salzberg SL (2009) TopHat: discovering splice junctions with RNA-Seq. Bioinformatics 25: 1105–1111.
26. Trapnell C, Williams BA, Pertea G, Mortazavi A, Kwan G, et al. (2010) Transcript assembly and quantification by RNA-Seq reveals unannotated transcripts and isoform switching during cell differentiation. Nature Biotech-nology 28: 511–515.
27. Hansey CN, Vaillancourt B, Sekhon RS, de Leon N, Kaeppler SM, et al. (2012) Maize (Zea maysL.) genome diversity as revealed by RNA-Sequencing. PLoS ONE 7: e33071.
28. Huttenhower C, Schroeder M, Chikina MD, Troyanskaya OG (2008) The Sleipnir library for computational functional genomics. Bioinformatics 24: 1559– 1561.
29. Huttenhower C, Hibbs M, Myers C, Troyanskaya OG (2006) A scalable method for integration and functional analysis of multiple microarray datasets. Bioinformatics 22: 2890–2897.
30. Dutilh B, Huynen M, Snel B (2006) A global definition of expression context is conserved between orthologs, but does not correlate with sequence conservation. BMC Genomics 7: 10.
31. Salamov AA, Solovyev VV (2000) Ab initio gene finding inDrosophilagenomic DNA. Genome Research 10: 516–522.
32. Paulis JW, Wall JS (1977) Comparison of the protein compositions of selected corns and their wild relatives, teosinte andTripsacum. Journal of Agricultural and Food Chemistry 25: 265–270.
33. Sabelli PA, Larkins BA (2009) The development of endosperm in grasses. Plant Physiology 149: 14–26.
34. Balandı´n M, Royo J, Go´mez E, Muniz L, Molina A, et al. (2005) A protective role for the embryo surrounding region of the maize endosperm, as evidenced by the characterisation of ZmESR-6, a defensin gene specifically expressed in this region. Plant Molecular Biology 58: 269–282.
35. Sylvester AW, Cande WZ, Freeling M (1990) Division and differentiation during normal and liguleless-1 maize leaf development. Development 110: 985–1000. 36. Marioni JC, Mason CE, Mane SM, Stephens M, Gilad Y (2008) RNA-seq: An
assessment of technical reproducibility and comparison with gene expression arrays. Genome Research 18: 1509–1517.
37. Mortazavi A, Williams BA, McCue K, Schaeffer L, Wold B (2008) Mapping and quantifying mammalian transcriptomes by RNA-Seq. Nat Meth 5: 621–628. 38. Schnable JC, Freeling M (2011) Genes identified by visible mutant phenotypes
show increased bias toward one of two subgenomes of maize. PLoS ONE 6: e17855.
39. Vignols F, Rigau J, Torres MA, Capellades M, Puigdomenech P (1995) The
brown midrib3(bm3) mutation in maize occurs in the gene encoding caffeic acid O-methyltransferase. Plant Cell 7: 407–416.
40. Moose SP, Sisco PH (1996) Glossy15, an APETALA2-like gene from maize that regulates leaf epidermal cell identity. Genes and Development 10: 3018–3027. 41. Kankel MW, Ramsey DE, Stokes TL, Flowers SK, Haag JR, et al. (2003)
Arabidopsis MET1 cytosine methyltransferase mutants. Genetics 163: 1109– 1122.
42. Gehring M, Choi Y, Fischer RL (2004) Imprinting and seed development. Plant Cell 16: S203–S213.
43. Cone KC, Cocciolone SM, Burr FA, Burr B (1993) Maize anthocyanin regulatory geneplis a duplicate ofc1that functions in the plant. The Plant Cell Online 5: 1795–1805.
44. Schug J, Schuller W-P, Kappen C, Salbaum JM, Bucan M, et al. (2005) Promoter features related to tissue specificity as measured by Shannon entropy. Genome Biology 6: R33.
45. Zhang X, Clarenz O, Cokus S, Bernatavichute YV, Pellegrini M, et al. (2007) Whole-genome analysis of histone H3 lysine 27 trimethylation inArabidopsis. PLoS Biology 5: e129.
46. Schnable JC, Freeling M, Lyons E (2012) Genome-wide analysis of syntenic gene deletion in the grasses. Genome Biology and Evolution.
47. Bae JM, Giroux MJ, Hannah LC (1990) Cloning and molecular characterization of thebrittle-2gene of maize. Maydica 35: 317–322.
48. Prioul JL, Jeannette E, Reyss A, Gregory N, Giroux M, et al. (1994) Expression of ADP-Glucose pyrophosphorylase in maize (Zea maysL.) grain and source leaf during grain filling. Plant Physiology 104: 179–187.
49. Ro¨sti S, Denyer K (2007) Two paralogous genes encoding small subunits of ADP-glucose pyrophosphorylase in maize, Bt2 and L2, replace the single alternatively spliced gene found in other cereal species. Journal of Molecular Evolution 65: 316–327.
50. Hannah LC, Shaw JR, Giroux MJ, Reyss A, Prioul J-L, et al. (2001) Maize genes encoding the small subunit of ADP-glucose pyrophosphorylase. Plant Physiology 127: 173–183.
51. Giroux MJ, Hannah LC (1994) ADP-glucose pyrophosphorylase inshrunken-2
andbrittle-2mutants of maize. Molecular and General Genetics 243: 400–408. 52. Schnable JC, Springer NM, Freeling M (2011) Differentiation of the maize subgenomes by genome dominance and both ancient and ongoing gene loss. Proceedings of the National Academy of Sciences.