cerana cerana
Zi Long Wang1., Ting Ting Liu1., Zachary Y. Huang2,3
, Xiao Bo Wu1, Wei Yu Yan1, Zhi Jiang Zeng1*
1Honeybee Research Institute, Jiangxi Agricultural University, Nanchang, Jiangxi, China,2Department of Entomology, Michigan State University, East Lansing, Michigan,
United States of America,3Department of Ecology, Evolutionary Biology and Behavior Program, Michigan State University, East Lansing, Michigan, United States of
America
Abstract
Background:The Eastern hive honey bee, Apis cerana ceranais a native and widely bred honey bee species in China. Molecular biology research about this honey bee species is scarce, and genomic information forA. c. ceranais not currently available. Transcriptome and expression profiling data for this species are therefore important resources needed to better understand the biological mechanisms ofA. c. cerana. In this study, we obtained the transcriptome information of A. c. ceranaby RNA-sequencing and compared gene expression differences between queens and workers of A. c. ceranaby digital gene expression (DGE) analysis.
Results:Using high-throughput Illumina RNA sequencing we obtained 51,581,510 clean reads corresponding to 4.64 Gb total nucleotides from a single run. These reads were assembled into 46,999 unigenes with a mean length of 676 bp. Based on a sequence similarity search against the five public databases (NR, Swissport, GO, COG, KEGG) with a cut-off E-value of 1025using BLASTX, a total of 24,630 unigenes were annotated with gene descriptions, gene ontology terms, or metabolic pathways. Using these transcriptome data as references we analyzed the gene expression differences between the queens and workers ofA. c. ceranausing a tag-based digital gene expression method. We obtained 5.96 and 5.66 million clean tags from the queen and worker samples, respectively. A total of 414 genes were differentially expressed between them, with 189 up-regulated and 225 down-regulated in queens.
Conclusions:Our transcriptome data provide a comprehensive sequence resource for futureA. c. ceranastudy, establishing an important public information platform for functional genomic studies inA. c. cerana. Furthermore, the DGE data provide comprehensive gene expression information for the queens and workers, which will facilitate our understanding of the molecular mechanisms of the different physiological aspects of the two castes.
Citation:Wang ZL, Liu TT, Huang ZY, Wu XB, Yan WY, et al. (2012) Transcriptome Analysis of the Asian Honey BeeApis cerana cerana. PLoS ONE 7(10): e47954. doi:10.1371/journal.pone.0047954
Editor:Marc Lenburg, Boston University Medical Center, United States of America ReceivedJuly 17, 2012;AcceptedSeptember 17, 2012;PublishedOctober 24, 2012
Copyright:ß2012 Wang et al. This is an open-access article distributed under the terms of the Creative Commons Attribution License, which permits unrestricted use, distribution, and reproduction in any medium, provided the original author and source are credited.
Funding:This work was supported by the Earmarked Fund for China Agriculture Research System (No. CARS-45-KXJ12), Special Fund for Agro-scientific Research in the Public Interest (No. 200903006), the National Natural Science Foundation of China (No. 31060327) and the Natural Science Foundation of Jiangxi Province (No.20111522040297). The funders had no role in study design, data collection and analysis, decision to publish, or preparation of the manuscript.
Competing Interests:The authors have declared that no competing interests exist. * E-mail: [email protected]
.These authors contributed equally to this work.
Introduction
Apis cerana cerana, the Eastern honey bee, is a honey bee species native to China. It is widely-kept in China, with more than 2 million colonies, and brings substantial economic benefits to beekeepers. Compared with the Western honey bee (Apis mellifera), A. c. ceranahas a stronger resistance to the mite,Varroa destructor[1], and is better at collecting nectar from scattered floral resources [2]. Despite its economic importance, molecular biology research and sequence information for A. c. cerana functional genes are extremely lacking. Currently, there are only 124 mRNA sequences available in the NCBI database forA. c. cerana. This is extremely unfavorable for carrying out gene function research inA. c. cerana. Therefore, obtaining more gene transcription information ofA. c. cerana is important for unraveling transcriptome complexity; for the identification of new transcription units, alternative splicing,
and single nucleotide polymorphisms (SNP); and for performing gene function research in this species.
and workers overexpressed a member of the cytochrome P450 family, hexameric storage proteins, and dihydrodiol dehydroge-nase [6]. Using a cDNA microarray based on more than 6,000A. mellifera ESTs, Barchuk et al. found 240 differentially expressed genes (DEGs) between developing queens and workers [7]. They found that many DEGs are likely to be involved in processes favoring the development of caste-biased structures, such as brain, legs, and ovaries, as well as genes that code for cytoskeleton constituents. Other studies revealed gene expression differences between the two castes in the hypoxia pathway [8], TOR pathway [9,10], insulin signaling pathway [11,12], antioxidant pathway [13], and reproductive status [14–16]. Li et al. compared the expression differences of total proteins, mitochondrial proteins, and nuclear proteins during larvae caste determination of A. melliferausing proteomic approaches [17–19].
Aside from the honey bee, studies for analyzing gene expression differences between queens and workers have also been conducted in other social Hymenoptera insects, including Bumble beeBombus terrestris [20], stingless beeMelipona quadrifasciata [21,22] and ant Lasius niger[23].
Illumina RNA sequencing (RNA-seq) is a recently developed high-throughput sequencing method which uses deep sequencing technology to produce millions of short cDNA reads. By aligning these short reads against a reference genome, or assembling them de novo without the genomic sequence, we can quickly get a genome-scale transcription map containing both the transcrip-tional structure and the level of expression for each gene. This technology was widely used for creatingde novoassembly in many organisms, including some insects (e.g. Bemisia tabaci [24] and Nilaparvata lugens [25]), and plants (e.g. Taxus [26] and Hevea brasiliensis[27]).
Digital gene expression (DGE), an improved version of the serial analysis of gene expression (SAGE) technique, is another recently developed approach for gene expression analysis. It is a tag-based transcriptome sequencing approach in which many 21 bp tag sequences from the 39end of each mRNA molecules are produced by high-throughput sequencing. The expression level of all the genes in a sample is measured by counting the number of tags produced from each gene. Compared with RNA-seq, DGE protocol is more suitable and affordable for comparative gene profiling without compromise or potential bias. DGE and RNA seq technologies have been used in transcriptome profiling studies for various applications, including cellular development, cancer, and immune defense in various organisms [28–30].
In this study, we constructed a cDNA library and obtained 46999 unigenes through Illumina RNA sequencing and sequence assembly. Moreover, we constructed two DGE libraries of the newly emerged queens and workers, and obtained 414 differen-tially expressed genes between them after sequencing and data analysis. All these results provide a shortcut for identifying new functional genes and useful information for studying the molecular biology of the queen-worker differentiation inA. c. cerana.
Results
Illumina sequencing and sequence assembly
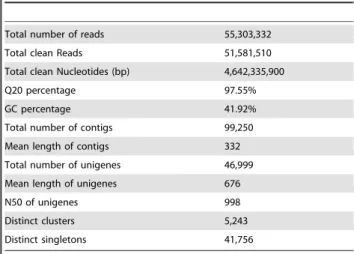
Illumina RNA sequencing generated a total of 55,303,332 raw reads (Table 1). After filtration, 51,581,510 clean reads with accumulated length of 4,642,335,900 bp remained for further analysis, the Q20 percentage (sequencing error rate, 1%) was 97.55%, and the GC percentage was 41.92%. These clean reads were assembled into 99,250 contigs with a mean length of 332 bp. The N50 of contigs was 518 bp. These contigs were further assembled by paired-end joining and gap-filling, and clustered into
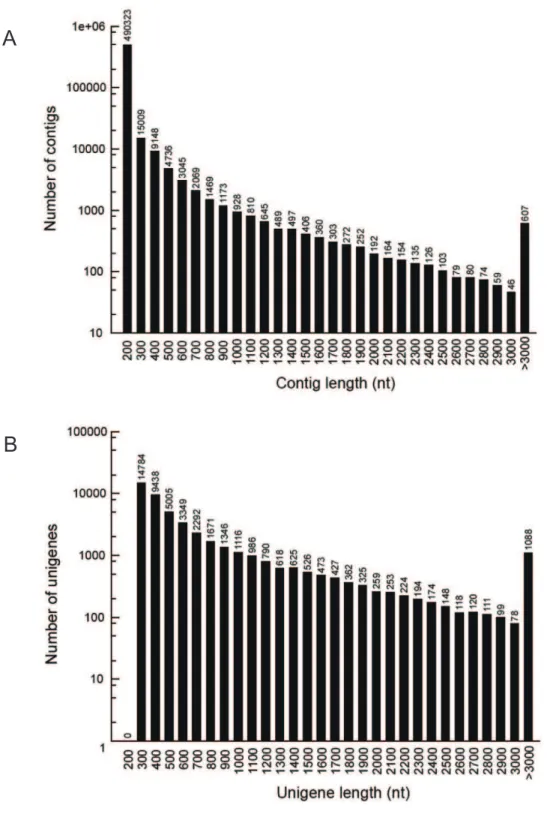
unigenes. Finally, we obtained 46,999 unigenes, including 5,243 clusters and 41,756 singletons, with a mean length of 676 bp. The N50 of unigenes was 998 bp. The size distribution indicated that the lengths of the 9,114 unigenes were more than 1,000 bp (Figure 1).
Functional annotation of unigenes
For annotation, all the distinct unigene sequences were searched against NR, Swissprot, GO, COG, and KEGG databases by BLASTX with a cut-off E-value of 1025 (Table S1). By this method, a total of 24,630 unigenes (52.4% of all unigenes) returned an above cut-off BLAST result (Table 2). Of them, 24,001 unigenes were annotated by NCBI (51.07%), and 18,138 (38.59%), 15607 (33.21%), 7860 (16.72%), and 8064 (17.16%) unigenes by SwissProt, KEGG, COG, and GO respectively.
GO assignments were used to classify the functions of the predicted A. c. cerana unigenes. Based on sequence homology, 8,064 unigenes could be categorized into three main categories with a total of 51 functional groups (Figure 2). In each of the three main categories (biological process, cellular component, and molecular function) of the GO classification, ‘‘cellular process,’’ ‘‘cell,’’ and ‘‘binding’’ terms were dominant. We also noticed a high-percentage of genes in the categories of ‘‘metabolic process,’’ ‘‘cell part,’’ and ‘‘catalytic activity.’’
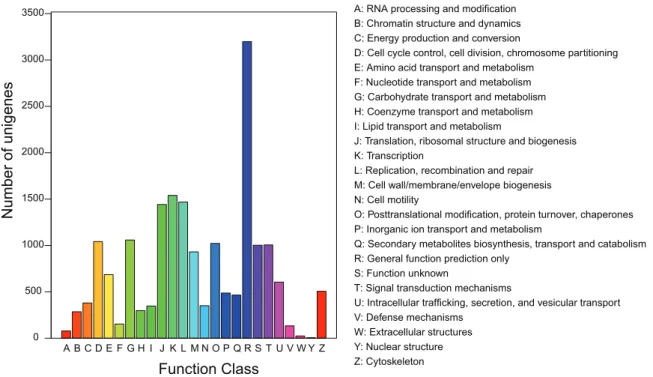
To further evaluate the function of the assembled unigenes, we searched the annotated sequences for the genes involved in Clusters of Orthologous Groups (COG). In total, out of 24,630 annotated unigenes, 7,860 unigenes had a COG classification (Figure 3). These unigenes were distributed in 25 COG categories, among them, the cluster ‘‘general function prediction’’ was the largest group (3,198), followed by ‘‘transcription’’ (1,540), ‘‘repli-cation, recombination, and repair’’ (1,468) and ‘‘translation, ribosomal structure, and biogenesis’’ (1,442). The categories ‘‘nuclear structure (6),’’ ‘‘extracellular structures (24),’’ and ‘‘RNA processing and modification (78)’’ were the smallest groups. TheA. c. ceranaunigenes were further annotated by mapping the 24,630 annotated sequences onto reference canonical pathways in the Kyoto Encyclopedia of Genes and Genomes (KEGG). In total, 15,607 sequences were assigned to 242 KEGG pathways (Table S2). The pathway in which unigenes were most enriched was ‘‘metabolic pathways’’ (1,882), followed by ‘‘regulation of actin cytoskeleton’’ (603), ‘‘pathways in cancer’’ (557), and ‘‘RNA transport’’ (542).
Table 1.Summary forA. c. ceranatranscriptome.
Total number of reads 55,303,332
Total clean Reads 51,581,510
Total clean Nucleotides (bp) 4,642,335,900
Q20 percentage 97.55%
GC percentage 41.92%
Total number of contigs 99,250
Mean length of contigs 332
Total number of unigenes 46,999
Mean length of unigenes 676
N50 of unigenes 998
Distinct clusters 5,243
Distinct singletons 41,756
Digital gene expression (DGE) library sequencing A. c. ceranaqueen and worker DGE libraries were constructed and sequenced to investigate the expression profiles of all the unigenes between them, generating 6.06 and 5.76 million raw tags in each library. After filtering out low quality tags, the total number of clean tags in each library were 5.96 and 5.66 million (Table 3), and the percentage of clean tags relative to raw tags in
each library were 98.44% and 98.38% (Figure 4). Among the clean tags, the number of sequences that could be mapped to reference unigenes were 3.77 and 3.96 million, and the percentage of these clean tags were 63.23% and 69.89% in the queen and worker libraries. In each library, clean tags with copy numbers of more than 100 were more than 84%, but their distribution in distinct clean tags did not exceed 7% (Figure 5). In contrast, the
A
B
Figure 1. Length distributions of thede novoassembly for contigs and unigenes.The length distribution of contigs and unigenes were counted with an interval of every 100 bp from 200 bp to 3000 bp. Each number in the x-axis indicates a region of sequence length covering 100 bp, for example, ‘‘200’’represents a region of sequence length [200, 300).
tags with copy numbers between 2 to 5 showed a broad distribution of distinct clean tags.
Saturation analysis was performed to detect a positive associ-ation between the number of detected genes and the sequencing amount (total tag number). As shown in Figure S1, when the sequencing amount of the two DGE libraries reached near 3 M, the number of detected genes almost ceased to increase.
Mapping tags to the reference transcriptome database
To reveal the molecular events behind DGE profiles, we mapped the tag sequences of the two DGE libraries to our transcriptome reference database generated in the above men-tioned Illumina sequencing. This reference database contained 46,999 distinct sequences with 59,762 unambiguous reference tags. Among the 78,773 and 77,843 distinct clean tags generated from the Illumina sequencing of the two libraries, 33,185 and 33,080 distinct clean tags were mapped to one or multiple unigenes in the reference database (Table 3). Tags mapped to a
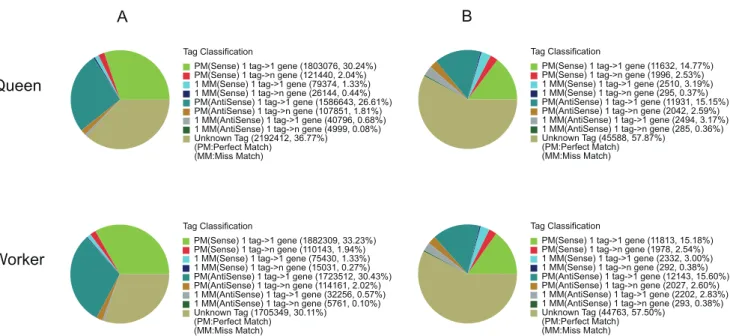
single unique sequence were the most critical subset of the DGE libraries, as they could explicitly identify a transcript. In the queen and worker libraries, 36.26% and 36.60% of distinct clean tags were mapped to unique sequences respectively. Of these, about half mapped to sense strand of the unigenes, and another half mapped to antisense strand of the unigenes (Figure 6). There were 36.77% and 30.11% of the total clean tags corresponding to 57.87% and 57.50% of the distinct clean tags could not be mapped to any unigene. Up to 24.25% (11,399) and 25.04% (11,768) of the unigenes in our transcriptome reference database could be unequivocally identified by unique tag (Table 3).
Differentially expressed genes between queens and workers ofA. c. cerana
To identify genes showing a significant change in expression between the newly emerged queens and workers, differentially expressed tags between these two libraries were identified by an algorithm developed by Audic et al [31]. Between worker and queen libraries, a total of 414 differentially expressed genes were detected, with 189 up-regulated genes and 225 down-regulated genes in queens (Table S3). Of the differentially expressed genes, 214 genes could not be annotated or annotated as ‘‘hypothetical protein’’ or ‘‘uncharacterized protein’’; that is, their functions are unknown.
To understand the functions of these differentially expressed genes, all the differentially expressed genes were mapped to terms in the GO database and compared to the whole transcriptome background. Of the 414 differentially expressed genes, 72 genes have a GO ID and can be categorized into 172 functional groups in three main categories (Table S4). In each of the three main categories (biological process, cellular component, and molecular function) of the GO classification, ‘‘metabolic process,’’ ‘‘cell,’’ and ‘‘catalytic activity’’ terms were dominant. Moreover, two terms were significantly enriched (P-value ,0.05) in the ‘‘biological
Table 2.Annotation of unigenes.
Number of Percentage of
Database annotated unigenes annotated unigenes
Nr 24,001 51.07%
Swissprot 18,138 38.59%
GO 8,064 17.16%
COG 7,860 16.72%
KEGG 15,607 33.21%
Total 24,630 52.41%
doi:10.1371/journal.pone.0047954.t002
Percent of unigenes Number of unigenes
0.1 0
1 80
10 806
100 8064
biological_process cellular_component molecular_function
biological adhesionbiological regulation cell killing
cell proliferation
cellular component organization or biogenesis cellular process
death
developmental process establishment of localization
growth
immune system process localizationlocomotion
metabolic process multi-organism process multicellular organismal process
negative regulation of biological process pigmentation
positive regulation of biological process regulation of biological process
reproduction reproductive processresponse to stimulus
rhythmic process
signaling
viral reproduction
cell
cell junction
cell part
extracellular region extracellular region part
macromolecular complex membrane-enclosed lumen
organelle organelle part
synapse
synapse part
virion
antioxidant activity
binding
catalytic activity channel regulator activityenzyme regulator activitymetallochaperone activity
molecular transducer activity
nucleic acid binding transcription factor activity protein binding transcription factor activity
receptor activity
structural molecule activitytranslation regulator activity transporter activity
Comparison of GO classification
Figure 2. Gene Ontology classification of unigenes.Unigenes were annotated in three main categories: biological process, cellular component, and molecular function. The left y-axis indicates the percentage of a specific category of unigenes in that main category. The right y-axis indicates the number of unigenes in a category.
process’’ category, while no terms were significantly enriched in the ‘‘cellular component’’ and ‘‘molecular function’’ categories. To further investigate the biochemical pathways of these differentially expressed genes, we mapped all of the differentially expressed genes to terms in KEGG database and compared this with the
whole transcriptome background. Of the 414 differentially expressed genes, 157 unigenes had a KO ID and could be categorized into 140 pathways (Table S5). Of those, 16 pathways were significantly enriched (Q-value,0.05), and genes involved in metabolic pathways were the most significantly enriched.
0 500 1000 1500 2000 2500 3000 3500
Function Class
Number of unig
enes
A B C D E F G H I J K L M N O P Q R S T U V W Y Z
A: RNA processing and modification B: Chromatin structure and dynamics C: Energy production and conversion
D: Cell cycle control, cell division, chromosome partitioning E: Amino acid transport and metabolism
F: Nucleotide transport and metabolism G: Carbohydrate transport and metabolism H: Coenzyme transport and metabolism I: Lipid transport and metabolism
J: Translation, ribosomal structure and biogenesis K: Transcription
L: Replication, recombination and repair M: Cell wall/membrane/envelope biogenesis N: Cell motility
O: Posttranslational modification, protein turnover, chaperones P: Inorganic ion transport and metabolism
Q: Secondary metabolites biosynthesis, transport and catabolism R: General function prediction only
S: Function unknown
T: Signal transduction mechanisms
U: Intracellular trafficking, secretion, and vesicular transport V: Defense mechanisms
W: Extracellular structures Y: Nuclear structure Z: Cytoskeleton
Figure 3. COG classification of unigenes.Out of 24,630 annotated unigenes, 7860 sequences had a COG classification among the 25 categories. doi:10.1371/journal.pone.0047954.g003
Table 3.Statistics of DGE sequencing.
Summary Queen Worker
Raw Data Total 6057310 5757006
Raw Data Distinct Tag 168534 166482
Clean Tag Total number 5962735 5663952
Clean Tag Distinct Tag number 78773 77843
All Tag Mapping to unigene Total number 3770323 3958603
All Tag Mapping to unigene Total % of clean tag 63.23% 69.89%
All Tag Mapping to unigene Distinct Tag number 33185 33080
All Tag Mapping to unigene Distinct Tag % of clean tag 42.13% 42.50%
Unambiguous Tag Mapping to unigene Total number 3509889 3713507
Unambiguous Tag Mapping to unigene Total % of clean tag 58.86% 65.56%
Unambiguous Tag Mapping to unigene Distinct Tag number 28567 28490
Unambiguous Tag Mapping to unigene Distinct Tag % of clean tag 36.26% 36.60%
All Tag-mapped unigenes number 15214 15657
All Tag-mapped unigenes % of ref unigenes 32.37% 33.31%
Unambiguous Tag-mapped unigenes number 11399 11768
Unambiguous Tag-mapped unigenes % of ref unigenes 24.25% 25.04%
Unknown Tag Total number 2192412 1705349
Unknown Tag Total % of clean tag 36.77% 30.11%
Unknown Tag Distinct Tag number 45588 44763
Unknown Tag Distinct Tag % of clean tag 57.87% 57.50%
In these differentially expressed genes, many were already reported to be differentially expressed between queens and workers. Vitellogenin (CL5161.Contig1), a critical protein in-volved in reproduction and caste differentiation [32,33], and two hexamerin: hexamerin 110 (CL1143.Contig1) and hexamerin 70a (CL1653.Contig1), important factors reported to be involved in queen-worker caste differentiation of social insects [34–37], were
all up-regulated in the queens. Other genes reported to be related to caste differentiation of the honey bee were also found in our study, including ribosomal proteins, cytochrome P450s, cuticle proteins, and odorant binding proteins [7]. We found six ribosomal protein genes (Unigene35563, Unigene2422, Uni-gene14816, Unigene7158, Unigene34160, and CL3917.Contig1) that were up-regulated in workers in comparison to the queens.
Tag Copy Number [2, 5] (41254, 52.37%) [6, 10] (11807, 14.99%) [11, 20] (8898, 11.30%) [21, 50] (7966, 10.11%) [51, 100] (3952, 5.02%) > 100 (4896, 6.22%) Tag Copy Number
[2, 5] (119007, 2.00%) [6, 10] (90044, 1.51%) [11, 20] (131143, 2.20%) [21, 50] (256327, 4.30%) [51, 100] (279074, 4.68%) > 100 (5087140, 85.32%)
Queen
Tag Copy Number [2, 5] (40760, 52.36%) [6, 10] (11714, 15.05%) [11, 20] (8818, 11.33%) [21, 50] (8059, 10.35%) [51, 100] (3959, 5.09%) > 100 (4533, 5.82%) Tag Copy Number
[2, 5] (117683, 2.08%) [6, 10] (89417, 1.58%) [11, 20] (129792, 2.29%) [21, 50] (259154, 4.58%) [51, 100] (280990, 4.96%) > 100 (4786916, 84.52%)
Worker
A
B
Figure 5. Distribution of total clean tags (A) and distinct clean tags (B) over different tag abundance categories in each sample. Numbers in the square brackets indicate the range of copy numbers for a specific category of tags. For example, [2,5] means all the tags in this category has 2 to 5 copies. Numbers in the parentheses of (A) and (B) respectively show the total copy number of the clean tags and the total types of clean tags in that category.
doi:10.1371/journal.pone.0047954.g005
Tag Classification
Tags Containing N (2775, 1.65%) Only adaptors (108, 0.06%) Copy Number < 2 (86878, 51.55%) Clean tags (78773, 46.74%) Tag Classification
Tags Containing N (7545, 0.12%) Only adaptors (152, 0.00%) Copy Number < 2 (86878, 1.43%) Clean tags (5962735, 98.44%)
Tag Classification
Tags Containing N (6851, 0.12%) Only adaptors (60, 0.00%) Copy Number < 2 (86143, 1.50%) Clean tags (5663952, 98.38%)
Tag Classification
Tags Containing N (2446, 1.47%) Only adaptors (50, 0.03%) Copy Number < 2 (86143, 51.74%) Clean tags (77843, 46.76%)
Queen
Worker
A
B
Figure 4. Distribution of total tags (A) and distinct tags (B) over different tag abundance categories in each sample.The numbers and percentage of tags containing N, empty tags with adaptor only, tags with copy number,2 and clean tags, are shown.
Three cytochrome P450 genes (CL4487.Contig1, Unigene40252 and Unigene35287) were all up-regulated in queens. Five cuticle protein genes (Unigene16699, CL816.Contig1, CL782.Contig1, Unigene6752, Unigene15851) showed expression difference be-tween queens and workers, with four (CL816.Contig1, CL782.Contig1, Unigene6752, Unigene15851) up-regulated in workers and one (Unigene16699) up-regulated in queens. We found two odorant binding proteins (Unigene15202, Uni-gene16694) both up-regulated in queens, and one pheromone-binding protein (Unigene15791) up-regulated in workers. Besides these, genes belonging to oxidoreductases, mitochondrial genes, and transporters also showed expression differences between queens and workers.
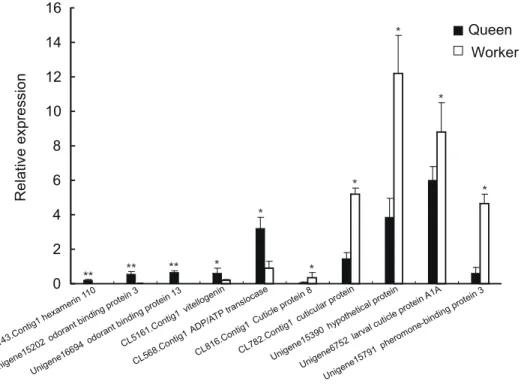
To verify the DGE data, we chose ten differentially expressed unigenes to detect their expression between adult queens and workers using quantitative RT-PCR (Table S6). Total RNAs from queens and workers were used as templates, and theA. c. ceranab -actingene was chosen as the control. The result showed that the real time PCR results of all these unigenes were consistent with the DGE data (Figure 7).
Discussion
Until recently, sequence data of A. c. cerana was scarce, so obtaining more sequence information was a priority for research-ers in order to perform gene function research inA. c. cerana. In this study, we sequenced and annotated a reference transcriptome for theA. c. ceranausing next-generation sequencing technologies, and obtained 4.64 Gb of transcriptome data and a total of 11.62 M of gene expression tags. As far as we know, this is the first study for obtaining whole transcriptome information using the RNA-seq approach in A. c. cerana. Our results provide the most extensive sequencing resource published forA. c. cerana.
In this study, we performedde novo assembly of transcriptome using short raw reads, due to a lack of A. c. cerana genome sequences. The mean length of the unigenes obtained in our study is 676 bp, which is significantly higher than in other studies using
transcriptome sequencing and assembly [24,25,27]. Moreover, to further evaluate the sequencing and assembly quality, we downloaded 26 already reported A. c. cerana mRNA sequences containing the complete coding region from the Genbank, and searched for them in the A. c. cerana unigenes database using BLASTN with a cut-off E-value of 1e-30. The results showed a mean identity of 98.0% and query coverage of 82.06%, suggesting high quality of sequencing and assembly.
In the genus Apis, A. cerana and A. mellifera have the closest evolutionary relationship [38], so genetic divergence between them should be slight, and they should share most of their functional genes. The whole genome sequence of A. mellifera is available and all of the function genes are predicted, which allows us to compare the A. c. cerana unigenes in this study with the predicted genes ofA. mellifera. We aligned all of the unigenes with all the A. mellifera genes (including alternative splicing variants), downloaded from NCBI (ftp://ftp.ncbi.nih.gov/genomes/ Apis_mellifera/RNA/rna.fa.gz), using BLASTN with an E-value of 1e-30, and found that 10,104 genes (86.09%) of all the predicted A. mellifera 11,736 genes can be matched to the A. c. cerana unigenes. These results indirectly suggest that our transcriptome sequences have a good coverage for all theA. c. ceranagenes. We further analyzed the differences of genes related to important physiological characteristics between these two species, and found that the number of odorant receptor genes inA. c. ceranais far less than the number reported inA. mellifera [39]. There are just 18 unigenes annotated as ‘‘odorant receptor’’, compared to 170 inA. mellifera[39]. One possible reason is that these odorant receptor genes are specifically expressed in the antennae of honey bees [39]. Because RNAs from the antennae just occupy a very small proportion of the total RNA, their abundance might be much lower compared to those from other tissues. However, this explanation requires experimental verification.
Through DGE analysis, we obtained a total of 414 differentially expressed genes between queens and workers ofA. c. cerana. Many of them were reported to be caste-specifically-expressed in
Tag Classification
PM(Sense) 1 tag->1 gene (11632, 14.77%) PM(Sense) 1 tag->n gene (1996, 2.53%) 1 MM(Sense) 1 tag->1 gene (2510, 3.19%) 1 MM(Sense) 1 tag->n gene (295, 0.37%) PM(AntiSense) 1 tag->1 gene (11931, 15.15%) PM(AntiSense) 1 tag->n gene (2042, 2.59%) 1 MM(AntiSense) 1 tag->1 gene (2494, 3.17%) 1 MM(AntiSense) 1 tag->n gene (285, 0.36%) Unknown Tag (45588, 57.87%)
(PM:Perfect Match) (MM:Miss Match) Tag Classification
PM(Sense) 1 tag->1 gene (1803076, 30.24%) PM(Sense) 1 tag->n gene (121440, 2.04%) 1 MM(Sense) 1 tag->1 gene (79374, 1.33%) 1 MM(Sense) 1 tag->n gene (26144, 0.44%) PM(AntiSense) 1 tag->1 gene (1586643, 26.61%) PM(AntiSense) 1 tag->n gene (107851, 1.81%) 1 MM(AntiSense) 1 tag->1 gene (40796, 0.68%) 1 MM(AntiSense) 1 tag->n gene (4999, 0.08%) Unknown Tag (2192412, 36.77%)
(PM:Perfect Match) (MM:Miss Match)
Tag Classification
PM(Sense) 1 tag->1 gene (11813, 15.18%) PM(Sense) 1 tag->n gene (1978, 2.54%) 1 MM(Sense) 1 tag->1 gene (2332, 3.00%) 1 MM(Sense) 1 tag->n gene (292, 0.38%) PM(AntiSense) 1 tag->1 gene (12143, 15.60%) PM(AntiSense) 1 tag->n gene (2027, 2.60%) 1 MM(AntiSense) 1 tag->1 gene (2202, 2.83%) 1 MM(AntiSense) 1 tag->n gene (293, 0.38%) Unknown Tag (44763, 57.50%)
(PM:Perfect Match) (MM:Miss Match) Tag Classification
PM(Sense) 1 tag->1 gene (1882309, 33.23%) PM(Sense) 1 tag->n gene (110143, 1.94%) 1 MM(Sense) 1 tag->1 gene (75430, 1.33%) 1 MM(Sense) 1 tag->n gene (15031, 0.27%) PM(AntiSense) 1 tag->1 gene (1723512, 30.43%) PM(AntiSense) 1 tag->n gene (114161, 2.02%) 1 MM(AntiSense) 1 tag->1 gene (32256, 0.57%) 1 MM(AntiSense) 1 tag->n gene (5761, 0.10%) Unknown Tag (1705349, 30.11%)
(PM:Perfect Match) (MM:Miss Match)
Queen
Worker
A
B
Figure 6. Distribution of total clean tags (A) and distinct clean tags (B) on unigenes.PM(Sense): perfect match to gene (sense); 1 tag-.1 gene: one tag match to one gene; 1 tag-.n gene: one tag match to more than one gene; 1 MM(Sense): match to gene (sense) with 1 bp mismatch; PM(AntiSense): perfect match to anti-sense gene; 1 MM(Anti-Sense): match to anti-sense gene with 1 bp mismatch; Unknown Tag: not match to gene (sense and anti-Sense).
previous research, such as vitellogenin [32,33] and hexamerins [34–37], which are key factors involved in the caste differentiation. Vitellogenin is reported to have antioxidant functions and thereby can prolong lifespan of the reproductive queen castes [33], while acting as a hormone to affect the future foraging behavior of workers [32]. Hexamerins, on the other hand, have been shown to regulate the soldier-caste differentiation in the termiteReticulitermes flavipes[36,37]. These results not only suggest that the results of our DGE analysis are reliable, but also indicate that DGE is an efficient method to identify caste related genes in the honey bee.
To detect whether these differentially expressed genes between queens and workers are conserved among species, we compared all the differentially expressed genes detected in our study to those reported in other Hymenoptera insects, including bumblebee Bombus terrestris[20], stingless beeMelipona quadrifasciata[21,22], the antLasius niger[23] andA. mellifera[5–7]. We found that just a few differentially expressed genes detected in the first three species overlapped with our results: a hexamerin gene, a cuticle protein gene, and a 60S ribosomal protein gene in Bombus terrestris, a cytochrome P450 gene inMelipona quadrifasciataand a vitellogenin gene in Lasius niger. The lack of overlap may be due to the relatively small number of differentially expressed genes detected in the other three species, due to the limitation of experimental methods adopted in these studies. When we compared the differentially expressed genes in our study to those inA. mellifera reported by three different research groups [5–7], 73 of the 414 DGE detected in our study overlapped between these two species, including viotellogenin, hexamerins, crystallin, cytochrome P450 genes, ribosomal protein genes, and cuticle protein genes. There might be more DGEs overlap between the A. c. cerana and A. mellifera, but were missed because theA. melliferastudies used whole body larvae or adults heads, while our study used whole body adults. All these results suggest that the pathway of caste
differentiation of these social insects maybe have some degree of conservation among species.
Secreting royal jelly is an important feature of workers, and one of the most important differences between workers and queens. In this study, 7 ribosomal protein genes, which code for the main component of the ribosome and play important roles in protein synthesis, were up-regulated in workers. This may be due to the fact that the workers need to synthesize royal jelly, which is mainly composed of royal jelly proteins, while the queen does not. Although the sampled workers were newly emerged adult workers, at this stage the workers may have already begun to up-regulate the expression of these ribosomal protein genes to promote royal jelly protein synthesis.
Besides the reported genes related to the caste-specific differentiation of queens and workers in A. mellifera or other Hymenopteran insects, we also found many other genes showing expression differences between queens and workers. For example, four ‘‘venom’’ related genes (CL3467.Contig1, CL415.Contig1, Unigene6964, and Unigene7666) were up-regulated in queens. Interestingly, we found that two circadian rhythm genes, period (CL4008.Contig1) and takeout (Unigene15755) were both up-regulated in workers. Workers may have a stronger circadian rhythm than the queens because the queens usually lay eggs around the clock [40], while workers eventually venture outside to forage during the day time and rest at night.
In addition to those functionally annotated genes, there were also 214 differentially expressed genes with unknown functions, which may be involved in the queen-worker caste determination or caste-specific differentiation of many physiological characteris-tics. Although their functions remained unknown, some of them may be critical in differentiating between the queens and the workers.
In summary, we obtained whole transcriptome sequences of the A. c. ceranaby high-throughput sequencing, and analyzed the gene 0
2 4 6 8 10 12 14 16
Queen Worker
Relative expression
** **
*
*
**
*
*
* *
*
CL114 3.Co
ntig1 hex amerin
110
Unigen e152
02 o doran
t bind ing pr
otein 3
Unigene 16694
odoran t bind
ing prot ein 13
CL51 61.C
ontig1 vitell
ogen in
CL56 8.Conti
g1 AD P/ATP
trans locas
e
CL81 6.Co
ntig1 Cuticle
protein 8
CL78 2.Conti
g1 cu ticular
protei n
Unigen e153
90 hy pothe
tical prot ein
Unigene 6752
larval cutic
le protei n A1A
Unigene 15791
pherom one-bind
ing prot ein 3
Figure 7. Verification of ten differentially expressed unigenes between queen and worker by quantitative RT-PCR.All ten unigenes showed significant difference (*p,0.05, **p,0.01) between queens and workers byt-test.
expression differences between queens and workers. These results will provide a solid foundation for research on the molecular mechanisms of the biological traits ofA. c. cerana.
Conclusions
Through next generation high throughput sequencing we obtained 46,999 unique sequences. Based on a similarity search with known proteins, a total of 24,630 unigenes were identified to have BLAST hits with a cut-off E-value above 1025. Using these assembled sequences as a reference, we compared the gene expression differences between the adult queens and workers ofA. c. cerana. A total of 414 genes showed differential expression between them. From these genes, we found many genes related to the physiological differences between the queens and workers. Our results will provide invaluable clues for researching the physiolog-ical differences between queens and workers.
Materials and Methods
Insect
A. c. ceranawere sampled from Honey bee Research Institute, Jiangxi Agricultural University, China. For transcriptome analysis three day old worker larvae; one day old worker pupae; and one day old adult workers, foragers, and nurses were sampled with five individuals per group. Total RNAs from these samples were isolated and pooled as one sample for transcriptome sequencing to obtain more sequence information of all the transcribed genes inA. c. cerana. For DGE analysis, five newly emerged workers and queens were sampled as two samples for RNA isolation and sequencing. The reason for choosing newly emerged adult stage in our DGE analysis is that this stage represents the endpoint of postembryonic development and the starting point for caste-specific task perfor-mance [3], and it is an important stage for exploring the molecular mechanism of many caste-specific traits of honeybee.
cDNA library preparation and Illumina sequencing for transcriptome analysis
To construct a cDNA library, total RNA was extracted from the above mentioned fiveA. c. ceranasamples using the SV total RNA isolation system (Promega, USA) according to the manufacturer’s protocol. Then, these five RNA samples were pooled (with equal amount of RNA from each stage) as one sample for transcriptome sequencing to obtain as much gene expression information as possible. Poly(A)+RNA was isolated from 20mg of pooled total RNA using oligo(dT) magnetic beads according to Illumina manufactur-er’s instructions. Then, the purified mRNA was fragmented into short sequences in the fragmentation buffer at 94uC for 5 min. These cleaved, short RNA sequences were used as templates for first strand cDNA synthesis primed with random hexamers. The second-strand cDNA was synthesized using buffer, dNTPs, RNase H, and DNA polymerase I. Short fragments were purified with a QiaQuick PCR extraction kit (Qiagen, Germany) and resolved with EB buffer for end repair and poly(A) addition. Then, sequencing adaptors were added to the fragments, and suitable fragments were used as templates for PCR amplification after agarose gel electrophoresis, PCR products were purified using the QiaQuick PCR extraction kit (Qiagen, Germany) to create a cDNA library. Finally, the library (200 bp insert) was sequenced from both 59 and 39 ends using Illumina HiSeq TM 2000 (Illumina Inc., SanDiego, CA, USA). Sequencing-received raw image data was transformed by base calling into sequence data, which is called raw data or raw reads, and was stored in fastq format.
Analysis of Illumina sequencing results
Before performing bioinformatical analysis, the raw sequences were filtered to remove low quality reads. The filtration steps were as follows: 1, remove reads just containing adaptor sequence; 2, remove reads containing unknown nucleotide ‘‘N’’ over 5%; and 3, remove low quality reads (those with a ratio of bases with a quality value lower than 10 occupying more than 20% of the whole read). The remaining clean reads were used for further analysis and were deposited in the NCBI sequence read archive (SRX175819).
Transcriptomede novoassembly was carried out with a short reads assembling program–Trinity [41]. The Trinity software first combined reads with a certain length of overlap to form longer fragments without N, forming contigs. Then the reads were mapped back to contigs, with paired-end reads it was able to detect contigs from the same transcript as well as the distances between these contigs. Then, Trinity connected these contigs to get consensus sequences that contained the least Ns and could not be extended on either end. Such sequences were defined as unigenes.
Finally, the obtained unigenes were searched against the protein databases NR, Swiss-Prot, KEGG, and COG using BLASTX with E-value,1025 to decide their direction. The best matched hits were used to decide the sequence direction of each unigene. If the search results of different databases conflicted with each other, a priority order of NR, Swiss-Prot, KEGG, and COG was followed. If a unigene could not be aligned to any of the above four databases, the software ESTScan [42] was introduced to decide its sequence direction.
After assembly, all the unigenes were firstly aligned by BLASTX to protein databases NR, Swiss-Prot, KEGG and COG (E-value
,1025), retrieving proteins with the highest sequence similarity with the given unigenes along with their protein functional annotations. Based on NR annotation, we used the Blast2GO program [43] to get the GO annotations of unigenes. After getting GO annotation for each unigene, we used WEGO software [44] to do GO functional classification for all unigenes and to understand the distribution of gene functions of the species from the macro level.
Digital gene expression library preparation and sequencing
sequencing. Each tunnel of chip (flowcell) generated millions of raw tags with a length of 49 bp.
Analysis and mapping of DGE tags to transcriptome sequences
Sequencing-received raw image data was transformed by base calling into sequence data and stored in fastq format. Raw sequences were filtered by the following steps: 1, remove adaptor sequence (since tags are only 21 nt long while the sequencing reads are 49 nt long, raw sequences are with 39 adaptor sequences); 2, remove empty tags (no tag sequence between the adaptors); 3, remove low quality tags (tags with unknown nucleotide ‘‘N’’); 4, remove tags with only one copy number (which might result from sequencing errors); 5, remove of tags which are too long or too short. After filtration, the remained clean tags contain CATG and 21 bp tag sequences, and were deposited in the NCBI sequence read archive (SRX175818 for queens and SRX180263 for workers).
Before mapping, a tag library containing all the possible CATG+17 nt tag sequences was created using the assembledA. c. ceranatranscriptome sequence data. Then, all the clean tags were mapped to this transcriptome reference database with only one nucleotide mismatch allowed. Clean tags that mapped to multiple genes were filtered. The remaining clean tags were designated as unambiguous clean tags. For gene expression analysis, the number of unambiguous clean tags for each gene was calculated and normalized to TPM (number of transcripts per million clean tags).
Evaluation of DGE libraries
To identify the differentially expressed genes between queen and worker libraries, a rigorous statistical algorithm was developed by consulting the method described by Audic [31] to statistically analyze the tag frequency in each DGE library. The false discovery rate (FDR) was used to determine the threshold P-value in multiple tests. A FDR,0.001 and an absolute E-value of the log2 ratio.1 were used as the threshold to determine significant differences in gene expression. The identified differentially expressed genes were used for GO and KO enrichment analysis. GO enrichment analysis of functional significance applies a hypergeometric test to map all differentially expressed genes to terms in GO database, looking for significantly enriched GO terms in differentially expressed genes comparing to the genome background. The calculating formula is:
P~1{X
m{1
i~0
M
i
N
{M
n{i
N
n
WhereNis the number of all genes with GO annotation;nis the number of differentially expressed genes inN;Mis the number of all genes that are annotated to the certain GO terms; mis the number of differentially expressed genes inM.
KEGG pathway enrichment analysis identifies significantly enriched metabolic pathways or signal transduction pathways in differentially expressed genes comparing with the whole genome background. The calculating formula is the same as that of GO analysis.
Quantitative RT-PCR validation
Total RNA was extracted from one day old queens and workers as described for the DGE library preparation. RNA integrity was determined by agarose gel (1%), electrophoresis, and ethidium bromide staining. The purity (260 nm/280 nm ratio between 1.8
and 2.0 for RNA) and concentration of each RNA sample was measured in triplicate using a UV spectrophotometer (Gene-Quant, Pharmacia). The RNA sample was standardized to 1mg/ ml for reverse transcription. cDNA was synthesized using MLV
reverse transcriptase (Takara, Japan) according to the manufac-turer’s instructions, and b-actin was used as an internal control [45]. qPCR primers were designed based on the nucleotide sequence of the chosen unigenes using Primer 5.0 software. Primer sequences and unigenes are summarized in Additional File 7.
The cycling conditions were as follows: preliminary 94uC for 2 min, 40 cycles including 94uC for 15 sec, 63uC for 30 sec, and 72uC for 30 sec. The specificity of the PCR products was verified by melting curve analysis for each sample. For each unigene, five biological replicates (with three technical replicate for each biological replicate) were performed. The control and target unigene for each sample were run in the same plate to eliminate interplate variation. The Ct value for each biological replicate was obtained by calculating the arithmetic mean of three technical replicate values. The relative expression level between queens and workers was calculated using the formula reported by Liu and Saint’s [46]. The differential expression was analyzed by analysis of variance (ANOVA) using StatView 5.01 (SAS Institute, Gary, NC, USA).
Supporting Information
Figure S1 Saturation analysis of clean tags. With the increase of total sequence number, the number of detected genes gradually ceased to increase.
(EPS)
Table S1 Annotation of all the unigenes. 24,630 of the 46999 unigenes were annotated using BLASTX search in the five public databases (NR, Swissport, GO, COG, KEGG) with a cut-off E-value of 1025.
(RAR)
Table S2 KEGG analysis of the 15607 unigenes. (XLS)
Table S3 The differentially expressed genes between queens and workers. TPM: transcript copies per million tags. Raw intensity: the total number of tags sequenced for each gene. FDR: false discovery rate. We used FDR#0.001 and the absolute value of log2Ratio $1 as the threshold to judge the significance of gene expression difference. In order to calculate the log2Ratio and FDR, we used TPM value of 0.01 instead of 0 for genes that do not express in one sample.
(XLS)
Table S4 Gene Ontology enrichment analysis of the differen-tially expressed genes. The results were summarized in three main categories: biological process, cellular component and molecular function.
(XLS)
Table S5 KEGG pathway enrichment analysis of the differen-tially expressed genes.
(XLS)
Table S6 Primers used for quantitative RT-PCR analysis. (DOC)
Acknowledgments
Author Contributions
Conceived and designed the experiments: ZJZ. Performed the experi-ments: TTL. Analyzed the data: ZLW. Contributed reagents/materials/ analysis tools: WYY XBW. Wrote the paper: ZLW ZYH.
References
1. Peng YS, Fang ZY, Xu SY, Ge LS (1987) The resistance mechanism of the
Asian honey bee,Apis cerana ceranaFabr., to ectoparasitic mite,Varroa jacbsoni
Oudemans. J Inver Patho 47:54–60.
2. Cheng SL (2001) Special management ofApis cerana cerana. In: Liu BH, editor.
The Apicultural Science in China. Beijing: Chinese Agricultural Press. 488–512. 3. Page RE Jr, Peng CY (2001) Aging and development in social insects with
emphasis on the honey bee,Apis mellifera L. Experimental Gerontology 36(4–
6):695–711.
4. Severson DW, Williamson JL, Aiken JM (1989) Caste-specific transcription in the female honey bee. Insect Biochem 19(2):215–220.
5. Evans JD, Wheeler DE (1999) Differential gene expression between developing
queens and workers in the honey bee,Apis mellifera. Proc Natl Acad Sci U S A
96(10):5575–5580.
6. Evans JD, Wheeler DE (2001) Expression profiles during honeybee caste determination. Genome Biol 2(1):RESEARCH0001.
7. Barchuk AR, Cristino AS, Kucharski R, Costa LF, Simo˜es ZL, et al. (2007) Molecular determinants of caste differentiation in the highly eusocial honeybee Apis mellifera. BMC Dev Biol 7:70.
8. Azevedo SV, Caranton OA, de Oliveira TL, Hartfelder K (2011) Differential expression of hypoxia pathway genes in honey bee (Apis mellifera L.) caste development. J Insect Physiol 57(1):38–45.
9. Patel A, Fondrk MK, Kaftanoglu O, Emore C, Hunt G, et al. (2007) The making of a queen: TOR pathway is a key player in diphenic caste development. PLoS One 2(6):e509.
10. Mutti NS, Dolezal AG, Wolschin F, Mutti JS, Gill KS, et al. (2011) IRS and TOR nutrient-signaling pathways act via juvenile hormone to influence honey bee caste fate. J Exp Biol 214(Pt 23):3977–3984.
11. Wheeler DE, Buck N, Evans JD (2006) Expression of insulin pathway genes
during the period of caste determination in the honey bee,Apis mellifera. Insect
Mol Biol 15(5):597–602.
12. de Azevedo SV, Hartfelder K (2008) The insulin signaling pathway in honey bee (Apis mellifera) caste development – differential expression of insulin-like peptides and insulin receptors in queen and worker larvae. J Insect Physiol 54(6):1064– 1071.
13. Corona M, Hughes KA, Weaver DB, Robinson GE (2005) Gene expression patterns associated with queen honey bee longevity. Mech Ageing Dev 126(11):1230–1238.
14. Grozinger CM, Fan Y, Hoover SE, Winston ML (2007) Genome-wide analysis reveals differences in brain gene expression patterns associated with caste and reproductive status in honey bees (Apis mellifera). Mol Ecol 16(22):4837–4848. 15. Humann FC, Hartfelder K (2011) Representational Difference Analysis (RDA)
reveals differential expression of conserved as well as novel genes during caste-specific development of the honey bee (Apis mellifera L.) ovary. Insect Biochem Mol Biol 41(8):602–612.
16. Thompson GJ, Yockey H, Lim J, Oldroyd BP (2007) Experimental manipulation of ovary activation and gene expression in honey bee (Apis mellifera) queens and workers: testing hypotheses of reproductive regulation. J Exp Zool A Ecol Genet Physiol 307(10):600–610.
17. Li J, Wu J, Begna Rundassa D, Song F, et al. (2010) Differential protein expression in honeybee (Apis mellifera L.) larvae: underlying caste differentiation. PLoS One 5(10):e13455.
18. Begna D, Fang Y, Feng M, Li J (2011) Mitochondrial proteins differential expression during honeybee (Apis mellifera L.) queen and worker larvae caste determination. J Proteome Res 10(9):4263–4280.
19. Begna D, Han B, Feng M, Fang Y, Li J (2012) Differential Expressions of Nuclear Proteomes between Honeybee (Apis mellifera L.) Queen and Worker Larvae: A Deep Insight into Caste Pathway Decisions. J Proteome Res 11(2):1317–1329.
20. Pereboom JJ, Jordan WC, Sumner S, Hammond RL, Bourke AF (2005) Differential gene expression in queen-worker caste determination in bumble-bees. Proc Biol Sci 272(1568):1145–1152.
21. Judice C, Hartfelder K, Pereira GAG (2004) Caste-specific gene expression in
the stingless beeMelipona quadrifasciata– Are there common patterns in highly
eusocial bees? Insect Soc 51(4):352–358.
22. Judice CC, Carazzole MF, Festa F, Sogayar MC, Hartfelder K, et al. (2006) Gene expression profiles underlying alternative caste phenotypes in a highly
eusocial bee,Melipona quadrifasciata. Insect Mol Biol 15(1):33–44.
23. Gra¨ff J, Jemielity S, Parker JD, Parker KM, Keller L (2007) Differential gene
expression between adult queens and workers in the antLasius niger. Mol Ecol
16(3):675–683.
24. Wang XW, Luan JB, Li JM, Bao YY, Zhang CX, et al. (2010) De novo characterization of a whitefly transcriptome and analysis of its gene expression during development. BMC Genomics 11:400.
25. Xue J, Bao YY, Li BL, Cheng YB, Peng ZY, et al. (2010) Transcriptome analysis
of the brown planthopperNilaparvata lugens. PLoS One 5(12):e14233.
26. Hao DC, Ge G, Xiao P, Zhang Y, Yang L (2011) The first insight into the tissue specific taxus transcriptome via Illumina second generation sequencing. PLoS One 6(6):e21220.
27. Xia Z, Xu H, Zhai J, Li D, Luo H, et al. (2011) RNA-Seq analysis and de novo
transcriptome assembly ofHevea brasiliensis. Plant Mol Biol 77(3):299–308.
28. Markovets AA, Herman D (2011) Analysis of cancer metabolism with high-throughput technologies. BMC Bioinformatics (Suppl 10):S8.
29. Trapnell C, Williams BA, Pertea G, Mortazavi A, Kwan G, et al. (2010) Transcript assembly and quantification by RNA-Seq reveals unannotated transcripts and isoform switching during cell differentiation. Nat Biotechnol 28(5):511–515.
30. Mu Y, Ding F, Cui P, Ao J, Hu S, et al. (2010) Transcriptome and expression profiling analysis revealed changes of multiple signaling pathways involved in immunity in the large yellow croaker during Aeromonas hydrophila infection. BMC Genomics 11:506.
31. Audic S, Claverie JM (1997) The significance of digital gene expression profiles. Genome Res 7(10):986–995.
32. Guidugli KR, Nascimento AM, Amdam GV, Barchuk AR, Omholt S, et al. (2005) Vitellogenin regulates hormonal dynamics in the worker caste of a eusocial insect. FEBS Lett 579(22):4961–4965.
33. Corona M, Velarde RA, Remolina S, Moran-Lauter A, Wang Y, et al. (2007) Vitellogenin, juvenile hormone, insulin signaling, and queen honey bee longevity. Proc Natl Acad Sci U S A 104(17):7128–7133.
34. Martins JR, Nunes FM, Cristino AS, Simo˜es ZL, Bitondi MM (2010) The four hexamerin genes in the honey bee: structure, molecular evolution and function deduced from expression patterns in queens, workers and drones. BMC Mol Biol 11:23.
35. Martins JR, Anhezini L, Dallacqua RP, Simo˜es ZL, Bitondi MM (2011) A honey bee hexamerin, HEX 70a, is likely to play an intranuclear role in developing and mature ovarioles and testioles. PLoS One 6(12):e29006.
36. Zhou X, Oi FM, Scharf ME (2006) Social exploitation of hexamerin: RNAi reveals a major caste-regulatory factor in termites. Proc Natl Acad Sci U S A 103(12):4499–4504.
37. Zhou X, Tarver MR, Bennett GW, Oi FM, Scharf ME (2006) Two hexamerin
genes from the termiteReticulitermes flavipes: Sequence, expression, and proposed
functions in caste regulation. Gene 376(1):47–58.
38. Willis LG, Winston ML, Honda BM (1992) Phylogenetic relationships in the honeybee (genus Apis) as determined by the sequence of the cytochrome oxidase II region of mitochondrial DNA. Mol Phylogenet Evol 1(3):169–178. 39. Robertson HM, Wanner KW (2006). The chemoreceptor superfamily in the
honey bee,Apis mellifera: expansion of the odorant, but not gustatory, receptor
family. Genome Res 16:1395–1403.
40. Zeng ZJ (2009) The biology of the honeybee. In: Wu XF, editor. Apiculture. Beijing: Chinese Agricultural Press. 36–38.
41. Grabherr MG, Haas BJ, Yassour M, Levin JZ, Thompson DA, et al. (2011) Full-length transcriptome assembly from RNA-Seq data without a reference genome. Nat Biotechnol 29(7):644–652.
42. Iseli C, Jongeneel CV, Bucher P (1999) ESTScan: a program for detecting, evaluating, and reconstructing potential coding regions in EST sequences. Proc Int Conf Intell Syst Mol Biol 138–148.
43. Conesa A, Go¨tz S, Garcı´a-Go´mez JM, Terol J, Talo´n M, et al. (2005) Blast2GO: a universal tool for annotation, visualization and analysis in functional genomics research. Bioinformatics 21(18):3674–3676.
44. Ye J, Fang L, Zheng H, Zhang Y, Chen J, et al. (2006) WEGO: a web tool for plotting GO annotations. Nucleic Acids Res 34(Web Server issue):W293–297. 45. Lourenc¸o AP, Mackert A, Cristino AS, Simo˜es ZLP (2008) Validation of
reference genes for gene expression studies in the honey bee,Apis mellifera, by
quantitative real-time RT-PCR. Apidologie 39(3):372–385.