Molecular genetic diversity in populations of the stingless bee
Plebeia remota
:
A case study
Flávio de Oliveira Francisco, Leandro Rodrigues Santiago and Maria Cristina Arias
Departamento de Genética e Biologia Evolutiva, Instituto de Biociências, Universidade de São Paulo,
São Paulo, SP, Brazil.
Abstract
Genetic diversity is a major component of the biological diversity of an ecosystem. The survival of a population may be seriously threatened if its genetic diversity values are low. In this work, we measured the genetic diversity of the stingless beePlebeia remota based on molecular data obtained by analyzing 15 microsatellite loci and sequencing two mitochondrial genes. Population structure and genetic diversity differed depending on the molecular marker ana-lyzed: microsatellites showed low population structure and moderate to high genetic diversity, while mitochondrial DNA (mtDNA) showed high population structure and low diversity in three populations. Queen philopatry and male dispersal behavior are discussed as the main reasons for these findings.
Keywords: mtDNA, Meliponini, microsatellites, philopatry, population genetics.
Received: August 17, 2012; Accepted: November 9, 2012.
Most of the Brazilian tropical flora is pollinated by bees, especially by those belonging to the tribe Meliponini (stingless bees) (Kerret al., 1996; Nogueira-Neto, 1997). The increase in habitat loss can lead to severe consequences for bee populations and species diversity (Foley et al., 2005; Brown and Paxton, 2009). Studies focusing on Meli-ponini general biology, including genetic diversity, are still scarce in the literature. Genetic data are essential for a better understanding of macro- and micro-evolutionary processes and patterns in organisms, and provide support for conservation and managing programs (Moritz, 2002; Frankhamet al., 2004).
Recent studies have indicated a low genetic diversity in feral populations of Brazilian stingless bees (Costaet al., 2005; Ariaset al., 2006; Tavareset al., 2007; Borgeset al., 2010; Brito and Arias, 2010; Francisco and Arias, 2010). This low genetic diversity may have negative conse-quences for the long-term population survival rate and raises important questions related to conservation programs for the Meliponini.
An adequate understanding of how genetic diversity is distributed and maintained among stingless bee popula-tions requires a consideration of behavioral components such as philopatry. Philopatry may restrict individual dis-persion, leading to inbreeding, which consequently reduces heterozygosity; philopatry also increases the effects of ge-netic drift due to population subdivision and isolation.
However, studies in a variety of organisms have shown that if one gender is philopatric then the other one normally me-diates gene flow through dispersion (Whitehead, 1998; Nyakaana and Arctander, 1999; Kappeleret al., 2002; Apio
et al., 2010). This behavioral mechanism minimizes the negative effects of philopatry.
It has already been demonstrated in some stingless bee species that the queen is philopatric (Nogueira-Neto, 1954; Engels and Imperatriz-Fonseca, 1990) and males are the dispersing sex (Carvalho-Zilse and Kerr, 2004; Ca-meronet al., 2004). Despite this dispersal by males, studies based on allozyme analysis (Tavareset al., 2007; Costaet
al., 2005), RAPD (Tavares et al., 2007), mtDNA RFLP
(Brito and Arias, 2010; Francisco and Arias, 2010) and microsatellites (Franciscoet al., 2006; Tavareset al., 2007; Carvalho-Zilseet al., 2009; Borgeset al., 2010) have re-vealed a low genetic diversity in Brazilian stingless bee populations.
The stingless beePlebeia remotaoccurs in Bolivia
and southeastern and southern Brazil (Camargo and Pedro, 2012). This species generally builds its nests in tree cavi-ties, with colonies of up to 5,000 bees (van Benthemet al., 1995); the workers are small (~0.5 cm in length) (Hilárioet al., 2007). In a previous investigation, Francisco and Arias (2010) described low intrapopulation mitochondrial poly-morphism for this species. In the present work, we rea-nalyzed most of those samples to measure nuclear genetic diversity based on the amplification of microsatellite loci with specific primers and also by sequencing two mito-chondrial genes.
Genetics and Molecular Biology, 36, 1, 118-123 (2013)
Copyright © 2013, Sociedade Brasileira de Genética. Printed in Brazil www.sbg.org.br
Send correspondence to Maria Cristina Arias. Rua do Matão 277, sala 320, Cidade Universitária, 05508-090 São Paulo, SP, Brazil. E-mail: [email protected].
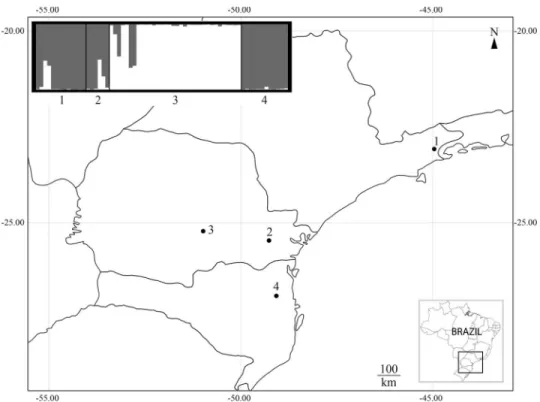
One worker bee from each of 65 nests was analyzed for nuclear and mitochondrial loci. The samples originated from four localities (referred to from here on as “popula-tions”): Cunha in São Paulo state (n = 13), Curitiba (n = 6) and Prudentópolis (n = 34) in Paraná state and Blumenau (n = 12) in Santa Catarina state (Figure 1). Total DNA was extracted using Chelex®100 (Bio-Rad) according to a pro-tocol described by Walshet al.(1991). All individuals were
genotyped for 15 microsatellite loci (Francisco et al.,
2011): Prem03, Prem07, Prem57, Prem58, Prem70, Prem75a, Prem78, Prem79, Prem81a, Prem82, Prem83, Prem84, Prem87, Prem93 and Prem94. Microsatellite am-plification and visualization were done as described by Franciscoet al.(2011). Allelic richness (A), observed and expected heterozygosities (HOandHE, respectively) from Hardy-Weinberg proportions, percentage of polymorphic loci and allele frequencies were calculated for each popula-tion using Genalex v.6.41 (Peakall and Smouse, 2006). Due to differences in sample size, rarefaction was applied to
allelic richness (Ar) by using the program HP-Rare 1.0
(Kalinowski, 2005). Log likelihood ratio statistics for link-age disequilibrium were computed using Genepop v.4.1.4 (Rousset, 2008). The Bonferroni correction (Rice, 1989) was applied when multiple comparisons were done. Popu-lation structure was analyzed with the program Structure v.2.3.3 (Pritchardet al., 2000). The program was set up for 500,000 Markov chain Monte Carlo repetitions after an ini-tial burn-in of 20,000 repetitions. The number of structured populations (K) was estimated based on 10 replications for each K (from 1 to 4). The estimate of the best K was
calcu-lated as described by Evannoet al.(2005) using Structure Harvester v.0.6.92 (Earl and VonHoldt, 2012). The pro-gram Clumpp v.1.1.2 (Jakobsson and Rosenberg, 2007) was used to align the 10 repetitions of the best K. The pro-gram Distruct v.1.1 (Rosenberg, 2004) was used to graphi-cally display the results produced by Clumpp. Population structure was also analyzed using theDestestimator (Jost,
2008) which was calculated for each population pair by the program SMOGD v.1.2.5 (Crawford, 2010).
Two mitochondrial genes, cytochrome c oxidase sub-unit I (COI) and cytochrome b (Cytb), were partially
ampli-fied by using the primers mtD06 + mtD09 (Simonet al.,
1994) and mtD26 (Simonet al., 1994) + AMB16 (Ariaset
al., 2008), respectively. PCR assays were done with 1mL of
DNA, 1x PCR buffer, 200mM of each dNTP, 3 mM of
MgCl2, 0.8mM of each primer, 1 M of betaine anhydrous
(USB Corporation) and 1 U ofTaqDNA polymerase
(Invi-trogen) in a final volume of 10mL. The amplification con-ditions consisted of an initial denaturation at 94 °C for 5 min, followed by 35 cycles of denaturation at 94 °C for 60 s, annealing at 42 °C for 60 s and elongation at 64 °C for 80 s, and a final elongation step at 64 °C for 10 min. PCR products (2mL aliquots) were analyzed by electrophoresis in 0.8% agarose gels stained with GelRed (Biotium) and vi-sualized under UV light. About 100-200 ng of each product
was purified with 0.5mL of ExoSAP-IT(USB Corporation)
and used for sequencing reactions according to the manu-facturer’s recommended protocols (BigDye Terminator v.3.1 Cycle sequencing kit, Applied Biosystems). The
sam-Franciscoet al. 119
ples were analyzed in an automatic sequencer ABI PRISM 3100 Genetic Analyzer (Applied Biosystems). DNA se-quences were edited using the Geneious v.5.1.6 software
package (Drummondet al., 2010). The alignment was done
using the algorithm Muscle (Edgar, 2004) from Geneious, with a maximum number of eight iterations. DnaSP v.5.10.01 software (Librado and Rozas, 2009) was used to identify individual haplotypes and their frequencies. A haplotype network was generated with the software Net-work v.4.6.1.0. Exact tests between pairs of populations were done using Arlequin v.3.5.1.3 (Excoffier and Lischer, 2010).
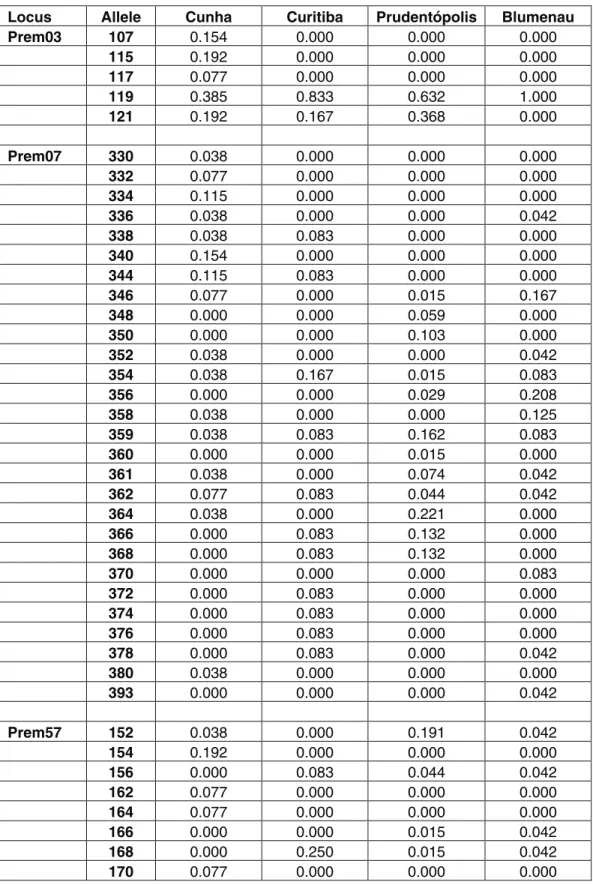
All microsatellite loci analyzed were polymorphic. The allele frequencies for each locus and for each popula-tion are included in the Supplementary material to this pa-per (Table S1). The intrapopulation genetic diversity indices ranged from moderate to high (Table 1). No signifi-cant linkage disequilibrium was detected after Bonferroni correction for each pair of loci tested. Population structure results divided the four populations into two clusters: [Cunha-Curitiba-Blumenau] and [Prudentópolis] (Figu-re 1, Table S2).
A total of 794 bp (415 fromCOIand 379 bp from
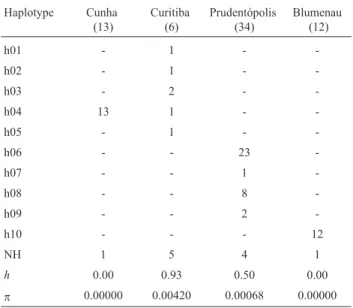
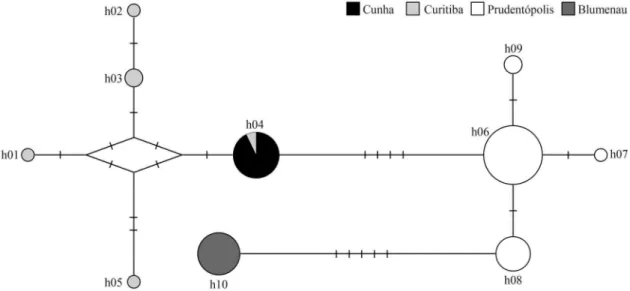
Cytb) was obtained for all individuals (GenBank accession numbers JQ517144-JQ517273). Ten haplotypes were iden-tified, most of which were exclusive to a specific popula-tion, except for one (h04) (Table 2). Table 2 also shows the haplotype and nucleotide diversity indices; they were not correlated to sample size. Figure 2 shows the network built to represent the associations between haplotypes and the genetic differentiation among populations. The maximum number of nucleotide differences between two haplotypes was 14 (1.8%). Exact tests based on haplotype frequencies showed differentiation between all population pairs (all p < 0.0005).
Population structure and genetic diversity varied, de-pending on the molecular marker analyzed. The micro-satellite data showed a low population structure and moderate to high genetic diversity, whereas the mtDNA data showed a high population structure and low diversity in three populations. The mtDNA data suggested an ab-sence of female gene flow among the populations, and rein-forced the philopatric behavior of queens and its strong
influence on the genetic differentiation observed. These findings agree with previous data obtained by RFPL of mtDNA that also showed no gene flow through females (Francisco and Arias, 2010).
The level of intrapopulation nuclear diversity was moderate to high. The Prudentópolis population had the lowest genetic diversity index, which suggested genetic isolation. The nuclear data also indicated a low population structure among the Cunha, Curitiba, and Blumenau popu-lations. An absent or low genetic structure can be attributed to homoplasy in microsatellite size but should be accompa-nied by a decrease in genetic variability (Estoup et al., 2002), which was not the case here.
Since female philopatry was detected in these popula-tions, the absence of genetic structure can be explained by male dispersal. The few genetic studies of Meliponini male congregations have demonstrated the presence of males from distant areas, with more than 100 colonies acting as male donors (Paxton, 2000; Cameronet al., 2004; Krauset al., 2008; Muelleret al., 2012).
120 Genetic diversity inPlebeia remota
Table 1- Genetic diversity for each population ofPlebeia remotabased on microsatellite data.
Population N A Ar HO HE PPL
Cunha 13 7.667 (±0.866) 5.731 (±0.447) 0.749 (±0.044) 0.772 (±0.029) 100.00% Curitiba 6 5.933 (±0.679) 5.933 (±0.679) 0.644 (±0.067) 0.692 (±0.049) 100.00% Prudentópolis 34 6.600 (±1.041) 4.110 (±0.522) 0.551 (±0.078) 0.582 (±0.076) 93.33% Blumenau 12 6.400 (±0.920) 4.799 (±0.629) 0.600 (±0.090) 0.605 (±0.082) 86.67% Mean 16.3 (±1.4) 6.650 (±0.439) 5.143 (±0.297) 0.636 (±0.036) 0.663 (±0.032) 95.00% (±3.19%)
A: allelic richness;Ar: allelic richness after rarefaction for six individuals;HOandHE: observed and expected heterozygosity from Hardy-Weinberg
pro-portions, respectively; N: sample size; PPL: percentage of polymorphic loci. Values in parentheses are standard errors.
Table 2- Frequency and distribution of mtDNA haplotypes identified in Plebeia remota. Haplotype Cunha (13) Curitiba (6) Prudentópolis (34) Blumenau (12)
h01 - 1 -
-h02 - 1 -
-h03 - 2 -
-h04 13 1 -
-h05 - 1 -
-h06 - - 23
-h07 - - 1
-h08 - - 8
-h09 - - 2
-h10 - - - 12
NH 1 5 4 1
h 0.00 0.93 0.50 0.00
p 0.00000 0.00420 0.00068 0.00000
Thus, the divergence between mitochondrial and nu-clear data is a consequence of the reproductive behavior of
P. remota. The low mtDNA variability indicates a low dis-persal capability of females,i.e., queen philopatry. In con-trast, the high nuclear genetic variability is maintained by male dispersal. This male behavior is crucial to avoid in-breeding and to keep the population genetically healthy. Since Meliponini species show queen philopatry (Noguei-ra-Neto, 1954; Engels and Imperatriz-Fonseca, 1990), we expect a similar genetic scenario in other species.
Acknowledgments
We thank Susy Coelho and Ana Carolina Lima No-velli for technical assistance and anonymous reviewers for their comments and suggestions on an earlier version of this
manuscript. FOF was supported by scholarships
(99/11190-6 and 08/08546-4) and grants (04/15801-0 and 10/50597-5) from Fundação de Amparo à Pesquisa do Estado de São Paulo (FAPESP). LRS was supported by a scholarship from Coordenação de Aperfeiçoamento de Pes-soal de Nível Superior (CAPES). This work was developed in the Research Center on Biodiversity and Computing (BioComp) of the Universidade de São Paulo (USP), sup-ported by the USP Provost’s Office for Research.
References
Apio A, Kabasa JD, Ketmaier V, Schröder C, Plath M and Tie-demann R (2010) Female philopatry and male dispersal in a cryptic, bush-dwelling antelope: A combined molecular and behavioural approach. J Zool 280:213-220.
Arias MC, Brito RM, Francisco FO, Moretto G, Oliveira FF and Silvestre D (2006) Molecular markers as a tool for popula-tion and evolupopula-tionary studies of stingless bees. Apidologie 37:259-274.
Arias MC, Silvestre D, Francisco FO, Weinlich R and Sheppard WS (2008) An oligonucleotide primer set for PCR
amplifi-cation of the complete honey bee mitochondrial genome. Apidologie 39:475-480.
Borges AA, Campos LAO, Salomão TMF and Tavares MG (2010) Genetic variability in five populations ofPartamona helleri (Hymenoptera, Apidae) from Minas Gerais State, Brazil. Genet Mol Biol 33:781-784.
Brito RM and Arias MC (2010) Genetic structure ofPartamona helleri(Apidae, Meliponini) from Neotropical Atlantic rain-forest. Insectes Soc 57:413-419.
Brown MJF and Paxton RJ (2009) The conservation of bees: A global perspective. Apidologie 40:410-416.
Cameron EC, Franck P and Oldroyd BP (2004) Genetic structure of nest aggregations and drone congregations of the south-east Asian stingless bee Trigona collina. Mol Ecol 13:2357-2364.
Carvalho-Zilse GA and Kerr WE (2004) Substituição natural de rainhas fisogástricas e distância de vôo dos machos em Tiuba (Melipona compressipes fasciculataSmith, 1854) e Uruçu (Melipona scutellarisLatreille, 1811) (Apidae, Meli-ponini). Acta Amaz 34:649-652.
Carvalho-Zilse GA, Costa-Pinto MFF, Nunes-Silva CG and Kerr WE (2009) Does beekeeping reduce genetic variability in Melipona scutellaris(Apidae, Meliponini)? Genet Mol Res 8:758-765.
Costa RG, Tavares MG, Dias LAS and Campos LAO (2005) Isoenzyme variation inMelipona rufiventris(Hymenoptera, Apidae, Meliponina) in Minas Gerais State, Brazil. Biochem Genet 43:49-58.
Crawford NG (2010) SMOGD: Software for the measurement of genetic diversity. Mol Ecol Resour 10:556-557.
Earl DA and VonHoldt BM (2012) STRUCTURE HARVES-TER: A website and program for visualizing STRUCTURE output and implementing the Evanno method. Conserv Genet Resour 4:359-361.
Edgar RC (2004) MUSCLE: Multiple sequence alignment with high accuracy and high throughput. Nucleic Acids Res 32:1792-1797.
Engels W and Imperatriz-Fonseca VL (1990) Caste development, reproductive strategies and control of fertility in honeybees and stingless bees. In: Engels W (ed) Social Insects: An
Evo-Franciscoet al. 121
lutionary Approach to Castes and Reproduction. Springer, Berlin, pp 166-230.
Estoup A, Jarne P and Cornuet J-M (2002) Homoplasy and muta-tion model at microsatellite loci and their consequences for population genetics analysis. Mol Ecol 11:1591-1604. Evanno G, Regnaut S and Goudet J (2005) Detecting the number
of clusters of individuals using the software structure: A simulation study. Mol Ecol 14:2611-2620.
Excoffier L and Lischer HE (2010) Arlequin suite ver 3.5: A new series of programs to perform population genetics analyses under Linux and Windows. Mol Ecol Resour 10:564-567. Foley JA, DeFries R, Asner GP, Barford C, Bonan G, Carpenter
SR, Chapin FS, Coe MT, Daily GC, Gibbs HK,et al.(2005) Global consequences of land use. Science 309:570-574. Francisco FO and Arias MC (2010) Inferences of evolutionary
and ecological events that influenced the population struc-ture of ±, a stingless bee from Brazil. Apidologie 41:216-224.
Francisco FO, Brito RM and Arias MC (2006) Allele number and heterozygosity for microsatellite loci in different stingless bee species (Hymenoptera, Apidae, Meliponini). Neotrop Entomol 35:638-643.
Francisco FO, Brito RM, Santiago LR, Gonçalves PHP, Pioker FC, Domingues-Yamada AMT and Arias MC (2011) Isola-tion and characterizaIsola-tion of 15 microsatellite loci in the stingless beePlebeia remota(Apidae, Meliponini). Conserv Genet Resour 3:417-419.
Frankham R, Ballou JD and Briscoe DA (2004) A Primer of Con-servation Genetics. Cambridge University Press, New York, 236 pp.
Hilário SD, Ribeiro MF and Imperatriz-Fonseca VL (2007) Efeito do vento sobre a atividade de vôo dePlebeia remota (Holm-berg, 1903) (Apidae, Meliponini). Biota Neotrop 7:225-232. Jakobsson M and Rosenberg NA (2007) CLUMPP: A cluster matching and permutation program for dealing with label switching and multimodality in analysis of population struc-ture. Bioinformatics 23:1801-1806.
Jost L (2008)GSTand its relatives do not measure differentiation.
Mol Ecol 17:4015-4026.
Kalinowski ST (2005) HP-Rare 1.0: A computer program for per-forming rarefaction on measures of allelic richness. Mol Ecol Notes 5:187-189.
Kappeler PM, Wimmer B, Zinner D and Tautz D (2002) The hid-den matrilineal structure of a solitary lemur: Implications for primate social evolution. Proc R Soc B - Biol Sci 269:1755-1763.
Kerr WE, Carvalho GA and Nascimento VA (1996) Abelha Uru-çu: Biologia, Manejo e Conservação. Fundação Acangaú, Belo Horizonte, 144 pp.
Kraus FB, Weinhold S and Moritz RFA (2008) Genetic structure of drone congregations of the stingless beeScaptotrigona mexicana. Insectes Soc 55:22-27.
Librado P and Rozas J (2009) DnaSP v5: A software for compre-hensive analysis of DNA polymorphism data. Bioin-formatics 25:1451-1452.
Moritz C (2002) Strategies to protect biological diversity and the evolutionary processes that sustain it. Syst Biol 51:238-254. Mueller MY, Moritz RF and Kraus FB (2012) Outbreeding and
lack of temporal genetic structure in a drone congregation of the neotropical stingless beeScaptotrigona mexicana. Ecol Evol 2:1304-1311.
Nogueira-Neto P (1954) Notas bionômicas sobre meliponíneos: III – Sobre a enxameagem. Arq Mus Nac 42:419-451. Nogueira-Neto P (1997) Vida e Criação de Abelhas Indígenas
Sem Ferrão. Nogueirapis, São Paulo, 445 pp.
Nyakaana S and Arctander P (1999) Population genetic structure of the African elephant in Uganda based on variation at mi-tochondrial and nuclear loci: Evidence for male-biased gene flow. Mol Ecol 8:1105-1115.
Paxton RJ (2000) Genetic structure of colonies and a male aggre-gation in the stingless beeScaptotrigona postica, as revealed by microsatellite analysis. Insectes Soc 47:63-69.
Peakall ROD and Smouse PE (2006) Genalex 6: Genetic analysis in Excel. Population genetic software for teaching and re-search. Mol Ecol Notes 6:288-295.
Pritchard JK, Stephens M and Donnelly P (2000) Inference of population structure using multilocus genotype data. Genet-ics 155:945-959.
Rice WR (1989) Analyzing tables of statistical tests. Evolution 43:223-225.
Rosenberg NA (2004) Distruct: A program for the graphical dis-play of population structure. Mol Ecol Notes 4:137-138. Rousset F (2008) Genepop’007: A complete re-implementation of
the genepop software for Windows and Linux. Mol Ecol Resour 8:103-106.
Simon C, Frati F, Beckenbach A, Crespi B, Liu H and Flook P (1994) Evolution, weighting, and phylogenetic utility of mi-tochondrial gene-sequences and a compilation of conserved polymerase chain-reaction primers. Ann Entomol Soc Am 87:651-701.
Tavares MG, Dias LAS, Borges AA, Lopes DM, Busse AHP, Costa RG, Salomão TMF and Campos LAO (2007) Genetic divergence between populations of the stingless bee uruçu amarela (Melipona rufiventris group, Hymenoptera, Meliponini): Is there a newMeliponaspecies in the Brazil-ian state of Minas Gerais? Genet Mol Biol 30:667-675. van Benthem FDJ, Imperatriz-Fonseca VL and Velthuis HHW
(1995) Biology of the stingless beePlebeia remota (Holm-berg): Observations and evolutionary implications. Insectes Soc 42:71-87.
Walsh PS, Metzger DA and Higuchi R (1991) Chelex 100 as a me-dium for simple extraction of DNA for PCR-based typing from forensic material. BioTechniques 10:506-513. Whitehead H (1998) Cultural selection and genetic diversity in
matrilineal whales. Science 282:1708-1711.
Internet Resources
Arlequin ver. 3.5.1.3 software, http://cmpg.unibe.ch/soft-ware/arlequin35/ (June 15th, 2012).
Camargo JMF and Pedro SRM (2012) Meliponini Lepeletier, 1836. In: Moure JS, Urban D and Melo GAR (eds) Cata-logue of Bees (Hymenoptera, Apoidea) in the Neotropical Region - online version. http://www.moure.cria.org.br/cat-alogue (October 16th, 2012).
CLUMPP ver. 1.1.2 software,
http://www.stan-ford.edu/group/rosenberglab/clumpp.html/ (June 15th, 2012).
Distruct ver. 1.1 software,
http://www.stan-ford.edu/group/rosenberglab/distruct.html/ (June 15th, 2012).
DnaSP ver. 5.10.01 software, http://www.ub.edu/dnasp/ (June 15th, 2012).
Drummond AJ, Ashton B, Buxton S, Cheung M, Cooper A, Duran C, Field M, Heled J, Kearse M, Markowitz S,et al. (2010) Geneious ver 5.1. http://www.geneious.com/(June 15th, 2012).
GenAlEx ver. 6.41 software,
http://www.anu.edu.au/BoZo/GenAlEx/ (June 15th, 2012). GENEPOP ver. 4.1.4 software, http://genepop.curtin.edu.au/
(June 15th, 2012). HP-Rare ver. 1.0 software,
http://www.montana.edu/kalinowski/Soft-ware/HPRare.htm/ (June 15th, 2012).
National Center for Biotechnology Information – GenBank, http://www.ncbi.nlm.nih.gov/genbank/ (June 15th, 2012). Network ver. 4.6.1.0. software,
http://www.flux-us-engineering.com (June 15th, 2012). SMOGD ver. 1.2.5 software,
http://www.ngcrawford.com/django/jost/ (October 16th, 2012).
Structure ver. 2.3.3 software,
http://pritch.bsd.uchicago.edu/structure.html/ (June 15th, 2012).
Structure Harvester ver. 0.6.92 Software, http://taylor0.biol-ogy.ucla.edu/structureHarvester/ (June 15th, 2012).
Supplementary Material
The following online material is available for this ar-ticle:
Table S1 – Allele size and frequency for each locus scored in four populations ofPlebeia remota.
Table S2 –Dest values for each population pair of
Plebeia remota.
This material is available as part of the online article from http://www.scielo.br/gmb.
Associate Editor: Klaus Hartfelder
License information: This is an open-access article distributed under the terms of the Creative Commons Attribution License, which permits unrestricted use, distribution, and reproduction in any medium, provided the original work is properly cited.
Table S1 -
Allele size and frequency for each locus scored in four populations of
Plebeia remota
.
Locus Allele Cunha Curitiba Prudentópolis Blumenau
Prem03 107 0.154 0.000 0.000 0.000
115 0.192 0.000 0.000 0.000
117 0.077 0.000 0.000 0.000
119 0.385 0.833 0.632 1.000
121 0.192 0.167 0.368 0.000
Prem07 330 0.038 0.000 0.000 0.000
332 0.077 0.000 0.000 0.000
334 0.115 0.000 0.000 0.000
336 0.038 0.000 0.000 0.042
338 0.038 0.083 0.000 0.000
340 0.154 0.000 0.000 0.000
344 0.115 0.083 0.000 0.000
346 0.077 0.000 0.015 0.167
348 0.000 0.000 0.059 0.000
350 0.000 0.000 0.103 0.000
352 0.038 0.000 0.000 0.042
354 0.038 0.167 0.015 0.083
356 0.000 0.000 0.029 0.208
358 0.038 0.000 0.000 0.125
359 0.038 0.083 0.162 0.083
360 0.000 0.000 0.015 0.000
361 0.038 0.000 0.074 0.042
362 0.077 0.083 0.044 0.042
364 0.038 0.000 0.221 0.000
366 0.000 0.083 0.132 0.000
368 0.000 0.083 0.132 0.000
370 0.000 0.000 0.000 0.083
372 0.000 0.083 0.000 0.000
374 0.000 0.083 0.000 0.000
376 0.000 0.083 0.000 0.000
378 0.000 0.083 0.000 0.042
380 0.038 0.000 0.000 0.000
393 0.000 0.000 0.000 0.042
Prem57 152 0.038 0.000 0.191 0.042
154 0.192 0.000 0.000 0.000
156 0.000 0.083 0.044 0.042
162 0.077 0.000 0.000 0.000
164 0.077 0.000 0.000 0.000
166 0.000 0.000 0.015 0.042
168 0.000 0.250 0.015 0.042
172 0.038 0.167 0.000 0.000
174 0.077 0.083 0.074 0.083
176 0.115 0.000 0.176 0.083
178 0.038 0.167 0.000 0.250
180 0.000 0.000 0.015 0.250
182 0.077 0.083 0.044 0.083
184 0.038 0.000 0.265 0.083
186 0.000 0.083 0.088 0.000
188 0.077 0.000 0.044 0.000
190 0.000 0.000 0.029 0.000
192 0.000 0.083 0.000 0.000
196 0.077 0.000 0.000 0.000
Prem58 160 0.000 0.000 0.029 0.000
162 0.000 0.083 0.000 0.542
164 0.000 0.000 0.000 0.042
166 0.038 0.000 0.000 0.000
168 0.154 0.083 0.059 0.292
170 0.231 0.500 0.000 0.042
172 0.269 0.167 0.118 0.083
174 0.192 0.083 0.721 0.000
176 0.115 0.000 0.059 0.000
178 0.000 0.083 0.015 0.000
Prem70 106 0.346 0.000 0.000 0.042
108 0.038 0.000 0.000 0.000
110 0.115 0.000 0.191 0.042
112 0.077 0.417 0.206 0.500
114 0.077 0.583 0.603 0.333
116 0.269 0.000 0.000 0.083
118 0.077 0.000 0.000 0.000
Prem75a 185 0.000 0.000 0.000 0.125
187 0.154 0.000 0.000 0.000
189 0.115 0.000 0.000 0.000
191 0.000 0.167 0.412 0.000
193 0.269 0.083 0.000 0.042
195 0.231 0.250 0.176 0.083
197 0.038 0.167 0.029 0.167
199 0.000 0.000 0.044 0.250
201 0.000 0.000 0.015 0.083
203 0.077 0.083 0.147 0.000
205 0.000 0.000 0.000 0.083
209 0.038 0.000 0.029 0.042
214 0.038 0.000 0.000 0.000
217 0.038 0.000 0.000 0.083
219 0.000 0.167 0.000 0.000
221 0.000 0.083 0.000 0.000
225 0.000 0.000 0.015 0.000
Prem78 176 0.269 0.000 0.426 0.125
178 0.192 0.167 0.000 0.125
180 0.077 0.250 0.000 0.125
184 0.154 0.000 0.000 0.000
186 0.000 0.167 0.000 0.000
190 0.000 0.000 0.000 0.042
192 0.000 0.167 0.015 0.167
194 0.000 0.083 0.103 0.167
196 0.115 0.000 0.279 0.083
198 0.000 0.000 0.059 0.083
200 0.192 0.000 0.118 0.000
202 0.000 0.083 0.000 0.083
207 0.000 0.083 0.000 0.000
Prem79 209 0.000 0.000 0.000 0.042
216 0.231 0.750 1.000 0.958
218 0.269 0.083 0.000 0.000
220 0.308 0.083 0.000 0.000
222 0.192 0.083 0.000 0.000
Prem81a 123 0.038 0.000 0.059 0.000
127 0.000 0.000 0.147 0.000
129 0.038 0.000 0.088 0.500
131 0.038 0.000 0.029 0.208
133 0.077 0.167 0.103 0.125
135 0.000 0.250 0.235 0.000
137 0.154 0.083 0.044 0.000
139 0.346 0.333 0.000 0.000
141 0.038 0.000 0.015 0.000
143 0.269 0.167 0.132 0.000
145 0.000 0.000 0.088 0.125
147 0.000 0.000 0.044 0.042
151 0.000 0.000 0.015 0.000
Prem82 145 0.115 0.417 0.162 0.083
149 0.115 0.083 0.000 0.000
150 0.000 0.000 0.162 0.000
151 0.077 0.083 0.000 0.042
153 0.385 0.083 0.044 0.292
154 0.077 0.167 0.059 0.583
157 0.115 0.083 0.044 0.000
Prem83 208 0.000 0.000 0.015 0.083
217 0.000 0.083 0.000 0.000
221 0.115 0.000 0.015 0.000
223 0.038 0.000 0.000 0.125
225 0.231 0.000 0.044 0.042
227 0.038 0.000 0.147 0.042
229 0.038 0.417 0.147 0.083
231 0.077 0.167 0.324 0.208
233 0.115 0.250 0.074 0.167
235 0.077 0.083 0.044 0.042
237 0.192 0.000 0.015 0.042
239 0.077 0.000 0.044 0.125
241 0.000 0.000 0.103 0.042
243 0.000 0.000 0.029 0.000
Prem84 166 0.308 0.083 0.000 0.167
168 0.231 0.583 0.441 0.292
170 0.192 0.000 0.235 0.292
172 0.000 0.083 0.000 0.042
174 0.000 0.167 0.000 0.000
176 0.038 0.083 0.000 0.083
178 0.000 0.000 0.029 0.000
180 0.038 0.000 0.191 0.125
182 0.077 0.000 0.000 0.000
186 0.077 0.000 0.000 0.000
188 0.038 0.000 0.103 0.000
Prem87 126 0.038 0.000 0.000 0.000
128 0.000 0.000 0.162 0.000
130 0.077 0.000 0.235 0.000
132 0.577 0.167 0.015 0.000
134 0.115 0.250 0.147 0.000
136 0.077 0.167 0.294 0.083
138 0.038 0.083 0.103 0.458
140 0.000 0.000 0.000 0.125
142 0.000 0.167 0.015 0.125
144 0.000 0.000 0.000 0.042
146 0.000 0.000 0.000 0.125
154 0.077 0.000 0.000 0.000
156 0.000 0.000 0.029 0.000
162 0.000 0.083 0.000 0.000
164 0.000 0.000 0.000 0.042
Prem93 106 0.692 0.167 0.000 0.000
108 0.269 0.667 0.912 0.000
110 0.038 0.167 0.088 1.000
Prem94 189 0.269 0.167 0.971 0.542
191 0.038 0.083 0.015 0.125
193 0.346 0.083 0.000 0.000
195 0.115 0.000 0.000 0.000
197 0.115 0.000 0.000 0.000
199 0.115 0.000 0.015 0.125
201 0.000 0.083 0.000 0.042
207 0.000 0.167 0.000 0.042
210 0.000 0.000 0.000 0.042
214 0.000 0.000 0.000 0.042
216 0.000 0.000 0.000 0.042
220 0.000 0.083 0.000 0.000
222 0.000 0.083 0.000 0.000
224 0.000 0.083 0.000 0.000
225 0.000 0.083 0.000 0.000