JHEP07(2013)116
Published for SISSA by SpringerReceived:May 24, 2013
Revised: June 23, 2013 Accepted: June 27, 2013 Published: July 18, 2013
Study of exclusive two-photon production of
W
+W
−in
pp
collisions at
√
s
= 7
TeV and constraints on
anomalous quartic gauge couplings
The CMS collaboration
E-mail: [email protected]
Abstract:A search for exclusive or quasi-exclusive W+W−production by photon-photon
interactions, pp→p(∗)W+W−p(∗), at√s= 7 TeV is reported using data collected by the CMS detector with an integrated luminosity of 5.05 fb−1. Events are selected by requiring a µ±e∓ vertex with no additional associated charged tracks and dilepton transverse mo-mentum pT(µ±e∓) >30 GeV. Two events passing all selection requirements are observed in the data, compared to a standard model expectation of 2.2±0.4 signal events with 0.84±0.15 background. The tail of the dilepton pT distribution is studied for deviations from the standard model. No events are observed with pT>100 GeV. Model-independent upper limits are computed and compared to predictions involving anomalous quartic gauge couplings. The limits on the parametersaW0,C/Λ2 with a dipole form factor and an energy cutoff Λcutoff = 500 GeV are of the order of 10−4.
Keywords: Hadron-Hadron Scattering
JHEP07(2013)116
Contents
1 Introduction 1
2 The CMS detector 2
3 Theory and simulation 3
4 Event selection 5
5 Cross checks with µ+µ− events 6
6 The W+W−
→µ±e∓ signal 10
7 Systematics and cross-checks 13
8 Results 17
9 Summary 20
The CMS collaboration 26
1 Introduction
The detection of high-energy photon interactions at the Large Hadron Collider (LHC) opens up the possibility of interesting and novel research [1,2]. In particular, measurements of the two-photon production of a pair of W-bosons provide sensitivity to anomalous quartic gauge couplings of the gauge bosons. Exploratory studies [3,4] showed potential for extending the experimental reach by several orders of magnitude with respect to the best limits so far obtained at the Tevatron [5] and LEP [6–13]. First measurements of the exclusive two-photon production of muon and electron pairs at √s= 7 TeV, pp →pℓ+ℓ−p, were made using ∼40 pb−1 of data collected with the Compact Muon Solenoid (CMS) at the LHC in 2010 [14, 15]. The present analysis is based on the experimental technique developed in ref. [14] and uses the full data sample collected by the CMS experiment in 2011.
JHEP07(2013)116
In the case of decays of the W+W− pair to same-flavor µ+µ− or e+e− final states, the backgrounds are more than an order of magnitude larger than in theµ±e∓ final state. Therefore in the present analysis, only the µ±e∓ channel is used to search for a pp → p(∗)W+W−p(∗) signal. We use the µ+µ− channel to select a control sample of high-mass pp → p(∗)µ+µ−p(∗) events originating mainly from direct γγ → µ+µ− production. Final states containing aµ±e∓pair may arise from direct decays of W± bosons to electrons and muons or from W→τ ν decays, with theτ subsequently decaying to an electron or a muon. For brevity, we will refer to the full reaction as pp → p(∗)W+W−p(∗) → p(∗)µ±e∓p(∗), where the final state is understood to contain between two and four undetected neutrinos, in addition to the chargedµ±e∓ pair.
We first use the pp → p(∗)µ+µ−p(∗) control sample to validate the selection by com-paring the expected and observed numbers of events and to estimate from the data the proton dissociative contribution. The dominant backgrounds in theµ±e∓ channel, due to the inclusive production of W+W− and τ+τ− pairs, are then constrained using control regions with low pT(µ±e∓) or a low-multiplicity requirement for extra tracks originating from the µ±e∓ vertex.
The data for the signal region are then compared to the standard model (SM) expec-tation for the backgrounds and the γγ → W+W− signal. Finally, tails of the p
T(µ±e∓) distribution, where the SM γγ →W+W− contribution is expected to be small, are inves-tigated to look for anomalous quartic gauge couplings [16].
The paper is organized as follows. Section 2 describes the CMS detector. Section 3 presents the theory related to the γγ → W+W− process and the approach to deal with the anomalous couplings, together with the description of the simulated data. In section4 the trigger, lepton identification, and preselection criteria employed in this analysis are presented in detail. The study of the pp → p(∗)µ+µ−p(∗) control sample is discussed in section5, while the investigation of theµ±e∓signal for the elastic and proton dissociative W+W− production is presented in section 6. Next, section 7 describes the impact of the systematic uncertainties encountered in this analysis along with the additional checks for the background modelling. Finally, the results of this analysis are presented in section 8, followed by the summary in section9.
2 The CMS detector
A detailed description of the CMS experiment can be found elsewhere [17]. The central feature of the CMS apparatus is a superconducting solenoid, of 6 m internal diameter. Within the field volume are the silicon pixel and strip tracker, the crystal electromagnetic calorimeter (ECAL), and the brass-scintillator hadron calorimeter (HCAL). Muons are measured in gas-ionization detectors embedded in the steel flux-return yoke of the magnet. Besides the barrel and endcap detectors, CMS has extensive forward calorimetry.
The CMS experiment uses a right-handed coordinate system, with the origin at the nominal collision point, the x axis pointing towards the center of the LHC ring, the y
JHEP07(2013)116
γ
γ
W
−W
+(a)
γ
γ
W
−W
+(b)
γ
γ
W
−W
+(c)
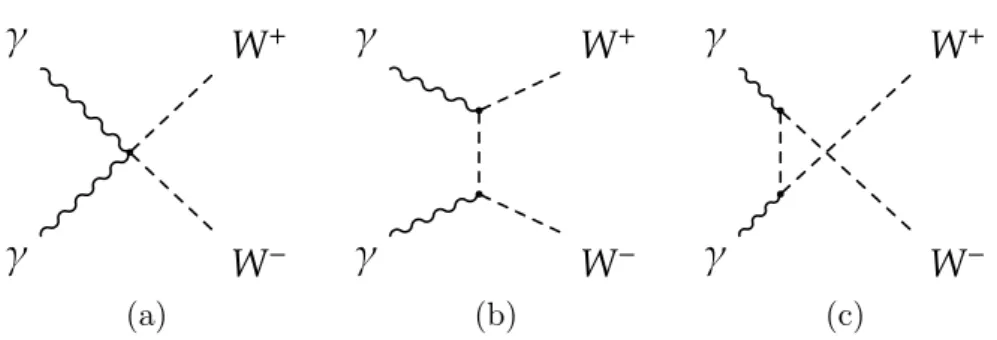
Figure 1. Quartic gauge coupling (a) and t- (b) and u-channel (c) W-boson exchange diagrams
contributing to theγγ→W+W− process at leading order in the SM.
the azimuthal angleφis measured, in radians, in the (x, y) plane relative to thexaxis. The silicon tracker covers a range of |η|<2.4, whereη =−ln[tan(θ/2)], and consists of three layers made of 66 million 100×150µm2pixels followed by ten microstrip layers, with strips of pitch between 80 and 180µm. Muons are measured in the|η|<2.4 range, with detection planes made of three technologies: drift tubes, cathode strip chambers, and resistive-plate chambers. The 3.8 T magnetic field, and the high granularity of the silicon tracker, allow the transverse momentum of the muons matched to tracks in the silicon detector to be measured with a resolution better than ∼1.5% for pT smaller than 100 GeV. The ECAL provides coverage in a range of |η|< 1.479 in the barrel region and 1.479 < |η|< 3.0 in the two endcap regions. The first level of the CMS trigger system, composed of custom hardware processors, uses information from the calorimeters and muon detectors to select (in less than 3µs) the most interesting events. The high-level trigger (HLT) processor farm further decreases the event rate from 100 kHz to a few hundred Hz before data storage.
3 Theory and simulation
The electroweak sector of the SM [18–20] predicts 3- and 4-point vertices with the gauge bosons, which are represented in the SM Lagrangian by the following terms for the quartic WWγγ and triple WWγ couplings:
LWWγ=−ie(∂µAν−∂νAµ)W+µW−ν
LWWγγ =−e2 Wµ+W−µAνAν−Wµ+Wν−AµAν
(3.1)
whereAµ is the photon field andWµ is the W-boson field. As a result, the diagrams that represent the WWγγ interaction at lowest order in the perturbation series consist of both quartic gauge coupling (figure 1(a)) and t- and u-channel W-boson exchange diagrams (figure 1(b,c)).
JHEP07(2013)116
here are instead introduced via an effective Lagrangian containing new terms respecting local U(1)EMand global custodial SU(2)C symmetry. Further imposing charge-conjugation and parity symmetries, C- and P, results in a minimum of two additional dimension-six terms, containing the parameters aW0 andaWC [16]:
L06= e
2
8
aW0
Λ2FµνF
µνW+αW− α −
e2
16 cos2Θ W
aZ
0 Λ2FµνF
µνZαZ α
LC6 = −e
2
16
aWC
Λ2FµαF
µβ(W+αW− β +W
−αW+ β )−
e2
16 cos2Θ W
aZ
C Λ2FµαF
µβZαZ β
(3.2)
where Λcutoff is the energy cutoff scale for the form factor and the second terms in the expressions are those corresponding to the Z-boson couplings. These genuine anomalous quartic couplings are therefore completely independent of the SM triple and quartic gauge couplings. While the γγ → W+W− process contains two triple gauge coupling vertices involving t-channel W-boson exchange (figure 1 left), the sensitivity to anomalous triple gauge couplings is not expected to significantly surpass the existing experimental limits on WWγ couplings from single triple gauge coupling processes [4]. Hence, only anomalous quartic gauge couplings are considered in the analysis, assuming no anomalous triple gauge couplings are present.
The existing constraints on anomalous quartic gauge couplings from e+e− collisions at LEP are derived from e+e−→W+W−γ and W+W−→γγ interactions in which the effec-tive center-of-mass energy is limited to values well below the e+e− center-of-mass energy of √
s= 209 GeV. In contrast, the spectrum ofγγ interactions at the LHC and the Tevatron extends to much higher values, resulting in increased sensitivity to anomalous couplings.
The γγ → W+W− cross section increases quadratically with anomalous coupling strength, and consequently unitarity is violated for high-energyγγinteractions. For anoma-lous couplings aW
0 /Λ2, aWC/Λ2 of order 10−5, the unitarity bound is already reached for collisions with a γγ center-of-mass energy Wγγ ∼1 TeV [3,4]. In order to tame this rising of the cross section, both aW0 /Λ2 andaWC/Λ2 parameters are multiplied by a form factor:
aW0,C(Wγγ2 ) = a
W 0,C
1 + Wγγ2 Λ2
cutoff p
wherepis a free parameter, which is conventionally set to 2 (dipole form factor), following previous studies of anomalous quartic gauge couplings [21,22]. Because the new physics that enters to regulate the cross section has an energy scale Λ and a form that are a priori unknown, we consider both a scenario with a dipole form factor with energy cutoff scale Λcutoff = 500 GeV, and a scenario with no form factor (i.e., Λcutoff → ∞).
The γγ → W+W− signal is generated using CalcHEP2.5.4 [23], with
pythia6.422 [24] used to simulate the decay of the W+W− pair. The simulated
inclu-sive background samples used in this analysis are produced with MadGraph5 [25] for
W+W−+ jets, W + jets, and t¯t processes, and with powheg 1.0 [24, 26–28] for τ+τ− pairs produced via the Drell-Yan process. In the simulated W+W− + jets, W + jets, tt, and Drell-Yan background samples, τ-decays are handled by the tauola [29]
JHEP07(2013)116
and t-channel qq → W+W− interactions, followed by a small (∼ 3%) contribution from gluon-gluon interactions [30]. This inclusive W+W− background sample is scaled to the next-to-leading-order (NLO) prediction obtained from mcfm[31], which describes the
ex-perimentally measured cross section [32,33] within the uncertainties. The underlying event in all background processes is simulated using the Z2 tune [34] of pythia.
In addition to the inclusive W+W−backgrounds, we consider W+W−production from single diffractive interactions, and from WW → WW scattering (vector boson fusion). The diffractive W+W− background is generated using pompyt [35]. Single diffractive W+W− production will result in events with a multiplicity of extra tracks lower than that of non-diffractive production, and with large theoretical uncertainties related to sur-vival probabilities that will suppress the visible cross section. We conservatively consider the diffractive W+W− background with no survival probability correction in the default background estimate. The two-photon processes, γγ → µ+µ− and γγ → τ+τ−, are pro-duced using lpair[36,37], which describes well the exclusive and quasi-exclusive dilepton
measurements of CMS [14,15]. The contribution from (gluon-mediated) central exclusive W+W− production is estimated to be .1% of the γγ →W+W− cross section [38] and is neglected in the current analysis. Thevbfnlogenerator [39] is used to study backgrounds
from WW → WW scattering, with pythia used for hadronization and the decay of the
W+W−pair. All signal and background samples are produced with a detailedGeant4[40] simulation of the CMS detector.
4 Event selection
The data used in this analysis correspond to the full sample collected in 2011 at√s= 7 TeV with the CMS detector. In the µ±e∓ channel all detector subsystems are required to pass the standard data quality requirements, resulting in a sample with an integrated luminosity of 5.05 fb−1. In theµ+µ−channel, which is used only as a control sample, a less restrictive selection is used, requiring that only the muon or tracking systems pass the data quality requirements. This results in a sample with a slightly higher integrated luminosity of 5.24 fb−1.
In the µ±e∓ channel events are selected online by two electron-muon HLT algorithms with asymmetric thresholds. The first algorithm requires a muon of 17 GeV and an electron of 8 GeV, while the second requires a muon of 8 GeV and an electron of 17 GeV. In the
µ±µ∓ channel, dimuon triggers with asymmetric 17 GeV and 8 GeV thresholds on the two muons are used for consistency with the µ±e∓ channel.
JHEP07(2013)116
conversion. A particle flow (PF) algorithm [42] is used to reconstruct particles in the event by combining information from all detector systems. The missing transverse energy E/Tis then computed from the negative vector sum of all particles.
After trigger selection and lepton identification, a first preselection criterion is applied offline on the data by requiring a reconstructed muon and electron of opposite charge, each having pT >20 GeV and|η|<2.4, matched to a common primary vertex with fewer than 15 additional tracks. After the trigger selection, the leptons are required to have an invariant massm(ℓ+ℓ′−)>20 GeV in both theµ±e∓andµ+µ−channels. In the remainder of this paper we will use the notationpT(ℓ+, ℓ′−) to indicate apT selection applied to each lepton of the pair, and pT(ℓ+ℓ′−) to indicate the pT of the pair.
At high luminosities, almost all signal events will have additional interactions within the same bunch crossing (“pileup”), that produce extra charged tracks and extra activity in the calorimeters. During the 2011 LHC run the average number of interactions per crossing was approximately 9. In order to retain efficiency in high pileup conditions, a selection based only on the number of charged tracks originating from the same primary vertex as the ℓ+ℓ′− pair is used, similar to the method in ref. [14].
In theµ±e∓channel the SM signal region is defined to have zero extra tracks associated with the µ±e∓ vertex, and transverse momentum of the pair p
T(µ±e∓) > 30 GeV. The first requirement rejects backgrounds from inclusive production, while the second is chosen based on the simulatedpT(µ±e∓) distribution of the signal and τ+τ− background events. The efficiency for reconstruction of primary vertices with two or more tracks has been measured to be ≥98% in simulation, and ≥99% in data. In addition, events are only accepted asµ±e∓events if they have failed to satisfy theµ±µ∓ selection, in order to reject
γγ → µ+µ− events with the muon misidentified as an electron due to a bremsstrahlung photon overlapping with the muon track.
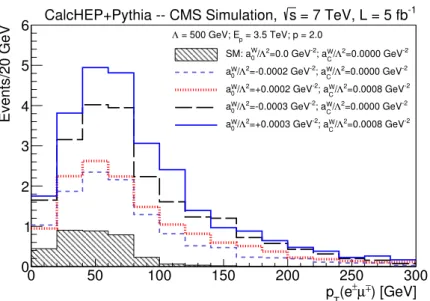
For the anomalous quartic gauge couplings search, a restricted region of pT(µ±e∓)> 100 GeV is used. This is chosen to reduce the expected SM γγ → W+W− contribution to approximately 0.1 events after all selection requirements, while retaining sensitivity to anomalous couplings of order 10−4 for Λ
cutoff = 500 GeV or larger (figure 2). This corre-sponds to values of the anomalous quartic gauge coupling parameters approximately two orders of magnitude smaller than the limits obtained at LEP [7, 8, 12, 13] and approxi-mately one order of magnitude smaller than Tevatron limits [5].
5 Cross checks with µ+µ− events
JHEP07(2013)116
) [GeV] ± µ ± (e T p0 50 100 150 200 250 300
Events/20 GeV 0 1 2 3 4 5 6 -1 = 7 TeV, L = 5 fb s
CalcHEP+Pythia -- CMS Simulation, = 3.5 TeV; p = 2.0
p
= 500 GeV; E
Λ -2 =0.0000 GeV 2 Λ / C W ; a -2 =0.0 GeV 2 Λ / 0 W SM: a -2 =0.0000 GeV 2 Λ / C W ; a -2 =-0.0002 GeV 2 Λ / 0 W a -2 =0.0008 GeV 2 Λ / C W ; a -2 =+0.0002 GeV 2 Λ / 0 W a -2 =0.0000 GeV 2 Λ / C W ; a -2 =-0.0003 GeV 2 Λ / 0 W a -2 =0.0008 GeV 2 Λ / C W ; a -2 =+0.0003 GeV 2 Λ / 0 W a
Figure 2. Transverse momentum distribution of lepton pairs for the γγ → W+W− process at
generator level in the SM (shaded histogram), and for several values of anomalous quartic gauge coupling parameters aW
0 and aWC (open histograms). In this plot Λcutoff = 500 GeV is the energy
cutoff scale in the dipole form factor.
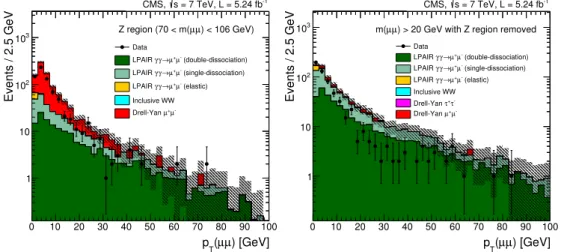
The dimuon sample with zero extra tracks is divided into two kinematic regions based on the pT balance (|∆pT(µ+µ−)|) and acoplanarity (1− |∆φ(µ+µ−)/π|) of the pair. The first region with 1− |∆φ(µ+µ−)/π| < 0.1 and |∆p
T(µ+µ−)| < 1 GeV is defined as the “elastic” region, where the dimuon kinematic requirements are consistent with elastic pp → pµ+µ−p events where both protons remain intact [14]. The second region with 1− |∆φ(µ+µ−)/π|>0.1 or |∆p
T(µ+µ−)|>1 GeV (“dissociation” selection) is dominated by γγ→µ+µ− interactions in which one or both protons dissociate. The latter process is less well-known theoretically, and subject to corrections from rescattering, in which strong interactions between the protons produce additional hadronic activity. As this effect is not included in the simulation, it may lead to a significant over-estimate of the proton disso-ciation contribution in two-photon interactions [43]. We therefore use this second control region to estimate the proton dissociation yield directly from data.
The contributions from exclusive Z production are expected to be negligible compared to the cross section of approximately 0.5 pb from γγ→µ+µ−, withp
JHEP07(2013)116
) [GeV]
µ µ
m(
50 100 150 200 250 300
Events / 5 GeV
20 40 60 80 100 120
140 Z region
-1
= 7 TeV, L = 5.24 fb s
CMS,
Data
(double-dissociation)
-µ
+
µ → γ γ
LPAIR
(single-dissociation)
-µ
+
µ → γ γ
LPAIR
(elastic)
-µ
+
µ → γ γ
LPAIR
-τ
+
τ
Drell-Yan
-µ
+
µ
Drell-Yan
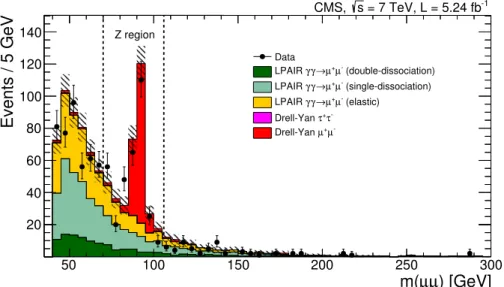
Figure 3. Invariant mass distribution of the muon pairs for the elastic selection with no additional track on the dimuon vertex. The dashed lines indicate the Z-peak region. The hatched bands indicate the statistical uncertainty in the simulation.
Region Data Simulation Data/Simulation Elastic 820 906±9 0.91±0.03 Dissociation 1312 1830±17 0.72±0.02 Total 2132 2736±19 0.78±0.02
Table 1. Total number of data events compared to the sum of all the background events expected in the two control regions, after trigger and preselection criteria. The uncertainties are statistical only.
µ+µ− production vertex, good agreement is observed between data and simulation. This confirms that pileup effects and low-multiplicity fluctuations of the inclusive Drell-Yan processes are well modeled. The hatched bands indicate the statistical uncertainty. In figure 5 the dimuon pair invariant mass is plotted for the dissociation selection with zero extra tracks.
Table1lists the number of events with zero extra tracks seen in the data and expected from simulation in the µ+µ− sample after trigger and preselection criteria. In the elastic region, the sum of all contributions in simulation using thelpairgenerator is∼10% greater
than the yield observed in data. In the dissociation region, which is expected to be most affected by rescattering corrections [43], an overall deficit of 28% is observed in the data. As seen in figure6, this deficit is particularly large at highpT(µ+µ−).
JHEP07(2013)116
| π )/ µ µ ( φ ∆ 1-|0 0.01 0.02 0.03 0.04 0.05 0.06 0.07 0.08 0.09 0.1
Events / 0.002
1 10
2
10
-1
= 7 TeV, L = 5.24 fb s
CMS,
) < 106 GeV)
µ µ
Z region (70 < m(
Data (double-dissociation) -µ + µ → γ γ LPAIR (single-dissociation) -µ + µ → γ γ LPAIR (elastic) -µ + µ → γ γ LPAIR -µ + µ Drell-Yan | π )/ µ µ ( φ ∆ 1-|
0 0.01 0.02 0.03 0.04 0.05 0.06 0.07 0.08 0.09 0.1
Events / 0.002
1 10 2 10 3 10 -1
= 7 TeV, L = 5.24 fb s
CMS,
) > 20 GeV with Z region removed
µ µ m( Data (double-dissociation) -µ + µ → γ γ LPAIR (single-dissociation) -µ + µ → γ γ LPAIR (elastic) -µ + µ → γ γ LPAIR -τ + τ Drell-Yan -µ + µ Drell-Yan ) [GeV] µ µ ( T p
0 0.5 1 1.5 2 2.5 3 3.5 4 4.5 5
Events / 0.25 GeV
10 20 30 40 50 60 70 -1
= 7 TeV, L = 5.24 fb s
CMS,
) < 106 GeV)
µ µ
Z region (70 < m(
Data (double-dissociation) -µ + µ → γ γ LPAIR (single-dissociation) -µ + µ → γ γ LPAIR (elastic) -µ + µ → γ γ LPAIR -µ + µ Drell-Yan ) [GeV] µ µ ( T p
0 0.5 1 1.5 2 2.5 3 3.5 4 4.5 5
Events / 0.25 GeV
20 40 60 80 100 120 140 -1
= 7 TeV, L = 5.24 fb s
CMS,
) > 20 GeV with Z region removed
µ µ m( Data (double-dissociation) -µ + µ → γ γ LPAIR (single-dissociation) -µ + µ → γ γ LPAIR (elastic) -µ + µ → γ γ LPAIR -τ + τ Drell-Yan -µ + µ Drell-Yan
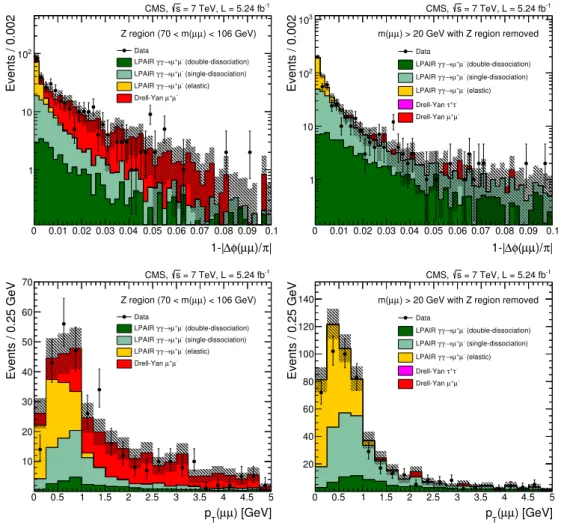
Figure 4. Kinematic distributions for the elastic selection, for the Z region only
(70 GeV< m(µ+µ−)<106 GeV, left panel) and with the Z region removed (right panel). The
acopla-narity (above) andpTofµ+µ−pairs with zero extra tracks (below) are shown. The hatched bands
indicate the statistical uncertainty in the simulation.
mass over 160 GeV, corrected for the DY contribution, is divided by the prediction for the fully exclusive, elastic production predicted by lpair,
F = Nµµ data−NDY
Nelastic m
(µ+µ−)>160 GeV
,
F = 3.23±0.53.
(5.1)
This factor F is then be applied to scale the CalcHEPsignal prediction and obtain
the total cross section for two-photon W+W− production including elastic and proton dissociative contributions. This assumes the dilepton kinematics are the same in elastic and proton dissociative production, with the difference in efficiency arising from the requirement of zero extra tracks originating from the W+W− production vertex.
JHEP07(2013)116
) [GeV]
µ µ
m(
50 100 150 200 250 300
Events / 5 GeV
-1 10 1 10 2 10 3 10 Z region -1
= 7 TeV, L = 5.24 fb s CMS, Data (double-dissociation) -µ + µ → γ γ LPAIR (single-dissociation) -µ + µ → γ γ LPAIR (elastic) -µ + µ → γ γ LPAIR Inclusive WW -τ + τ Drell-Yan -µ + µ Drell-Yan
Figure 5. Invariant mass distribution of the muon pairs for the dissociation selection. The dashed lines indicate the Z-peak region. The hatched bands indicate the statistical uncertainty in the simulation. ) [GeV] µ µ ( T p
0 10 20 30 40 50 60 70 80 90 100
Events / 2.5 GeV
1 10 2 10 3 10 -1
= 7 TeV, L = 5.24 fb s
CMS,
) < 106 GeV)
µ µ
Z region (70 < m(
Data (double-dissociation) -µ + µ → γ γ LPAIR (single-dissociation) -µ + µ → γ γ LPAIR (elastic) -µ + µ → γ γ LPAIR Inclusive WW -µ + µ Drell-Yan ) [GeV] µ µ ( T p
0 10 20 30 40 50 60 70 80 90 100
Events / 2.5 GeV
1 10 2 10 3 10 -1
= 7 TeV, L = 5.24 fb s
CMS,
) > 20 GeV with Z region removed
µ µ m( Data (double-dissociation) -µ + µ → γ γ LPAIR (single-dissociation) -µ + µ → γ γ LPAIR (elastic) -µ + µ → γ γ LPAIR Inclusive WW -τ + τ Drell-Yan -µ + µ Drell-Yan
Figure 6. Transverse momentum distribution for µ+µ− pairs with zero extra tracks passing the
dissociation selection, for the Z region only (left), and with the Z region removed (right). The hatched bands indicate the statistical uncertainty in the simulation.
factor derived from the matrix-elementlpairgenerator to theγγ→W+W−signal sample
produced with CalcHEPaccording to the equivalent photon approximation (EPA) [47].
This is checked by comparing thelpair prediction with the EPA prediction for muon pair
production above 160 GeV in invariant mass, and is taken conservatively as 5%.
6 The W+W−
→µ±e∓ signal
The SM cross section for the purely elastic process pp → pW+W−p is predicted to be 40.0 fb using CalcHEP, or 1.2 fb for the cross section times branching fraction to µ±e∓
JHEP07(2013)116
Selection step Signalǫ×A Visible cross section (fb) Events in dataTrigger and preselection 28.5% 1.1 9086
m(µ±e∓)>20 GeV 28.0% 1.1 8200
Muon ID and Electron ID 22.6% 0.9 1222
µ±e∓vertex with zero extra tracks 13.7% 0.6 6
pT(µ±e∓)>30 GeV 10.6% 0.4 2
Table 2. Product of the signal efficiency and the acceptance, visible cross section, and number of events selected in data at each stage of the selection. The preselection requires a reconstructed muon and electron of opposite charge, each having pT > 20 GeV and |η| < 2.4, matched to a
common primary vertex with fewer than 15 additional tracks.
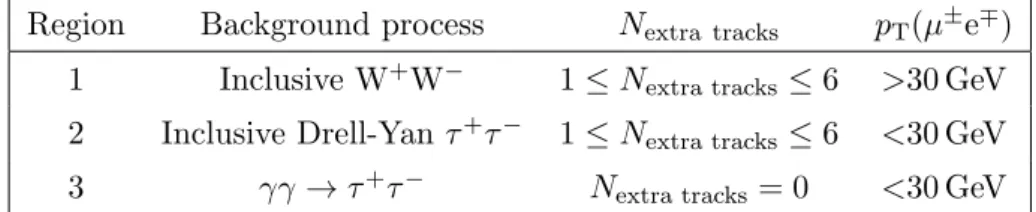
Region Background process Nextra tracks pT(µ±e∓)
1 Inclusive W+W− 1≤N
extra tracks ≤6 >30 GeV 2 Inclusive Drell-Yanτ+τ− 1≤N
extra tracks ≤6 <30 GeV
3 γγ→τ+τ− N
extra tracks = 0 <30 GeV
Table 3. Definitions for the three independent control regions.
sample to account for the additional proton dissociation contribution, the total predicted cross section times branching fraction is:
σtheory(pp→p(∗)W+W−p(∗)→p(∗)µ±e∓p(∗)) = 4.0±0.7 fb.
The acceptance for the SM signal in the fiducial region |η(µ,e)|< 2.4, pT(µ,e)>20 GeV is determined to be 55% using the CalcHEPgenerator.
The predicted visible cross section at each stage of the selection, defined as the pre-dicted cross section multiplied by the efficiency and acceptance, is shown in table2, together with the efficiency and acceptance for the signal, and the corresponding number of events selected from the data sample. The signal inefficiency introduced by the requirement of zero extra tracks on theµ±e∓ vertex reflects the effect of pileup. As described in ref. [14], with increasing pileup there is a higher probability of finding tracks from a pileup interaction in close proximity to the dilepton signal vertex. The incorrect assignment of these tracks to the signal vertex by the vertex clustering algorithm will lead to signal events being rejected. In the 2011 data sample with an average of 9 interactions per bunch crossing, this results in the rejection of ∼40% of signal events that would pass other selection requirements.
To check the modelling of the individual background contributions, we define three independent control regions based on the number of tracks associated to the µ±e∓ vertex and the pT of the µ±e∓ pair, as defined in table 3. To study the inclusive backgrounds, we select two control regions with 1–6 extra tracks associated to the µ±e∓ vertex. The first region has pT(µ±e∓) < 30 GeV and is dominated by inclusive Drell-Yan production of τ+τ− and the second, with p
JHEP07(2013)116
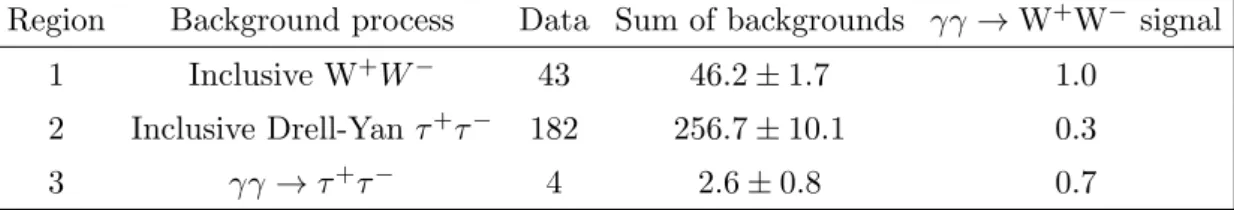
Region Background process Data Sum of backgrounds γγ→W+W− signal
1 Inclusive W+W− 43 46.2±1.7 1.0
2 Inclusive Drell-Yan τ+τ− 182 256.7±10.1 0.3
3 γγ →τ+τ− 4 2.6±0.8 0.7
Table 4. Background event yields for the three independent control regions.
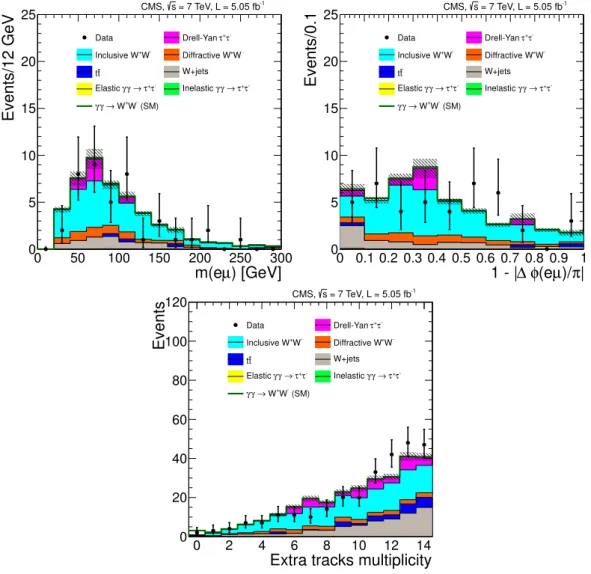
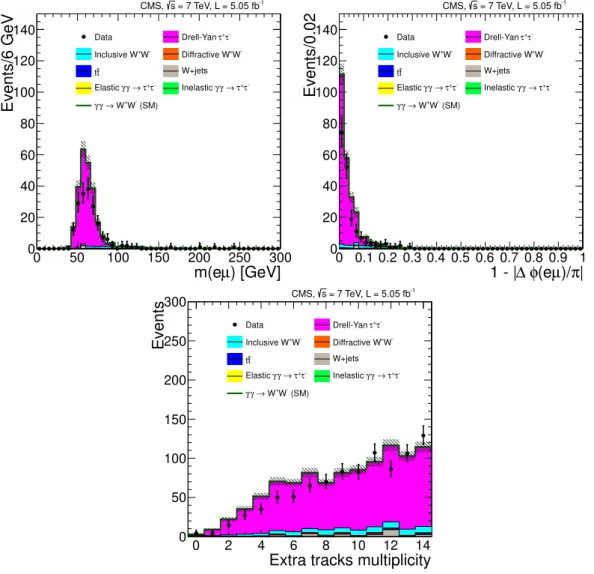
We first compare the data to the expected backgrounds from simulation in the inclusive W+W− region. The predictedpompyt diffractive W+W− contribution is, very conserva-tively, added to the other backgrounds, without accounting for any survival probabilities or overlap with the inclusive W+W− sample. To study the W + jets backgrounds, for which the contribution is mainly from misidentified leptons or non-prompt leptons in jets, we select a control sample of events with pT(µ±e∓) > 30 GeV, where at least one of the two lepton candidates fails the nominal offline identification criteria. This sample is then normalized to the simulation in the high-multiplicity (more than 6 extra tracks) region and used to estimate the W+jets background in the signal and inclusive W+W− control regions. Figure 7 shows the distribution of the number of extra tracks for the W+W− region withpT(µ±e∓)>30 GeV, together with the invariant mass and acoplanarity of the events with 1–6 extra tracks. In general the data are consistent with the sum of simulated backgrounds in this region.
In the Drell-Yan τ+τ−-dominated region withp
T(µ±e∓)<30 GeV and 1–6 tracks we find general agreement in the dilepton kinematic distributions, but an overall deficit in the data sample compared to simulation, with 256.7±10.1 background events expected and 182 observed. Figure8shows the distribution of the number of extra tracks for the events with with pT(µ±e∓) < 30 GeV, together with the invariant mass and acoplanarity of the events with 1–6 extra tracks.
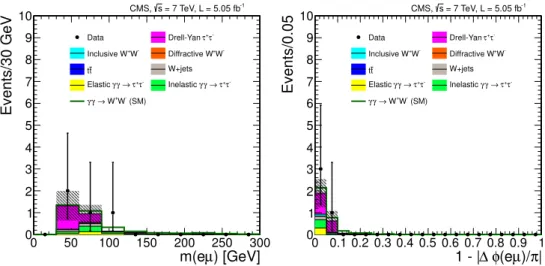
In the τ+τ− sample with zero extra tracks, we find four events in the data sample, compared to a background expectation of 2.5 events from simulation, plus 0.9 events from theγγ →W+W− signal. The expected contribution to the background from γγ→ τ+τ− is approximately 0.7 events. The invariant mass and acoplanarity distributions are shown in figure 9.
Table 4 summarizes the observed and expected background event yields for the three independent control regions. Tracks from pileup vertices may be wrongly associated to the µ±e∓ vertex from a γγ → W+W− event, resulting in signal events being classified as 1–6 tracks events. This signal contamination, as well as that from signal events with
pT(µ±e∓)<30 GeV, is estimated from simulation to be approximately one event or less in any of the control regions.
corre-JHEP07(2013)116
) [GeV]
µ
m(e
0 50 100 150 200 250 300
Events/12 GeV 0 5 10 15 20 25 Data -τ + τ Drell-Yan -W +
Inclusive W
-W + Diffractive W t t W+jets -τ + τ → γ γ
Elastic Inelastic γγ→τ+τ
(SM) -W + W → γ γ -1 = 7 TeV, L = 5.05 fb s CMS, | π )/ µ (e φ ∆
1 - |
0 0.1 0.2 0.3 0.4 0.5 0.6 0.7 0.8 0.9 1
Events/0.1 0 5 10 15 20 25 Data -τ + τ Drell-Yan -W +
Inclusive W
-W + Diffractive W t t W+jets -τ + τ → γ γ
Elastic Inelastic γγ→τ+τ
(SM) -W + W → γ γ -1 = 7 TeV, L = 5.05 fb s
CMS,
Extra tracks multiplicity
0 2 4 6 8 10 12 14
Events 0 20 40 60 80 100 120 Data -τ + τ Drell-Yan -W +
Inclusive W
-W + Diffractive W t t W+jets -τ + τ → γ γ
Elastic Inelastic γγ→τ+τ
(SM) -W + W → γ γ -1 = 7 TeV, L = 5.05 fb s
CMS,
Figure 7. Data compared to simulation in control region 1. The µ±e∓ invariant mass (above
left) and acoplanarity (above right) are shown for events with 1–6 extra tracks on theµ±e∓ vertex
and pT(µ±e∓) >30 GeV. The number of additional tracks on the electron-muon primary vertex
is shown for events with pT(µ±e∓)> 30 GeV (below). The shaded bands indicate the statistical
uncertainty in the background estimation. The signal (open histogram) is shown stacked on top of the backgrounds.
sponding control region with 1–6 extra tracks and pT(µ±e∓) < 30 GeV. Given this, and the agreement with data in the W+W− control region with 1–6 extra tracks and theτ+τ− region with zero extra tracks, no additional rescaling of the backgrounds is performed. The estimated background is 0.84±0.15 events, including the systematic uncertainty on the backgrounds.
7 Systematics and cross-checks
JHEP07(2013)116
) [GeV]
µ
m(e
0 50 100 150 200 250 300
Events/6 GeV 0 20 40 60 80 100 120
140 Data
-τ + τ Drell-Yan -W +
Inclusive W
-W + Diffractive W t t W+jets -τ + τ → γ γ
Elastic Inelastic γγ→τ+τ
(SM) -W + W → γ γ -1 = 7 TeV, L = 5.05 fb s CMS, | π )/ µ (e φ ∆
1 - |
0 0.1 0.2 0.3 0.4 0.5 0.6 0.7 0.8 0.9 1
Events/0.02 0 20 40 60 80 100 120
140 Data
-τ + τ Drell-Yan -W +
Inclusive W
-W + Diffractive W t t W+jets -τ + τ → γ γ
Elastic Inelastic γγ→τ+τ
(SM) -W + W → γ γ -1 = 7 TeV, L = 5.05 fb s
CMS,
Extra tracks multiplicity
0 2 4 6 8 10 12 14
Events 0 50 100 150 200 250 300 Data -τ + τ Drell-Yan -W +
Inclusive W
-W + Diffractive W t t W+jets -τ + τ → γ γ
Elastic Inelastic γγ→τ+τ
(SM) -W + W → γ γ -1 = 7 TeV, L = 5.05 fb s
CMS,
Figure 8. Data compared to simulation in control region 2. The µ±e∓ invariant mass (above
left) and acoplanarity (above right) are shown for events with 1–6 extra tracks on theµ±e∓ vertex
and pT(µ±e∓) <30 GeV. The number of additional tracks on the electron-muon primary vertex
is shown for events with pT(µ±e∓)< 30 GeV (below). The shaded bands indicate the statistical
uncertainty in the background estimation. The signal (open histogram) is shown stacked on top of the backgrounds.
efficiency corrections are varied by their ±1σ statistical uncertainties, with the direction of the variation within eachpT and ηbin correlated. The largest variation in the expected signal (when varying the efficiency scale factors by +1σ) is 4.2%, which is taken as a sys-tematic uncertainty on the signal yield. The variation in the sum of backgrounds expected from simulation due to the trigger and lepton selection is 3.7%, which is taken as a com-ponent of the systematic uncertainty on the background estimate. The uncertainty on the efficiency for reconstructing vertices with two tracks is estimated to be 1.0%, based on the data vs. simulation difference obtained from the method described in ref. [50].
JHEP07(2013)116
) [GeV]
µ
m(e
0 50 100 150 200 250 300
Events/30 GeV 0 1 2 3 4 5 6 7 8 9 10
Data Drell-Yan τ+τ
-W
+
Inclusive W
-W + Diffractive W t t W+jets -τ + τ → γ γ
Elastic Inelastic γγ→τ+τ
(SM) -W + W → γ γ -1
= 7 TeV, L = 5.05 fb s CMS, | π )/ µ (e φ ∆
1 - |
0 0.1 0.2 0.3 0.4 0.5 0.6 0.7 0.8 0.9 1
Events/0.05 0 1 2 3 4 5 6 7 8 9 10
Data Drell-Yan τ+τ
-W
+
Inclusive W
-W + Diffractive W t t W+jets -τ + τ → γ γ
Elastic Inelastic γγ→τ+τ
(SM) -W + W → γ γ -1
= 7 TeV, L = 5.05 fb s
CMS,
Figure 9. Data compared to simulation for control region 3. The µ±e∓ invariant mass (left)
and acoplanarity (right) are displayed for events with zero extra tracks on the µ±e∓ vertex and
pT(µ±e∓) < 30 GeV. The shaded bands indicate the statistical uncertainty in the background
estimation. The signal (open histogram) is shown stacked on top of the backgrounds.
uncertainties are smallest, we assign a 10% systematic uncertainty based on the level of agreement between data and simulation. In addition, we check the stability of the agree-ment between data and simulation as a function of pileup, using samples ranging from a minimum of 1-5 reconstructed vertices to a maximum of 11–20.
The predictions for both theγγ →W+W− signal and theγγ →τ+τ−background are rescaled to reflect the contribution of proton dissociation, as derived from the high-mass
γγ → µ+µ− sample. As described in section 5, a total uncertainty of 16% is assigned to this factor scale factorF, based on the statistical uncertainty of the high-massγγ→µ+µ− control sample and the difference between the matrix-element and EPA approaches.
As a cross-check we perform several alternative estimates and tests of the nominal background contribution of 0.84±0.15 events. To check the sensitivity to the simulation of the dominant W+W− background, we replace the default MadGraph sample with
a pythia sample normalized to the NLO cross section. The agreement with data in
the control region is similar to that of MadGraph and results in a total background
estimate of 0.71±0.21 (stat.) events in the signal region. Scaling the inclusive W+W− background to the central value of the CMS cross section measurement [30], rather than the NLO prediction, would change the total background estimate to 0.88±0.15 events. This change is smaller than the uncertainty on the nominal estimate. The sensitivity to the diffractive component of the W+W− background is further tested by varying the cross section between 0% and 200% of the nominal value. This results in a variation of ±0.03 events in the total background estimate. The contribution from vector boson fusion (VBF), WW → WW, is estimated using the vbfnlo event generator. No VBF events
JHEP07(2013)116
Signal uncertainty Background uncertainty (events)
Trigger and lepton identification 4.2% 0.02
Luminosity 2.2% 0.005
Vertexing efficiency 1.0% 0.005
Exclusivity and pileup dependence 10.0% 0.05
Proton dissociation factor 16.3% 0.02
Table 5. Summary of systematic uncertainties.
In addition, we take advantage of the lack of correlation between the number of the extra tracks and pT(µ±e∓) in the main background processes to estimate the background from data using the three control regions defined in section6. With uncorrelated variables the relationship between the number of events in each region can be expressed asND/NA=
NB/NC, where NA, NB, and NC represent the backgrounds in the inclusive W+W−,
γγ→τ+τ−, and inclusive Drell-Yanτ+τ−control regions, respectively, andN
D represents the background in the signal region. The background in the signal region is then obtained by solving forND, resulting in the expression ND = (NA×NB)/NC. After subtracting the signal contamination estimated from simulation in each region, the resulting background estimate is 0.77±0.44 (stat.) events, with a large statistical uncertainty due to the low statistics in the γγ→τ+τ− control region.
We also examine same-signµ±e± events in data to check for possible backgrounds not included in the simulation, because the main W+W− and τ+τ− backgrounds considered in the analysis are producing opposite-sign lepton pairs. In the control region which has events containing 1–6 extra tracks we find 8 same-sign events with pT(µ±e±) > 30 GeV passing all selection criteria and 11 events withpT(µ±e±)<30 GeV. No events with fewer than two extra tracks on the µ±e± vertex are observed in the full data sample.
Although no Drell-Yan τ+τ− events from the simulation survive all selection criteria, the largest discrepancy between the data sample and the simulated sample is seen in the corresponding control region with 1–6 extra tracks andpT(µ±e∓)<30 GeV. Therefore we perform a final check by recalculating the τ+τ− backgrounds using an “embedding” pro-cedure, in whichµ+µ− events are selected in data, and the muons replaced with simulated
τ decays to final states containing an electron and a muon [51]. In the Drell-Yan control region the embedded sample predicts 165±4 events compared to 182 observed in the data sample. In the signal region, the total background estimated using the embedded sample is 0.67±0.15 events, which is consistent with the nominal background estimate.
The uncertainty in the background estimate includes the statistical uncertainty of the simulated samples or control samples used to evaluate the backgrounds in the signal region. The uncertainties due to trigger and lepton identification, vertexing efficiency, and the exclusivity selection are also applied to the backgrounds that are taken from simulation. An additional uncertainty of 16% is assigned to theγγ→τ+τ− background, reflecting the uncertainty in the normalization of the proton dissociation contribution derived from the
JHEP07(2013)116
) [GeV]
µ
m(e
0 200 400 600 800 1000
Events/100 GeV 0 1 2 3 4 5 6 7 8 Data -τ + τ Drell-Yan -W +
Inclusive W
-W + Diffractive W t t W+jets -τ + τ → γ γ
Elastic Inelastic γγ→τ+τ
(SM) -W + W → γ γ -1 = 7 TeV, L = 5.05 fb s CMS, | π )/ µ (e φ ∆
1 - |
0 0.1 0.2 0.3 0.4 0.5 0.6 0.7 0.8 0.9 1
Events/0.2 0 1 2 3 4 5 6 7 8 Data -τ + τ Drell-Yan -W +
Inclusive W
-W + Diffractive W t t W+jets -τ + τ → γ γ
Elastic Inelastic γγ→τ+τ
(SM) -W + W → γ γ -1 = 7 TeV, L = 5.05 fb s
CMS,
[GeV]
T
E
0 50 100 150 200 250 300
Events/30 GeV 0 1 2 3 4 5 6 7 8 Data -τ + τ Drell-Yan -W +
Inclusive W
-W + Diffractive W t t W+jets -τ + τ → γ γ
Elastic Inelastic γγ→τ+τ
(SM) -W + W → γ γ -1 = 7 TeV, L = 5.05 fb s
CMS,
Figure 10. The µ±e∓ invariant mass (top left), acoplanarity (top right), and missing transverse
energy (bottom) distributions, for events in the signal region with zero extra tracks on the µ±e∓
vertex and pT(µ±e∓)>30 GeV. The backgrounds (solid histograms) are stacked with statistical
uncertainties indicated by the shaded region, the signal (open histogram) is stacked on top of the backgrounds.
8 Results
Examining the SMγγ→W+W−signal region, we find two events passing all the selection criteria, compared to the expectation of 2.2±0.4 signal events and 0.84±0.15 background events, including the systematic uncertainties listed in table 5.
We convert the observed results into a cross section and upper limit for events with zero extra tracks within |η| < 2.4, using the expression σ =N/(ǫ×A× L), where N is the number of events observed, and ǫ×A is the efficiency times acceptance for a SM-like signal. Correcting for efficiency, acceptance, and backgrounds, the best fit signal cross section times branching fraction is:
σ(pp→p(∗)W+W−p(∗)→p(∗)µ±e∓p(∗)) = 2.2+3.3
JHEP07(2013)116
) [GeV] µ (e T p0 50 100 150 200 250 300
Events/30 GeV 0 5 10 15 20 25 30 =500GeV) cutoff Λ = 0, 2 Λ C W a , -4 = 2*10 2 Λ 0 W a ( -W + W → γ γ =500GeV) cutoff Λ , -4 = -8*10 2 Λ C W a , -4 = -2*10 2 Λ 0 W a ( -W + W → γ γ
Data Drell-Yan τ+τ
-W
+
Inclusive W
-W + Diffractive W t t W+jets -τ + τ → γ γ
Elastic Inelastic γγ→τ+τ
(SM) -W + W → γ γ -1
= 7 TeV, L = 5.05 fb s
CMS,
Extra tracks multiplicity
0 2 4 6 8 10 12 14
Events 0 5 10 15 20 25 =500GeV) cutoff Λ = 0, 2 Λ C W a , -4 = 2*10 2 Λ 0 W a ( -W + W → γ γ =500GeV) cutoff Λ , -4 = -8*10 2 Λ C W a , -4 = -2*10 2 Λ 0 W a ( -W + W → γ γ
Data Drell-Yan τ+τ
-W
+
Inclusive W
-W + Diffractive W t t W+jets -τ + τ → γ γ
Elastic Inelastic γγ→τ+τ
(SM) -W + W → γ γ -1
= 7 TeV, L = 5.05 fb s
CMS,
Figure 11. ThepT(µ±e∓) distribution for events with zero extra tracks (left) and multiplicity of
extra tracks for events with pT(µ±e∓)>100 GeV (right). The backgrounds (solid histograms) are
stacked with statistical uncertainties indicated by the shaded region, the signal (open histogram) is stacked on top of the backgrounds. The expected signal is shown for the SM γγ → W+W−
signal (solid lines) and for two representative values of the anomalous couplingsaW 0 /Λ
2andaW
C/Λ
2
(dotted and dashed lines).
with a significance of ∼1σ. With statistical uncertainties only, the resulting value of the cross section times branching fraction is 2.2+3−2..20(stat.) fb.
The observed upper limit is estimated using the Feldman-Cousins method [52] to be 2.6 times the expected SM yield at 95% CL. The median expected limit in the absence of signal is 1.5+1−0..06 times the expected SM yield. Converting this to a limit on the cross section we find at 95% CL:
σ(pp→p(∗)W+W−p(∗)→p(∗)µ±e∓p(∗))<10.6 fb.
The SM prediction is 4.0±0.7 fb, including the uncertainty in the contribution of proton dissociation. The dilepton invariant mass, acoplanarity, and missing transverse energy in the two selected events are consistent with the expectation for the sum of backgrounds and SM γγ→W+W− signal (figure10).
The pT(µ±e∓) distribution for events with zero extra tracks, and the extra tracks multiplicity for events withpT(µ±e∓)>100 GeV, are shown in figure11. In the anomalous quartic gauge coupling search regionpT(µ±e∓)>100 GeV, zero events are observed in data, which is consistent with the SM expectation of 0.14, dominated by pp→p(∗)W+W−p(∗).
We find that the selection efficiency does not vary strongly between the simulated SM and anomalous quartic gauge coupling samples within the detector acceptance (table 6) and, therefore, set an upper limit on the partial cross section times branching fraction for
γγ → W+W− → µ±e∓ with p
T(µ,e) > 20 GeV, |η(µ,e)| < 2.4 (for single leptons), and
JHEP07(2013)116
aW
0 /Λ2 [GeV−2] 0 2×10⁻⁴ −2×10⁻⁴ 7.5×10⁻⁶ 0
aW
C/Λ2 [GeV−2] 0 0 −8×10⁻⁴ 0 2.5×10⁻⁵
Λ [GeV] — 500 500 No form factor No form factor
Efficiency 30.5±5.0% 29.8±2.1% 31.3±1.8% 36.0±1.7% 36.3±1.8%
Table 6. Signal efficiency of all trigger, reconstruction, and analysis selections, relative to the acceptance [pT(µ,e) > 20 GeV, |η(µ,e)| < 2.4, pT(µ±e∓) > 100 GeV] for the SM and for four
representative values of the anomalous couplingsaW
0 /Λ2andaWC/Λ2, with and without form factors.
between the SM simulation and the samples generated with two values of the anomalous couplings.
Using the Feldman-Cousins method [52], the 95% CL confidence interval for the Pois-son mean for signal events is [0,3.0] if the uncertainty on the background mean is neglected. Inserting the uncertainty on the background into the frequentist interval construction re-duces the upper endpoint, as it changes the nature of the problem from a purely discrete observation with typical over-coverage to a continuous problem with exact coverage. To avoid an effect such as this, Cousins and Highland [53] advocated a Bayesian treatment of the nuisance parameter, which in a case such as the present one leaves the upper endpoint essentially unchanged. This results in an upper limit on the partial cross section times branching fraction at 95% CL with the selections pT(µ,e)> 20 GeV, |η(µ,e)|< 2.4, and
pT(µ±e∓)>100 GeV:
σ(pp→p(∗)W+W−p(∗)→p(∗)µ±e∓p(∗))<1.9 fb.
We further investigate the behavior of the limit in different statistical approaches, with and without the systematic uncertainties included as nuisance parameters. The limits derived from a profile likelihood method, a Bayesian method with a flat prior, the Feldman-Cousins method, the Feldman-Cousins and Highland method, and the CLS method [54] range from 1.9 to 3.3 events at 95% CL.
The expected number of events observed as a function of the anomalous quartic gauge coupling parameters is interpolated from simulated samples and used to construct 95% CL intervals according to the Feldman-Cousins prescription. With a dipole form factor of Λcutoff = 500 GeV, the limits obtained on each anomalous quartic gauge coupling parameter with the other fixed to zero are:
−0.00015< aW0 /Λ2 <0.00015 GeV−2 (aW
C/Λ2= 0,Λcutoff= 500 GeV),
−0.0005< aWC/Λ2<0.0005 GeV−2 (aW0 /Λ2= 0,Λcutoff= 500 GeV).
These limits are approximately 20 times more stringent than the best limits obtained at the Tevatron [5] with a dipole form factor of Λcutoff = 500 GeV, and approximately two orders of magnitude more stringent than the best limits obtained at LEP [7,8,12,13].
We perform a similar procedure to derive two dimensional limits on the aW0 /Λ2 and
JHEP07(2013)116
]
-2
[GeV
2
Λ
/
W 0
a
-0.0005 0 0.0005
]
-2
[GeV
2
Λ
/
W C
a
-0.002 -0.001 0 0.001 0.002
Standard Model
CMS 95% confidence region = 500 GeV)
cutoff
Λ
(
CMS 1-D limit, 95% confidence region = 500 GeV)
cutoff
Λ
(
-1
= 7 TeV, L = 5.05 fb s
CMS,
Figure 12. Excluded values of the anomalous coupling parameters aW
0 /Λ2 and aWC/Λ2 with
Λcutoff= 500 GeV. The area outside the solid contour is excluded by this measurement at 95% CL,
obtained for pT(µ,e)>20 GeV,|η(µ,e)|<2.4,pT(µ±e∓)>100 GeV. The predicted cross sections
are rescaled to include the contribution from proton dissociation.
analysis selections, relative to the acceptance, is flat across the anomalous quartic gauge coupling sample space, and to derive a parameterized dependence of the cross section on the anomalous couplings. The resulting two-dimensional 95% confidence region is shown in figure 12, including the form factor with Λcutoff = 500 GeV.
We also obtain the corresponding limits without form factors. In this case the cross section is dominated by the region of high energy γγ interactions, above the unitarity bound. This leads to one dimensional limits on each of the anomalous couplings, with the other fixed to zero, that are much smaller than in the scenario with form factors:
−4.0×10⁻⁶< aW0 /Λ2 <4.0×10⁻⁶GeV−2 (aWC/Λ2= 0,no form factor),
−1.5×10⁻⁵< aWC/Λ2 <1.5×10⁻⁵GeV−2 (aW0 /Λ2= 0,no form factor).
These limits are approximately two orders of magnitude more restrictive than limits obtained at the Tevatron without form factors [5].
9 Summary
JHEP07(2013)116
In a region sensitive to SM γγ → W+W− production with p
T(µ±e∓) > 30 GeV, two events are observed, with a background expectation of 0.84±0.15. The signal expec-tation is 2.2±0.4 events, with the uncertainty on the theory reflecting the uncertainty on the proton dissociation contribution. The significance of the signal is∼1σ, with a 95% CL upper limit on the SM cross section of 10.6 fb.
In the region with pT(µ±e∓)>100 GeV, where the SM contribution is expected to be small, no events are observed. A limit is set on the partial cross section times branching fraction within the acceptance of pT(µ,e)>20 GeV,|η(µ,e)|<2.4, pT(µ±e∓) >100 GeV at 95% CL:
σ(pp→p(∗)W+W−p(∗)→p(∗)µ±e∓p(∗))<1.9 fb.
We use this subsample to set limits on the anomalous quartic gauge coupling parame-ters, which results in values of the order of 1.5×10⁻⁴GeV−2 foraW
0 /Λ2and 5×10⁻⁴GeV−2 foraWC/Λ2, assuming a dipole form factor with the energy cutoff scale at Λcutoff = 500 GeV. These limits are approximately 20 times more stringent than the best limits obtained at the Tevatron, and approximately two orders of magnitude more stringent than the best limits obtained at LEP. With no form factors, the limits on the anomalous quartic gauge coupling parameters would be of order 10−5GeV−2 and below, driven by high-energy γγ interactions beyond the unitarity bound.
Acknowledgments
JHEP07(2013)116
Research Foundation, and National Office for Research and Technology, Hungary; the De-partment of Atomic Energy and the DeDe-partment of Science and Technology, India; the In-stitute for Studies in Theoretical Physics and Mathematics, Iran; the Science Foundation, Ireland; the Istituto Nazionale di Fisica Nucleare, Italy; the Korean Ministry of Education, Science and Technology and the World Class University program of NRF, Republic of Ko-rea; the Lithuanian Academy of Sciences; the Mexican Funding Agencies (CINVESTAV, CONACYT, SEP, and UASLP-FAI); the Ministry of Science and Innovation, New Zealand; the Pakistan Atomic Energy Commission; the Ministry of Science and Higher Education and the National Science Centre, Poland; the Funda¸c˜ao para a Ciˆencia e a Tecnologia, Por-tugal; JINR (Armenia, Belarus, Georgia, Ukraine, Uzbekistan); the Ministry of Education and Science of the Russian Federation, the Federal Agency of Atomic Energy of the Russian Federation, Russian Academy of Sciences, and the Russian Foundation for Basic Research; the Ministry of Science and Technological Development of Serbia; the Secretar´ıa de Estado de Investigaci´on, Desarrollo e Innovaci´on and Programa Consolider-Ingenio 2010, Spain; the Swiss Funding Agencies (ETH Board, ETH Zurich, PSI, SNF, UniZH, Canton Zurich, and SER); the National Science Council, Taipei; the Thailand Center of Excellence in Physics, the Institute for the Promotion of Teaching Science and Technology of Thailand and the National Science and Technology Development Agency of Thailand; the Scientific and Technical Research Council of Turkey, and Turkish Atomic Energy Authority; the Science and Technology Facilities Council, UK; the US Department of Energy, and the US National Science Foundation.
Individuals have received support from the Marie-Curie programme and the Euro-pean Research Council and EPLANET (EuroEuro-pean Union); the Leventis Foundation; the A. P. Sloan Foundation; the Alexander von Humboldt Foundation; the Belgian Federal Science Policy Office; the Fonds pour la Formation `a la Recherche dans l’Industrie et dans l’Agriculture (FRIA-Belgium); the Agentschap voor Innovatie door Wetenschap en Tech-nologie (IWT-Belgium); the Ministry of Education, Youth and Sports (MEYS) of Czech Republic; the Council of Science and Industrial Research, India; the Compagnia di San Paolo (Torino); the HOMING PLUS programme of Foundation for Polish Science, co-financed by EU, Regional Development Fund; and the Thalis and Aristeia programmes cofinanced by EU-ESF and the Greek NSRF.
Open Access. This article is distributed under the terms of the Creative Commons Attribution License which permits any use, distribution and reproduction in any medium, provided the original author(s) and source are credited.
References
[1] D. d’Enterria, M. Klasen and K. Piotrzkowski,Photon-LHC-2008. Proceedings of the
International Workshop on High-energy Photon Collisions at the LHC,Nucl. Phys. Proc.
Suppl 179-180(2008).
JHEP07(2013)116
[3] T. Pierzchala and K. Piotrzkowski,Sensitivity to anomalous quartic gauge couplings inphoton-photon interactions at the LHC,Nucl. Phys. Proc. Suppl.179-180 (2008) 257
[arXiv:0807.1121] [INSPIRE].
[4] E. Chapon, C. Royon and O. Kepka,Anomalous quartic W W γγ, ZZγγ and trilinearW W γ
couplings in two-photon processes at high luminosity at the LHC,Phys. Rev.D 81(2010)
074003[arXiv:0912.5161] [INSPIRE].
[5] D0collaboration, V.M. Abazov et al., Search for anomalous quarticW W γγ couplings in
dielectron and missing energy final states in ppbar collisions at√s= 1.96 TeV,
arXiv:1305.1258[INSPIRE].
[6] G. B´elanger, F. Boudjema, Y. Kurihara, D. Perret-Gallix and A. Semenov,Bosonic quartic
couplings at LEP-2,Eur. Phys. J.C 13(2000) 283[hep-ph/9908254] [INSPIRE].
[7] ALEPHcollaboration, A. Heister et al.,Constraints on anomalous QGC’s in e+e−
interactions from183GeV to 209GeV,Phys. Lett.B 602(2004) 31 [INSPIRE].
[8] OPALcollaboration, G. Abbiendi et al.,Constraints on anomalous quartic gauge boson
couplings fromννγγ¯ andqqγγ¯ events at LEP-2,Phys. Rev.D 70(2004) 032005
[hep-ex/0402021] [INSPIRE].
[9] OPALcollaboration, G. Abbiendi et al.,A Study of W+W−γ events at LEP,Phys. Lett.B
580(2004) 17 [hep-ex/0309013] [INSPIRE].
[10] OPALcollaboration, G. Abbiendi et al.,Measurement of theW+W−γ cross-section and
first direct limits on anomalous electroweak quartic gauge couplings, Phys. Lett.B 471
(1999) 293[hep-ex/9910069] [INSPIRE].
[11] L3collaboration, P. Achard et al.,The e+e−→Zγγ→qqγγ¯ reaction at LEP and
constraints on anomalous quartic gauge boson couplings,Phys. Lett.B 540(2002) 43
[hep-ex/0206050] [INSPIRE].
[12] L3collaboration, P. Achard et al.,Study of theW+W−γprocess and limits on anomalous
quartic gauge boson couplings at LEP,Phys. Lett.B 527(2002) 29 [hep-ex/0111029]
[INSPIRE].
[13] DELPHIcollaboration, J. Abdallah et al.,Measurement of thee+e−→W+W−γ
cross-section and limits on anomalous quartic gauge couplings with DELPHI,Eur. Phys. J.
C 31(2003) 139[hep-ex/0311004] [INSPIRE].
[14] CMScollaboration, Exclusive photon-photon production of muon pairs in proton-proton
collisions at√s= 7 TeV,JHEP 01(2012) 052[arXiv:1111.5536] [INSPIRE].
[15] CMScollaboration, Search for exclusive or semi-exclusive photon pair production and
observation of exclusive and semi-exclusive electron pair production inpp collisions at
√
s= 7 TeV, JHEP 11(2012) 080[arXiv:1209.1666] [INSPIRE].
[16] G. B´elanger and F. Boudjema,Probing quartic couplings of weak bosons through three vectors
production at a500GeV NLC,Phys. Lett.B 288(1992) 201[INSPIRE].
[17] CMScollaboration, The CMS experiment at the CERN LHC,2008JINST 3S08004
[INSPIRE].
[18] S.L. Glashow,Partial symmetries of weak interactions, Nucl. Phys.22(1961) 579.
[19] S. Weinberg, A model of leptons,Phys. Rev. Lett.19(1967) 1264[INSPIRE].
[20] A. Salam,Weak and electromagnetic interactions, inElementary particle physics: relativistic
JHEP07(2013)116
[21] D0collaboration, B. Abbott et al.,Studies ofW W andW Z production and limits onanomalousW W γ andW W Z couplings,Phys. Rev.D 60(1999) 072002 [hep-ex/9905005]
[INSPIRE].
[22] D0collaboration, V. Abazov et al.,Limits on anomalous trilinear gauge couplings from
W W →e+e−,W W →e±µ∓ andW W →µ+µ− events from pp¯collisions at√s= 1.96TeV,
Phys. Rev.D 74(2006) 057101 [Erratum ibid.D 74 (2006) 059904] [hep-ex/0608011]
[INSPIRE].
[23] A. Pukhov,CalcHEP 2.3: MSSM, structure functions, event generation, batchs and
generation of matrix elements for other packages,hep-ph/0412191[INSPIRE].
[24] T. Sj¨ostrand, S. Mrenna and P.Z. Skands,PYTHIA 6.4 physics and manual,JHEP 05 (2006) 026[hep-ph/0603175] [INSPIRE].
[25] J. Alwall, M. Herquet, F. Maltoni, O. Mattelaer and T. Stelzer,MadGraph 5: going beyond,
JHEP 06 (2011) 128[arXiv:1106.0522] [INSPIRE].
[26] P. Nason,A new method for combining NLO QCD with shower Monte Carlo algorithms,
JHEP 11 (2004) 040[hep-ph/0409146] [INSPIRE].
[27] S. Frixione, P. Nason and C. Oleari, Matching NLO QCD computations with Parton Shower
simulations: the POWHEG method,JHEP 11 (2007) 070[arXiv:0709.2092] [INSPIRE].
[28] S. Alioli, P. Nason, C. Oleari and E. Re,A general framework for implementing NLO
calculations in shower Monte Carlo programs: the POWHEG BOX,JHEP 06 (2010) 043
[arXiv:1002.2581] [INSPIRE].
[29] S. Jadach, Z. Was, R. Decker and J.H. Kuhn,Theτ decay library TAUOLA: version 2.4,
Comput. Phys. Commun.76(1993) 361[INSPIRE].
[30] CMScollaboration,Measurement of theW+W− cross section in ppcollisions at√s= 7TeV
and limits on anomalousW W γ andW W Z couplings,arXiv:1306.1126[INSPIRE].
[31] J.M. Campbell and R. Ellis,MCFM for the Tevatron and the LHC,Nucl. Phys. Proc. Suppl.
205-206(2010) 10[arXiv:1007.3492] [INSPIRE].
[32] CMScollaboration, Measurement ofW+W− production and search for the Higgs boson in
ppcollisions at√s= 7TeV,Phys. Lett.B 699(2011) 25[arXiv:1102.5429] [INSPIRE].
[33] ATLAScollaboration,Measurement ofW+W− production in ppcollisions at√s= 7TeV
with the ATLAS detector and limits on anomalousW W Z andW W γ couplings,Phys. Rev.
D 87(2013) 112001[arXiv:1210.2979] [INSPIRE].
[34] R. Field,Min-bias and the underlying event at the LHC,Acta Phys. Polon.B 42 (2011) 2631[arXiv:1110.5530] [INSPIRE].
[35] P. Bruni and G. Ingelman,Diffractive hard scattering at ep andpp¯colliders, in the
proceedings of theInternational Europhysics Conference on High-energy Physics, July 22–28, Marseille, France (1994).
[36] J.A.M. Vermaseren, Two photon processes at very high-energies,Nucl. Phys.B 229(1983) 347[INSPIRE].
[37] S.P. Baranov et al.,LPAIR: a generator for lepton pair production, in the proccedings of
Physics at HERA, October 29–30, Hamburg, Germany (1991).
[38] P. Lebiedowicz, R. Pasechnik and A. Szczurek, QCD diffractive mechanism of exclusive
W+W− pair production at high energies,Nucl. Phys.B 867(2013) 61 [arXiv:1203.1832]
[INSPIRE].
[39] K. Arnold et al.,VBFNLO: a parton level Monte Carlo for processes with electroweak bosons
JHEP07(2013)116
[40] GEANT4collaboration, S. Agostinelli et al.,GEANT4: a simulation toolkit,Nucl. Instrum.Meth.A 506 (2003) 250[INSPIRE].
[41] CMS collaboration, Electron reconstruction and identification at√s= 7TeV, CMS-PAS-EGM-10-004(2010).
[42] CMS collaboration, Particle-flow event reconstruction in CMS and performance for jets, taus
and MET,CMS-PAS-PFT-09-001(2009).
[43] L. Harland-Lang, V. Khoze, M. Ryskin and W. Stirling, The phenomenology of central
exclusive production at hadron colliders,Eur. Phys. J.C 72(2012) 2110 [arXiv:1204.4803]
[INSPIRE].
[44] V. Goncalves and M. Machado, Diffractive photoproduction ofZ0 bosons in coherent
interactions at CERN-LHC,Eur. Phys. J.C 56(2008) 33 [Erratum ibid. C 61(2009) 351]
[arXiv:0710.4287] [INSPIRE].
[45] L. Motyka and G. Watt,Exclusive photoproduction at the Tevatron and CERN LHC within
the dipole picture,Phys. Rev.D 78(2008) 014023 [arXiv:0805.2113] [INSPIRE].
[46] A. Cisek, W. Schafer and A. Szczurek,Production ofZ0 bosons with rapidity gaps: exclusive
photoproduction inγpandpp collisions and inclusive double diffractive Z0’s,Phys. Rev.D
80(2009) 074013[arXiv:0906.1739] [INSPIRE].
[47] V. Budnev, I. Ginzburg, G. Meledin and V. Serbo,The two photon particle production
mechanism. Physical problems. Applications. Equivalent photon approximation,Phys. Rept.
15(1975) 181[INSPIRE].
[48] Particle Data Groupcollaboration, J. Beringer et al.,Review of particle physics,Phys.
Rev.D 86(2012) 010001[INSPIRE].
[49] CMS collaboration, Absolute calibration of the luminosity measurement at CMS: winter 2012
update,CMS-PAS-SMP-12-008(2012).
[50] CMS collaboration, Tracking and primary vertex results in first 7 TeV collisions, CMS-PAS-TRK-10-005(2010).
[51] CMScollaboration, Search for neutral Higgs bosons decaying toτ pairs inpp collisions at √
s= 7 TeV, Phys. Lett.B 713(2012) 68 [arXiv:1202.4083] [INSPIRE].
[52] G.J. Feldman and R.D. Cousins,A Unified approach to the classical statistical analysis of
small signals,Phys. Rev.D 57(1998) 3873[physics/9711021] [INSPIRE].
[53] R.D. Cousins and V.L. Highland, Incorporating systematic uncertainties into an upper limit,
Nucl. Instrum. Meth.A 320(1992) 331[INSPIRE].
[54] A.L. Read,Presentation of search results: the CL(s) technique,J. Phys. G 28(2002) 2693 [INSPIRE].
[55] R. Rahmat, R. Kroeger and A. Giammanco,The fast simulation of the CMS experiment,J.