Fingerprint Gender Classification using Univariate
Decision Tree (J48)
S. F. Abdullah
Optimization, Modelling, Analysis, Simulation and Scheduling (OptiMASS) Research Group
Universiti Teknikal Malaysia Melaka 76100 Durian Tunggal, Melaka, Malaysia
A.F.N.A. Rahman
Optimization, Modelling, Analysis, Simulation and Scheduling (OptiMASS) Research Group
Universiti Teknikal Malaysia Melaka 76100 Durian Tunggal, Melaka, Malaysia
Z.A. Abas
Optimization, Modelling, Analysis, Simulation and Scheduling (OptiMASS) Research Group
Universiti Teknikal Malaysia Melaka 76100 Durian Tunggal, Melaka, Malaysia
W.H.M. Saad
Faculty of Electronic and Computer Engineering Universiti Teknikal Malaysia Melaka
76100 Durian Tunggal, Melaka, Malaysia
Abstract—Data mining is the process of analyzing data from a different category. This data provide information and data mining will extracts a new knowledge from it and a new useful information is created. Decision tree learning is a method commonly used in data mining. The decision tree is a model of decision that looklike as a tree-like graph with nodes, branches and leaves. Each internal node denotes a test on an attribute and each branch represents the outcome of the test. The leaf node which is the last node will holds a class label. Decision tree classifies the instance and helps in making a prediction of the data used. This study focused on a J48 algorithm for classifying a gender by using fingerprint features. There are four types of features in the fingerprint that is used in this study, which is Ridge Count (RC), Ridge Density (RD), Ridge Thickness to Valley Thickness Ratio (RTVTR) and White Lines Count (WLC). Different cases have been determined to be executed with the J48 algorithm and a comparison of the knowledge gain from each test is shown. All the result of this experiment is running using Weka and the result achieve 96.28% for the classification rate.
Keywords—fingerprint; gender classification; global features; Univariate Decision Tree; J48
I. INTRODUCTION
A decision tree is a graph that uses a branching method to illustrate every possible outcome of the decision. A decision tree consists decision nodes and leaf nodes, where the decision node specifies a test over one attribute and a leaf node represent the class value [1]. A decision tree is a most powerful approach in knowledge discovery and data mining [2]. It is a non-parametric supervised learning method which is used to learn a classification function. It creates a model that predicts the value of the target variables by learning a simple decision rule from the data features.
Decision tree always be used with a complex bulk of data to enable a knowledge extraction in order to discover a useful pattern [2]. There are two approaches for decision tree [3] which is a univariate decision tree and multivariate decision
tree. The univariate decision tree is a decision node which considers only one feature that leads to the axis splits while the multivariate decision tree is a decision nodes that divide the input space into two widths an arbitrary hyperplane and leading to an oblique splits [4]. A J48 algorithm is an extension of an ID3 algorithm which is also from the univariate decision trees. For this study, the J48 algorithm has been used a proposed technique as it has more accuracy rate [5] compared to the available univariate decision tree.
Since 2006 until now, researchers keep finding the best classifier for gender classification problem. But until today there is no implementation of decision tree in gender classification based on the fingerprint. Badawi et al. [6] used three different types of classifier which are Neural Network (NN), Fuzzy C-Means (FCM) and Linear Discriminat Analysis (LDA) as a classifier for gender classification using the fingerprint. From his study, all three classifiers achieved above 80% of classification rate and the best classifier are NN with 88.5% of classification rate.
Verma et al. [7] used Support Vector Machine (SVM) as a classifier for fingerprint-based gender classification problem. SVM is used to separate the two classes of gender, which is male and female. From the study, SVM is able to get 88.00% of classification rate.
In the year of 2011, Arun et al. [8] used SVM to classify gender and they achieved 96.00% of classification rate using Radial Basis Function (RBF) kernel SVM. Early 2012, Gananasivam et al. [9] applied k-Nearest Neighbors (kNN) on the same problem and they achieved 88.28% of classification rate at k=1.
81.00% of classification rate which is lower than Verma et al. [7] and Arun et. al [8] even though they are applied the same classifier for the same problem.
Abdullah et. al. [12][13] used several popular classifier for classification such as Multilayer Perceptron Neural Network (MLPNN), Support Vector Machine (SVM), Bayes Net and k-Nearest Neighbor (kNN) in classifying gender using the fingerprint features. They achieved above 95% of overall classification rate using 10-fold cross validation test. But in the study, there is a problem with MLPNN and kNN which is the popular overfitting problem. In order to overcome this problem, the number of features needs to reduce or needs to do the feature selection process before the classification part.
All the literature studies is shown in Table 1 below. From that, we can conclude that until now there is still a problem in the gender classification problem especially in terms of the accuracy rate. Thus, this study aims to see the performance of the J48 algorithm on fingerprint-based gender classification where J48 is commonly used in classification problem for the univariate decision trees. The performance of the J48 is compared with three different test cases, whereby each test case has a different number of fingerprint features selected.
TABLE I. PREVIOUS STUDIES ON FINGERPRINT BASED GENDER CLASSIFICATION
Classifier Accuracy
Badawi et. al.[6]
Neural Network (NN) Fuzzy C-Means (FCM) Linear Discriminant Analysis (LDA)
80.39% 86.50% 88.50%
Verma et. al.[7] Support Vector Machine (SVM) 88.00% Arun et. al.[8] Support Vector Machine (SVM) 96.00% Gnanasivam et al.
[9] k-Nearest Neighbor (kNN) 88.28%
Gupta et. al. [10] Back Propagation Neural
Network 91.45%
Agrawal et. al. [11] Support Vector Machine (SVM) 81.00% Abdullah et. al.
[12]
Multilayer Perceptron Neural
Network (MLPNN) 97.25%
Abdullah et. al. [13]
Support Vector Machine (SVM) Bayes Net
k-Nearest Neighbor (kNN) Multilayer Perceptron Neural Network (MLPNN)
96.62%
96.28% 95.27%
95.95%
The paper is organized as follows. Section II presents the methodology that has been done in this study, while the result analysis and discussion in Section III. Lastly, Section IV present the conclusion and future work.
II. METHODOLOGY
The sample of this study consist of four extracted features of 296 respondent which is Ridge Count (RC), Ridge Density (RD), Ridge Thickness to Valley Thickness Ratio (RTVTR) and White Lines Count (WLC). The database of the extracted fingerprint features are obtained from Abdullah et.al. [14]. The process of classification is done using Weka programme with a 10-fold cross validation test. All features are arrange as shown
in Figure 1 and save as a Comma Deliminated (CSV) file format.
Fig. 1. The extracted features arrange in the database format
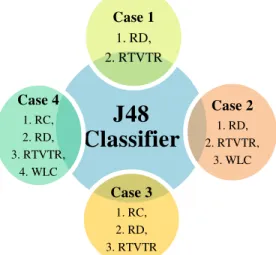
The four extracted features are save intofour different files. The first file contain two types of fingerprint features which are Ridge Density (RD) and Ridge Thickness to Valley Thickness Ratio (RTVTR), the second file contains of three types of fingerprint features, which are Ridge Density (RD), Ridge Thickness to Valley Thickness Ratio (RTVTR) and White Lines Count (WLC). The third files contains of three types of fingerprint features, which are Ridge Density (RD), Ridge Thickness to Valley Thickness Ratio (RTVTR) and Ridge Count (RC) and the last file contain of all the features which are Ridge Count (RC), Ridge Density (RD), Ridge Thickness to Valley Thickness Ratio (RTVTR) and White Line Count (WLC). All these files are used to evaluate the performance of J48 algorithm in term of number of features involved in a test as shown in Figure 2. The result of this study is shown in a form of accuracy and decision tree.
Fig. 2. Different number of features used in J48 Classifier Test Case
III. RESULT AND DISCUSSION
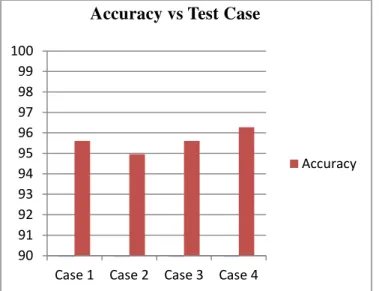
The result of each test case is given in Table II and the result is illustrated in a bar chart as shown in Figure 3. It can be seen that Test Case 3 gives a higher classification rate, which is
J48
Classifier
Case 41. RC, 2. RD, 3. RTVTR,
4. WLC
Case 3 1. RC, 2. RD, 3. RTVTR
Case 1
1. RD, 2. RTVTR
Case 2 1. RD, 2. RTVTR,
96.28% compared to Test Case 1,Test Case 2 and Test Case 3. The accuracy of Test Case 2 is 94.96%, which are the lowest classification rate for these 4 test cases. Each test case gives slightly different results in accuracy.
TABLE II. ACCURACY OF DIFFERENT TEST CASE
Features Used Accuracy
Case 1 RD & RTVTR 95.61%
Case 2 RD, RTVTR & WLC 94.96%
Case 3 RD, RTVTR & RC 95.61%
Case 4 RC,RD,RTVTR & WLC 96.28%
The accuracy of each case shown that there is slightly different of accuracy for each test case. As the higher number of features involved in a test case, the higher accuracy we get. But, there is a problem of Test Case 2, where 3 features involved in this test case give lower accuracy compared to the Test Case 1 which only involved two features. This is due to the additional features in Test Case 2, where White Lines Count (WLC) gives an impact to the classification rate. From this result, we can say that WLC are not reliable or suitable to be a feature for classifying gender of a person and this is proved by seeing the accuracy of the Test Case 3 which is Test Case 3 also involved 3 features which is Ridge Density (RD), Ridge Thickness to Valley Thickness Ratio (RTVTR) and Ridge Count (RC) gives a better accuracy compared to the Test Case 2. The other features like RD, RTVTR and RC is a good feature of this problem and this is supported by the T-test of each feature. t-Test is used to examine whether the fingerprint features of two classes which is male and female is statistically differ.
Fig. 3. Accuracy of different test case
Table III shows the result of the t-Test of the means of the four features which are RD, RTVTR, RC and WLC. It is shown that the female had a statistically significantly higher number of RD (0.654 ± 0.002 mm2), RTVTR (0.811 ± 0.034) and RC (16.34 ±1.242 per 25mm2) compared to a male which lower numbers of RD (0.470 ± 0.002 mm2), RTVTR (0.537 ± 0.008) and RC (11.71 ±1.346 per 25mm2). As we can see from Table III, the value of the variance of female for the White
Lines Count (WLC) is higher than the variance for male. We decided that the WLC feature is not to be include as a reliable feature for the gender classification in this work.
Table IV shows the number of respondents in term of correct classification, misclassification and the confusion matrix. For the Test Case 1, it is shown that 283 of 296 respondents are correctly classified as a male and as a female while another 13 of that are incorrectly classified. While for Test Case 2, it is shown that 285 respondents are correctly classified as a male and as a female. For Test case 3, 281 of 296 respondents are correctly classified as a male and as a female, while another 15 respondents are incorrectly classified as male and female. As we can see from the confusion matrix of test case 3, from 15 respondents who are incorrectly classified, nine of them are actually a female and six of them are males.
TABLE III. T-TEST OF THE MEANS OF THE FOUR FEATURES
Feature Female Male
Ridge Density (RD)
Mean 0.654 Mean 0.470
Variance 0.002 Variance 0.002
P(T<=t) one-tail 8.3864E-102
t Critical one-tail 1.650255746
P(T<=t) two-tail 1.6773E-101
t Critical two-tail 1.968381923
Ridge Thickness to Valley Thickness Ratio (RTVTR)
Mean 0.811 Mean 0.537
Variance 0.034 Variance 0.008
P(T<=t) one-tail 3.64613E-41 t Critical one-tail 1.651564228 P(T<=t) two-tail 7.29225E-41 t Critical two-tail 1.970423195
Ridge Count (RC)
Mean 16.34 Mean 11.71
Variance 1.242 Variance 1.346
P(T<=t) one-tail 5.496E-106 t Critical one-tail 1.650161656 P(T<=t) two-tail 1.0992E-105 t Critical two-tail 1.968235174
White Lines Count (WLC)
Mean 17.38 Mean 11.18
Variance 5.099 Variance 2.138
P(T<=t) one-tail 7.36677E-83 t Critical one-tail 1.650559157 P(T<=t) two-tail 1.47335E-82 t Critical two-tail 1.968855173 90
91 92 93 94 95 96 97 98 99 100
Case 1 Case 2 Case 3 Case 4
Accuracy vs Test Case
TABLE IV. NUMBER OF CORRECT CLASSIFICATION,MIS-CLASSIFICATION AND CONFUSION MATRIX FOR EACH DIFFERENT TEST CASE
Correct Classification
Mis-Classification Confusion Matrix
Case 1 283 13
M F --- 150 6 | M 7 133 | F
Case 2 285 11
M F --- 151 5 | M 6 134 | F
Case 3 283 13
M F --- 150 6 | M 7 133 | F
Case 4 281 15
M F --- 147 9 | M 6 134 | F
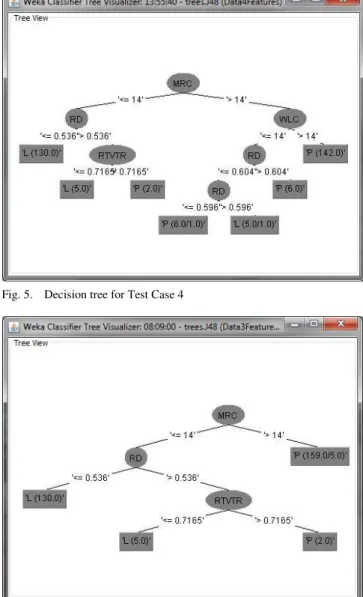
Figure 4, Figure 5, Figure 6 and Figure 7 shows the tree visualization of the univariate decision tree generated by WEKA for each test cases. For Test Case 1, the total number of leaves in the generated tree is four and the size of the tree is seven.
For Test Case 2, the total number of leaves in the generated tree are nine and the size of the tree is 17. For Test Case 3, the total number of leaves in the generated tree are four and the size of the tree is 7 while for Test Case 4, the total number of leaves in the generated tree are seven and the size of the tree is 13. The number of leaves in the generated tree and size of tree from Test Case 2 is higher than Test Case 3, Test 4 and Test Case 1.
The decision tree has many benefits to classification process, where it can handle a variety input data which is nominal, numeric and text data. Decision tree also is able to handle effectively the missing values and had a high performance when tested with a small number of efforts. On the other hand, the J48 algorithm is still having a problem where it will slows down the process of generate a tree especially if the data sets used are large and not clean.
Fig. 4. Decision tree for Test Case 1
Fig. 5. Decision tree for Test Case 4
Fig. 6. Decision tree for Test Case 3
IV. CONCLUSION
In conclusion, this paper used J48 decision tree in fingerprint gender classification problem, and the accuracy of the approach is approximately 96.28% for the four fingerprint features used. Using WEKA tool, the decision tree is generated and we got the higher correctly classified male and female which is 285 from 296 respondents. In this study, we can state that we can use J48 decision tree as a classifier for fingerprint based gender classification.
ACKNOWLEDGMENT
We would like to thank Optimization, Modelling, Analysis, Simulation and Scheduling (OptiMASS) Research Lab for the supporting given throughout the research activities and the Centre of Research and Innovation Management (CRIM), Universiti Teknikal Malaysia Melaka (UTeM) for the financial support.
REFERENCES
[1] Sahu, Shailendra, and B. M. Mehtre. "Network intrusion detection system using j48 decision tree." In Advances in Computing, Communications and Informatics (ICACCI), 2015 International Conference on, pp. 2023-2026. IEEE, 2015.
[2] Bhargava, Neeraj, Girja Sharma, Ritu Bhargava, and Manish Mathuria. "Decision tree analysis on j48 algorithm for data mining." Proceedings of International Journal of Advanced Research in Computer Science and Software Engineering 3, no. 6 (2013).
[3] Korting, Thales Sehn. "C4. 5 algorithm and multivariate decision trees." Image Processing Division, National Institute for Space Research–INPE Sao Jose dos Campos–SP, Brazil (2006).
[4] Yıldız, Olcay Taner, and Ethem Alpaydın. "Comparing Univariate and Multivariate Decision Trees."
[5] Jain, Yogendra Kumar. "Upendra: An efficient intrusion detection based on decision tree classifier using feature reduction." International Journal of Scientific and Research Publication 2, no. 1 (2012).
[6] Badawi, Ahmed M., Mohamed Mahfouz, Rimon Tadross, and Richard Jantz. "Fingerprint-Based Gender Classification." In IPCV, pp. 41-46. 2006.
[7] Verma, Manish, and Suneeta Agarwal. "Fingerprint based male-female classification." In Proceedings of the International Workshop on Computational Intelligence in Security for Information Systems CISIS’08, pp. 251-257. Springer Berlin Heidelberg, 2009.
[8] Arun, K. S., and K. S. Sarath. "A machine learning approach for fingerprint based gender identification." In Recent Advances in Intelligent Computational Systems (RAICS), 2011 IEEE, pp. 163-167. IEEE, 2011.
[9] Gnanasivam, P., and Dr S. Muttan. "Estimation of age through fingerprints using wavelet transform and singular value decomposition." International Journal of Biometrics and Bioinformatics (IJBB) 6, no. 2 (2012): 58-67.
[10] Gupta, Samta, and A. Prabhakar Rao. "Fingerprint based gender classification using discrete wavelet transform & artificial neural network." International Journal of Computer Science and mobile computing 3, no. 4 (2014): 1289-1296.
[11] Agrawal, Heena, and Siddhartha Choubey. "Fingerprint Based Gender Classification using multi-class SVM."
[12] Abdullah, S. F., A. F. N. A. Rahman, Z. A. Abas, and W. H. M. Saad. "Multilayer Perceptron Neural Network in Classifying Gender using Fingerprint Global Level Features." Indian Journal of Science and Technology 9, no. 9 (2016).
[13] Abdullah, S. F., A. F. N. A. Rahman, Z. A. Abas, and W. H. M. Saad. "Support Vector Machine, Multilayer Perceptron Neural Network, Bayes Net and k-Nearest Neighbor in Classifying Gender using Fingerprint Features" International Journal of Computer Science and Information Security (IJCSIS), 14 (7), 2016.