RAPHAEL HERMANO SANTOS DINIZ
OTIMIZAÇÃO DO PROCESSO FERMENTATIVO E ANÁLISE DO SECRETOMA DEKluyveromyces marxianus UFV-3 EM MEIOS
CONTENDO LACTOSE EM DIFERENTES CONDIÇÕES DE CULTIVO
VIÇOSA
MINAS GERAIS - BRASIL 2013
Ficha catalográfica preparada pela Seção de Catalogação e Classificação da Biblioteca Central da UFV
T
Diniz, Raphael Hermano Santos, 1983-
D585o Otimização do processo fermentativo e análise do secretoma 2013 de Kluyveromyces marxianus UFV-3 em meios contendo
lactose em diferentes condições de cultivo / Raphael Hermano Santos Diniz. – Viçosa, MG, 2013.
xiii, 51f. : il. ; 29cm.
Texto em português e inglês.
Orientador: Flávia Maria Lopes Passos
Tese (doutorado) - Universidade Federal de Viçosa. Inclui bibliografia.
1. Kluyveromyces marxianus. 2. Etanol. 3. Soro de queijo. 4. Proteínas microbianas. 5. Enzimas microbianas.
6. Espectrometria de massa. I. Universidade Federal de Viçosa. Departamento de Microbiologia. Programa de Pós-Graduação
em Microbiologia Agrícola. II. Título.
RAPHAEL HERMANO SANTOS DINIZ
OTIMIZAÇÃO DO PROCESSO FERMENTATIVO E ANÁLISE DO SECRETOMA DEKluyveromyces marxianus UFV-3 EM MEIOS CONTENDO LACTOSE EM DIFERENTES CONDIÇÕES DE CULTIVO
APROVADA: 15 de março de 2013.
___________________________ __________________________ Prof. Luciano Gomes Fietto Prof. Agenor Valadares Santos (Coorientador)
__________________________ __________________________ Prof. Cléberson Ribeiro Prof. Antônio Galvão do Nascimento
______________________________ Prof. Wendel Batista da Silveira
(Presidente da Banca)
AGRADECIMENTOS
Àquele(s) que tece(m) o tecido do destino.
À Universidade Federal de Viçosa e ao Departamento de Microbiologia, pela oportunidade de realização do curso.
Ao Conselho Nacional de Desenvolvimento Científico e Tecnológico (CNPq) pelo apoio financeiro durante boa parte do doutorado, à Coordenação de Aperfeiçoamento de Pessoal de Nível Superior (CAPES), pelo apoio financeiro durante o início do doutorado e pela bolsa no Programa Institucional de Bolsas de Doutorado Sanduíche no Exterior (PDSE).
À Profa Flávia Maria Lopes Passos, pela orientação e por ter acreditado em mim desde os idos de 2003.
À María Isabel González Siso pela orientação na Espanha por ter me auxiliado em todas as dificuldades e pela atenção em todos os detalhes de nosso projeto além da honra de ter permitido que eu fizesse parte de seu grupo de pesquisa.
Ao Prof. Luciano Gomes Fietto pela total presteza e disponibilidade durante este projeto.
Ao Prof. Wendel Batista da Silveira pelo auxílio em todos os passos deste projeto desde à elaboração até as correções finais, além da amizade.
Ao Prof. Agenor Valadares Santos pelo auxílio durante os períodos críticos na Espanha principalmente com relação ao secretoma além da disponibilidade de participação na banca além da amizade e das diversas conversas por telefone e Skype.
Ao professor Humberto Ramos pelo auxílio na análise de dados do secretoma.
A todos os professores do departamento de Bioloxía Celular e Molecular da Universidade Da Coruña pela ajuda em todos os pontos do projeto em especial: Profª María Esperanza Cerdán Villanueva, Prof. Manuel Becerra, Profª Mónica Lamas, Profª Esther Belmonte e estudantes do laboratório Angel, Olalla, Augustín e María.
Aos amigos que fiz na España tanto na RESA quanto fora, pela hospitalidade espanhola e um agradecimento especial aos amigos latino-americanos que muito me ensinaram sobre a grandeza de nosso continente. Aos estudantes, pesquisadores e professores do Departamento de Microbiologia Agrícola que muito contribuíram para a realização deste trabalho.
À todos do Laboratório de Fisiologia de Micro-organismos: Júlio, Lygia, Valdilene, Priscila, Otávio, Lívia, Caio Kamila, Róbson e tantos outros...
Agradecimento especial à Fernanda Godoy pelos ensinamentos sobre sociabilidade, pelas conversas aleatórias e reflexões sobre a vida além de me apresentar o maravilhoso mundo dos vinhos, à professora Mírian pela amizade e agradáveis conversas sobre a vida, à professora Denise pela ajuda em diversos passos deste trabalho, pela orientação e amizade.
A todos os funcionários do Departamento de Microbiologia Agrícola pela disponibilidade e pelos diversos serviços realizados: Nilcéa, José Carlos, Evandro, Danilo, “Seu” Paulo e Pablo.
Aos amigos que fiz e perdi no decorrer destes 30 anos em Mateus Leme, Azurita, Itaúna e principalmente de Divinópolis, Viçosa e Pará de Minas.
BIOGRAFIA
RAPHAEL HERMANO SANTOS DINIZ, filho de Luiza Maria Conceição Santos Diniz e José Araújo Diniz, nasceu em 09 de março de 1983. Em 1988 começa sua vida escolar no Colégio Sant’Anna em Itaúna de onde se despede em 1997. Em 1998 ingressa no CEFET-MG/Divinópolis vindo a concluir o ensino médio em 2000.
Em março de 2002 ingressa na Universidade Federal de Viçosa, vindo a se graduar em Licenciatura em Ciências Biológicas em março de 2007.
Em março de 2007 inicia o curso de Mestrado em Microbiologia Agrícola, na Universidade Federal de Viçosa, submetendo-se à defesa de dissertação em 17 de fevereiro de 2009.
SUMÁRIO
Página
RESUMO ... x
ABSTRACT ... xii
INTRODUÇÃO ... 1
REFERÊNCIAS BIBLIOGRÁFICAS ... 4
ARTIGO 1 – Optimizing and validating the production of ethanol from cheese whey permeated by Kluyveromyces marxianus UFV-3 ... 6
1. ABSTRACT ... 6
2. INTRODUCTION ... 8
3. MATERIALS AND METHODS ... 10
3.1. Yeast strain and maintenance ... 10
Página
3.3. Fermentation conditions ... 11
3.4. Cell growth and the relationship between absorbance at 600 nm (A600) and dry cell biomass concentration (g L-1) ... 11
3.5. Primary metabolite analysis ... 11
3.6. Determining fermentation parameters ... 12
3.7. Experimental design and validation of methods ... 12
4. RESULTS AND DISCUSSION ... 15
5. CONCLUSION ... 25
6. REFERENCES ... 26
ARTIGO 2 – Effect of cultivation methods on Kluyveromyces marxianus UFV-3 protein secretion and biotechnological applications ... 28
1. ABSTRACT ... 28
2. INTRODUCTION ... 30
3. MATERIALS AND METHODS ... 32
3.1. Yeast strain and maintenance ... 32
3.2. Growth conditions ... 32
3.3. Protein concentration and SDS-PAGE ... 33
3.4. NanoLC–MALDI-TOF/TOF ... 34
Página
3.6. Endopolygalacturonase enzymatic assay ... 35
3.7. Experimental design of response surface methodology on endopolygalacturonase activity ... 36
4. RESULTS ... 37
4.1. Influence of growth conditions upon secreted proteins ... 37
4.2. Secretome characterization ... 38
4.3. Biochemical characterization of the predominant secreted protein .. 39
4.4. Secretion of endoPG in function of carbon source ... 40
5. DISCUSSION ... 43
6. REFERENCES ... 47
RESUMO
DINIZ, Raphael Hermano Santos, D. Sc., Universidade Federal de Viçosa, março de 2013. Otimização do processo fermentativo e análise do secretoma de Kluyveromyces marxianus UFV-3 em meios contendo lactose em diferentes condições de cultivo. Orientadora: Flávia Maria Lopes Passos. Coorientadores: Luciano Gomes Fietto e Wendel Batista da Silveira.
ABSTRACT
DINIZ, Raphael Hermano Santos, D. Sc., Universidade Federal de Viçosa, March, 2013. Optimization of the fermentation and secretome analysis of Kluyveromyces marxianus UFV-3 in medium containing lactose in different forms of cultivation. Adviser: Flávia Maria Lopes Passos. Co-advisers: Luciano Gomes Fietto and Wendel Batista da Silveira.
INTRODUÇÃO
Atualmente, o etanol é considerado a mais importante alternativa ao uso de combustíveis fósseis por reduzir a emissão de gases poluentes na atmosfera, diminuir a dependência de petróleo, criar empregos nas áreas rurais e reduzir déficits comerciais entre os países produtores e consumidores de petróleo (PRASAD et al., 2007). A produção de bioetanol a partir da biomassa lignocelulósica de resíduos agroindustriais e florestais é vista como uma tecnologia promissora. No entanto, o alto custo associado à hidrólise da biomassa, que é essencial para disponibilizar os açúcares fermentáveis, ainda inviabiliza o processo industrial em larga escala. Assim, matérias-primas que possuem carboidratos prontamente fermentáveis, como a lactose do soro de queijo, são provavelmente mais viáveis para a produção de etanol (GUIMARÃES et al., 2010). Soro de queijo é o principal subproduto da indústria de queijo e o volume total de soro produzido no mundo ultrapassa 108 toneladas de resíduo por ano. O descarte do soro de queijo sem tratamento prévio pode provocar a destruição da flora e fauna aquática devido a alta demanda bioquímica de oxigênio (DBO) do mesmo, entre 50.000 a 60.000 mg de O2 por litro de soro (GONZÁLEZ-SISO, 1996).
metabolizados pela tradicional levedura da fermentação alcoólica, Saccharomyces cerevisiae, até a alta capacidade para produção de biomassa e biomoléculas de interesse socioeconômico (LANE e MORRISSEY, 2010). Kluyveromyces marxianus UFV-3, isolada de ambientes de laticínios da Zona da Mata mineira, produz etanol com rendimento próximo ao valor teórico, quando cultivada em alta concentração de permeado de soro de queijo e baixo nível de oxigênio (SILVEIRA et al., 2005). De fato, a expressão de genes e atividade de enzimas chave do metabolismo fermentativo de lactose em K. marxianus UFV-3 é maior em hipoxia do que em aerobiose (DINIZ et al., 2012).
Embora tenha sido demonstrado o potencial fermentativo de K. marxianus UFV-3 a interação de inúmeros fatores que podem influenciar a capacidade fermentativa desta levedura ainda não foram avaliados. Os efeitos da temperatura, pH, concentração de substrato, do produto final (etanol) e de células são relatados como importantes fatores que influenciam na capacidade fermentativa de leveduras. A metodologia de superfície resposta (MSR) pode ser uma importante ferramenta estatística no processo de otimização da produção de etanol por K. marxianus UFV-3.
secretoma é útil para a compreensão de como o organismo interage com o ambiente e responde aos estímulos externos, podendo assim, desenvolver novas estratégias para otimizar a produção de proteínas heteróloga (MATTANOVICH et al., 2009). Nesse sentido, o açúcar lactose, próprio do nicho ecológico de Kluyceromyces marxianus, parece ser capaz de induzir enzimas extracelulares interessantes para assimilar diversas biomassas na natureza.
REFERÊNCIAS BIBLIOGRÁFICAS
BECERRA, M.; GONZALEZ-SISO, M. I.; CERDAN, M. E. A transcriptome analysis of Kluyveromyces lactis growing in cheese whey. International Dairy Journal, v. 16, p. 207-214, 2006.
DINIZ R. H. S.; SILVEIRA W. B.; FIETTO L. G.; PASSOS, F. M. L. The high fermentative metabolism of Kluyveromyces marxianus UFV-3 relies on the increased expression of key lactose metabolic enzymes. Antonie van Leeuwenhoek, v. 101, nº 3, p.541-50, 2012.
GONZÁLEZ-SISO, M. I. The Biotechnological utilization of cheese whey: a review. Bioresourse Technology, v.57, p.1-11, 1996.
GUIMARÃES, P. M. R.; TEIXEIRA, J. A.; DOMINGUES, L. Fermentation of lactose to bio-ethanol by yeasts as part of integrated solutions for the valorization of cheese whey, Biotechnology Advances, v. 28, p. 375-384, 2010.
LANE, M. M.; MORRISSEY, J. P. Kluyveromyces marxianus: A yeast emerging from its sister’s shadow, FungalBiologyReviews, v. 24, p. 17-26, 2010.
MATTANOVICH, D.; GRAF, A.; STADLMANN, J.; DRAGOSITS, M.; REDL, A.; MAURER, M.; KLEINHEINZ, M.; SAUER, M.; ALTMANN, F.; GASSER, B. Genome, secretome and glucose transport highlight unique features of the protein production host Pichia pastoris. Microbial Cell Factories, v. 2, p. 8-29, 2009.
PRASAD, S.; SINGH, A., JOSHI, H. C. Ethanol as an alternative fuel from agricultural, industrial and urban residues. Resources, Conservation and Recycling, v. 50, p. 1-39, 2007.
ROCHA, S. N.; ABRAHÃO-NETO, J.; CERDÁN, M. E.; GONZÁLEZ-SISO, M. I.; GOMBERT, A. K. Heterologous expression of glucose oxidase in the yeast Kluyveromyces marxianus. Microbial Cell Factories, v. 9, p. 4-14, 2010.
of lactose concentration and oxygen levels. Enzyme and Microbial Technology, v.36, p.930-936, 2005.
ARTIGO 1
TITLE
Optimizing and validating the production of ethanol from cheese whey permeate by Kluyveromyces marxianus UFV-3
1. ABSTRACT
50-108 g L-1. The equation generated from the optimization process was validated and exhibited excellent bias and accuracy values for the future use of this model in scaling up the fermentation process.
2. INTRODUCTION
Cheese whey is the main byproduct from the dairy industry and is composed of approximately 93% water, 5% lactose, 0.9% protein, 0.3% fat, 0.2% lactic acid, vitamins, and mineral salts [1]. In the production of 1 kg of cheese, approximately 10 kg of whey is generated, and it is estimated that the total volume of cheese whey produced worldwide surpasses 160 million tons per year, representing approximately eight million tons of lactose [2]. Approximately 50% of all whey produced is discarded prior to any treatment and causes extensive environmental damage, mainly due to its high biochemical oxygen demand (BOD) of between 50,000 and 60,000 mg L-1 of O2 [1]. Several industries recover a portion of the whey proteins via ultrafiltration for use in food supplements or in other milk products. However, cheese whey permeate resulting from this process still contains approximately 85-95% of the whey lactose, the carbohydrate mainly responsible for its high BOD [3]. Therefore, there is strong incentive for the development of a process for cheese whey permeate treatment that can produce a biotechnological product from the lactose. In recent decades, research on ethanol production from permeate has been driven by the growing demand for cleaner, more renewable energy sources [4]. In addition to biofuel, the ethanol produced from permeate is used in the food, beverage, pharmaceutical, and cosmetic industries, due to its potability [5].
3. MATERIALS AND METHODS
3.1. Yeast strain and maintenance
The yeast used in this study, Kluyveromyces marxianus UFV-3, was isolated from cheese factory in southeastern Brazil and has been stored and maintained in the culture collection at the Laboratory of Microorganism Physiology, BIOAGRO, of the Federal University of Viçosa, Minas Gerais, Brazil. The yeast was kept frozen at -80ºC in medium containing 50% glycerol. The starting inoculum for fermentation was prepared by adding 1% (w/v) of the biomass stored at -80ºC into YNB medium (Sigma®, St. Louis, USA) supplemented with 2% lactose and cultured under agitation (200 rpm) at 37ºC for 18-24 hours. After this period, the active cells were centrifuged (3,000 g, 5 minutes), washed three times with distilled water, and then inoculated into the fermentation medium.
3.2. Fermentation medium
3.3. Fermentation conditions
The fermentations were performed in 50 mL test tubes containing 20 mL of fermentation medium, and the tubes were sealed with silicone plugs to reduce oxygen permeability. The test tubes were kept in a water bath for 144 hours without agitation. Different combinations of lactose concentration, initial cell biomass concentration, temperature, and pH were used in this study (Table 1). All culturing was performed in hypoxic conditions under nitrogen gas (99.9%, v/v) following a 15-minute purge after initial cell biomass inoculation. Samples were taken from all of the fermentations every 24 hours to determine cell growth, lactose consumption, and ethanol production. The pH was measured at the end of each experiment to test the effectiveness of the buffer used.
3.4. Cell growth and the relationship between absorbance at 600 nm (A600nm) and dry cell mass concentration (g L-1)
To determine the biomass dry weight, culture samples from the exponential growth phase (10 mL) were centrifuged at 3000 g for 5 min at 4 ºC, and the cell pellet was resuspended in 6 mL of demineralid water. A volume of 4 mL was distributed into four aliquots of 1 mL each and dried at 105 ºC for 24 h to determine the dry mass. A linear regression of the plot of the absorbance (A600nm) versus dry mass (g L-1) allowed the determination of the dry mass corresponding to 1 unit of absorbance at 600 nm. One A600nm unit was found to be equivalent to 0.507 g L-1 of the dry mass of K. marxianus UFV-3.
3.5.Primary metabolite analysis
Samples taken during the various fermentations were centrifuged at 13,200 g for 5 minutes, and the supernatants were collected and frozen at -20ºC. To determine the levels of lactose and ethanol, 20 µL of supernatant
0.005 M H2SO4 eluent, a flow rate of 0.7 mL min-1, and a column temperature of 25°C.
3.6.Determining fermentation parameters
The maintenance coefficient of the cell was set to zero, and three fermentative parameters were determined:
RF or YE/L = ((Etf-Eti)/(Li-Lf))/4 (Equation 1) YE/X = (Ef-Ei)/Xm (g g-1), and (Equation 2) Qp = (Ef-Ei)/h (g L-1 h-1) (Equation 3)
where Eti is the initial ethanol concentration (mol L-1), Etf is the final ethanol concentration (mol l-1), L
i is the initial lactose concentration (mol L-1), Lf is the final lactose concentration (mol L-1), E
i is the initial ethanol concentration (g L -1), E
f is the final ethanol concentration (g L-1), Xm is the average cell biomass concentration in the medium (g L-1), and h is the time (h).
The theoretical ethanol yield is 4 mol per 1 mol of lactose consumed, for this reason the RF value was divided for 4. Thus, the RF value is 1 (or 100% ethanol yield) and minimum value 0 (or 0% ethanol yield).
3.7. Experimental design and validation of methods
The design of this study consisted of two steps: (i) a preliminary analysis of the factors that influence the fermentative behavior of K. marxianus UFV-3 in synthetic YNB medium and (ii) the determination of the effects of these factors on the fermentation process in CWP and a subsequent optimization and validation of the process's operating conditions.
ethanol by K. marxianus UFV-3 [8, 9]. The experiment was initially performed in YNB medium. After confirming the significance of the factors' effects and optimizing their operational ranges, the fermentations were performed in cheese whey permeate. The CCRD was designed using the Minitab®16 software, and the assays were randomized to avoid any experimental or technical bias. The fermentation process was monitored every 24 hours. This experimental design allowed for the fitting of a quadratic model to estimate the response factor (RF) (Equation 1) using the factors pH, temperature, lactose concentration, and cell biomass concentration, as given by:
RF = β0 + Σ4i=1βiiXi + Σ4i=1βiiX2i + Σ3i=1Σ4j=i+1βijXiXj (Equation 4)
where β0 is the constant; xi are the variables in natural scale (not coded); βi (i = 1-4) and βii are the coefficients corresponding to linear and quadratic terms,
respectively; and βij (i and j= 1-4) are the second-order interaction
coefficients. The data were analyzed using the F test for regression (analysis of variance), and the polynomial model (Equation 4) was fitted based on the significance (α = 0.05) of the coefficients according to the t-test. Statistical
analyses were performed using the Minitab®16 software. The quality of the model fit was expressed by the coefficient of determination, R2 and by the statistical significance of regression and of lack-of-fit from the analysis of variance. In addition, the model for the fermentation of cheese whey permeate was validated through bias and accuracy factors [12], as described in the following equations:
Bias Factor (FB): FB = 10(Σlog(P/O)/n) (Equation 5); Accuracy Factor (FA): FA = 10(ΣIlog(P/O)I/n) (Equation 6)
4. RESULTS AND DISCUSSION
Initially, the factors that affect the fermentative behavior of K. marxianus UFV-3 and the functional ranges of their values were investigated in synthetic YNB medium. Table 1 shows the experimental conditions for the fermentations performed and the RF that corresponds to the relationship between ethanol yield and lactose consumed (Equation 1). In addition to the RF, other fermentation parameters were calculated, such as ethanol produced per gram of cell biomass (YE/X) and maximum volumetric productivity (Qp). In preliminary analyses performed in minimal medium, the RF values ranged from 0.054 to 0.992, indicating that the process can be optimized within the range studied for each fermentation factor. In most of the experiments, the Qp was higher at 24 and 48 hours of fermentation than at the other periods evaluated. This result indicates that the process is efficient in the early stages of fermentation, which is desirable for industrial fermentation processes. Analysis of the YE/X values revealed that the factors evaluated influence the fermentative metabolism of K. marxianus UFV-3, as the YE/X values were reduced up to 25-fold under certain conditions. A quadratic model was fitted (p-value = 0.043, R2 = 65.66%) for this preliminary analysis, in which the factors temperature (T), pH, and lactose concentration (L) exhibited significant linear and quadratic coefficients:
RF (synthetic medium) = – 20.111 + 0.538 (T) + 4.138 (pH) + 0.011 (L) – 0.008 (T2) – 0.391 (pH2) –0.000 (L2) (Equation 7)
16
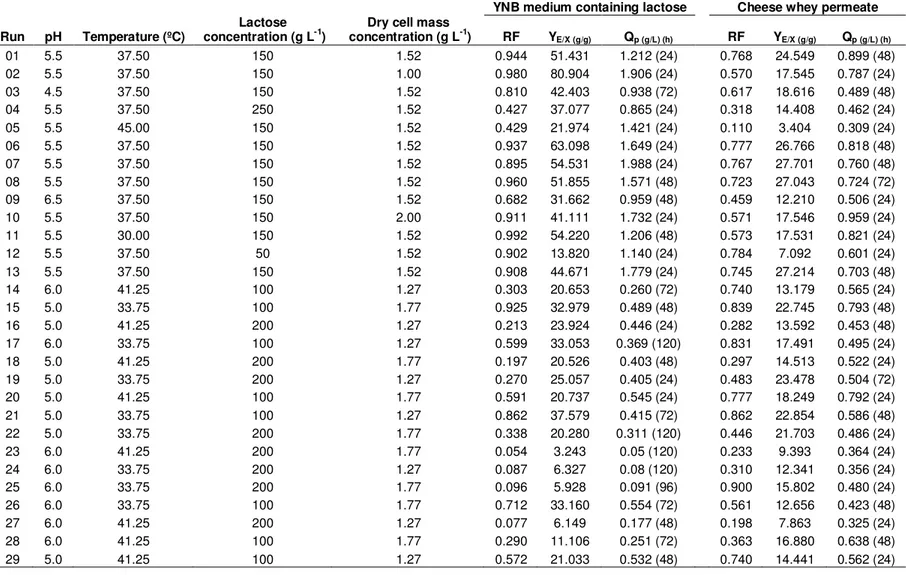
Table 1. Central composite rotational design (CCRD) conducted to optimize fermentation by Kluyveromyces marxianus UFV-3 in YNB medium
containing lactose and cheese whey permeate. The factors evaluated were pH, temperature (T), lactose concentration (L), and dry cell mass concentration initial (C). The following fermentation parameters were analyzed: relationships between ethanol production by lactose consumed (RF), ethanol yield with cell biomass concentration (YE/X), and maximum volumetric productivity (Qp).
YNB medium containing lactose Cheese whey permeate
Run pH Temperature (ºC) concentration (g LLactose -1) concentration (g LDry cell mass -1) RF Y
E/X (g/g) Qp (g/L) (h) RF YE/X (g/g) Qp (g/L) (h)
01 5.5 37.50 150 1.52 0.944 51.431 1.212 (24) 0.768 24.549 0.899 (48)
02 5.5 37.50 150 1.00 0.980 80.904 1.906 (24) 0.570 17.545 0.787 (24)
03 4.5 37.50 150 1.52 0.810 42.403 0.938 (72) 0.617 18.616 0.489 (48)
04 5.5 37.50 250 1.52 0.427 37.077 0.865 (24) 0.318 14.408 0.462 (24)
05 5.5 45.00 150 1.52 0.429 21.974 1.421 (24) 0.110 3.404 0.309 (24)
06 5.5 37.50 150 1.52 0.937 63.098 1.649 (24) 0.777 26.766 0.818 (48)
07 5.5 37.50 150 1.52 0.895 54.531 1.988 (24) 0.767 27.701 0.760 (48)
08 5.5 37.50 150 1.52 0.960 51.855 1.571 (48) 0.723 27.043 0.724 (72)
09 6.5 37.50 150 1.52 0.682 31.662 0.959 (48) 0.459 12.210 0.506 (24)
10 5.5 37.50 150 2.00 0.911 41.111 1.732 (24) 0.571 17.546 0.959 (24)
11 5.5 30.00 150 1.52 0.992 54.220 1.206 (48) 0.573 17.531 0.821 (24)
12 5.5 37.50 50 1.52 0.902 13.820 1.140 (24) 0.784 7.092 0.601 (24)
13 5.5 37.50 150 1.52 0.908 44.671 1.779 (24) 0.745 27.214 0.703 (48)
14 6.0 41.25 100 1.27 0.303 20.653 0.260 (72) 0.740 13.179 0.565 (24)
15 5.0 33.75 100 1.77 0.925 32.979 0.489 (48) 0.839 22.745 0.793 (48)
16 5.0 41.25 200 1.27 0.213 23.924 0.446 (24) 0.282 13.592 0.453 (48)
17 6.0 33.75 100 1.27 0.599 33.053 0.369 (120) 0.831 17.491 0.495 (24)
18 5.0 41.25 200 1.77 0.197 20.526 0.403 (48) 0.297 14.513 0.522 (24)
19 5.0 33.75 200 1.27 0.270 25.057 0.405 (24) 0.483 23.478 0.504 (72)
20 5.0 41.25 100 1.77 0.591 20.737 0.545 (24) 0.777 18.249 0.792 (24)
21 5.0 33.75 100 1.27 0.862 37.579 0.415 (72) 0.862 22.854 0.586 (48)
22 5.0 33.75 200 1.77 0.338 20.280 0.311 (120) 0.446 21.703 0.486 (24)
23 6.0 41.25 200 1.77 0.054 3.243 0.05 (120) 0.233 9.393 0.364 (24)
24 6.0 33.75 200 1.27 0.087 6.327 0.08 (120) 0.310 12.341 0.356 (24)
25 6.0 33.75 200 1.77 0.096 5.928 0.091 (96) 0.900 15.802 0.480 (24)
26 6.0 33.75 100 1.77 0.712 33.160 0.554 (72) 0.561 12.656 0.423 (48)
27 6.0 41.25 200 1.27 0.077 6.149 0.177 (48) 0.198 7.863 0.325 (24)
28 6.0 41.25 100 1.77 0.290 11.106 0.251 (72) 0.363 16.880 0.638 (48)
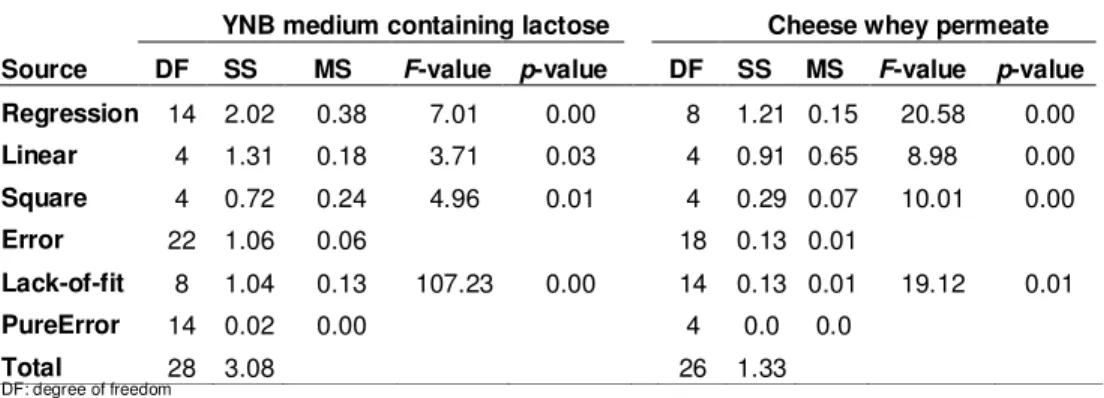
Table 2. Analysis of variance – ANOVA – of the model fitted using the Minitab®16 software for the response factor (RF) – relationship between ethanol production and lactose consumed.
YNB medium containing lactose Cheese whey permeate Source DF SS MS F-value p-value DF SS MS F-value p-value Regression 14 2.02 0.38 7.01 0.00 8 1.21 0.15 20.58 0.00 Linear 4 1.31 0.18 3.71 0.03 4 0.91 0.65 8.98 0.00 Square 4 0.72 0.24 4.96 0.01 4 0.29 0.07 10.01 0.00
Error 22 1.06 0.06 18 0.13 0.01
Lack-of-fit 8 1.04 0.13 107.23 0.00 14 0.13 0.01 19.12 0.01
PureError 14 0.02 0.00 4 0.0 0.0
Total 28 3.08 26 1.33
DF: degree of freedom SS: square sum MS: mean square
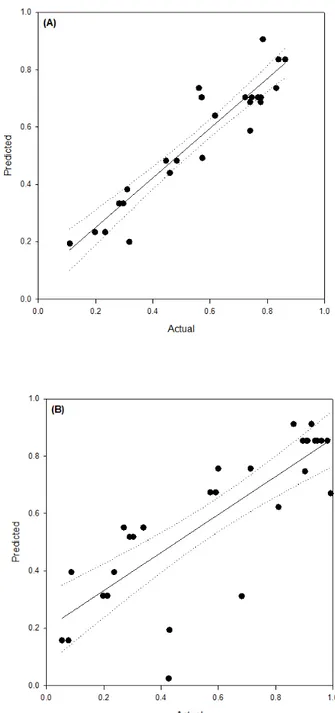
The R value (correlation coefficient) was 0.66 (Figure 1A) for the linear relationship between the predicted and observed values in synthetic medium, similar to that observed in other studies on the optimization of ethanol production from CWP [13-15].
After testing the significance of the factors that affect the fermentation process in minimal medium and confirming their range of values, a new CCRD was conducted to obtain an empirical model for optimizing the fermentation conditions in CWP. Table 1 shows the combinations of the levels of factors tested and the respective responses obtained. As in the synthetic medium, all of the fermentations in CWP were performed under hypoxic conditions similar those under which most industrial fermentations are performed.
Figure 1. Predicted values and actual values for the RF (relationship between ethanol production and lactose consumed). (A) YNB medium containing lactose (R2 = 0.66) and (B) cheese whey permeate (R2 = 0.86). The dotted lines indicate the 95% confidence interval.
biomass concentration (C) showed significant linear and quadratic coefficients as follows:
RF (permeate)= – 15.059 + 0.506 (T) + 2.060 (pH) – 0.020 (L) + 1.924 (C) – 0.007 (T2) – 0.198 (pH2) –0.000 (L2) – 0.655 (C2) (Equation 8)
The R2 value observed for this fit was higher than those obtained in different types of cheese whey used in other studies [13-15].
The RF values predicted by the fitted model (Equation 8) showed a high linear correlation (R = 0.86) with the values obtained in the fermentation trials using cheese whey permeate (Figure 1B), which was a considerably high value for experiments on fermentation processes.
(A)
(B)
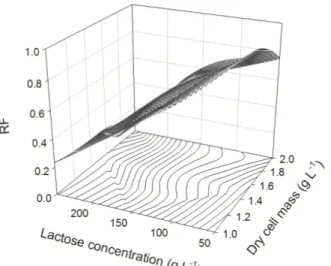
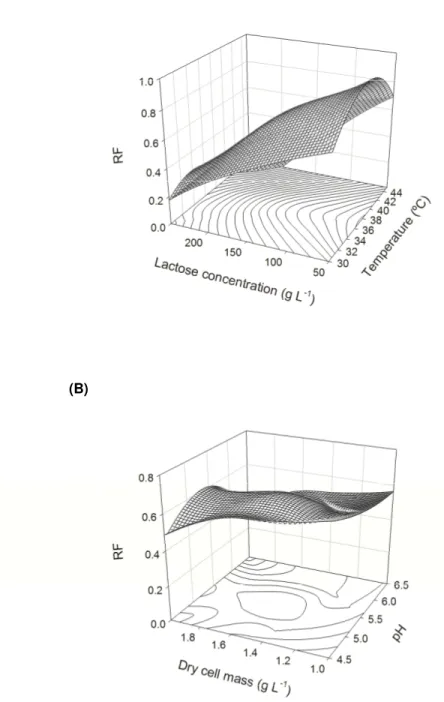
Although lactose concentration showed the lowest significance value among all of the factors studied, inter-factor analysis of the relationships lactose-cell concentrations (Figure 3A) and lactose concentration-pH (Figure 3B) revealed that variations in lactose concentration resulted in higher variations in the RF. Ethanol yields were high at lactose concentrations near 120 g L-1. At concentrations above 120 g L-1, there was a progressive decrease in the RF, reaching minimal values when the lactose concentration was above 220 g L-1.
Fermentation yields were higher at cell mass concentrations lower than 1.72 g L-1 (Figure 3A) and were also high within the 4.5-6 pH range (Figure 3B). Depending on the type of cheese that is produced, sweet or sour, the pH of the permeate/cheese whey will vary [5]. The ability of K. marxianus UFV-3 to efficiently convert lactose from the CWP into ethanol in a pH range common to different types of cheese whey can be considered an advantage from an industrial perspective because there is no need for prior correction of substrate pH.
Figure 4A shows that the variation in the factors temperature and lactose concentration significantly alters the RF. Within the ranges of temperature from 33-38ºC and lactose concentration from 50-120 g L-1, ethanol yields are close to the theoretical value. In contrast, at high temperatures and lactose concentrations, minimal yields are attained. In general, the different K. marxianus strains analyzed recently, such as MSR Y-8281, CBS 397, and Kluyveromyces fragilis (Kf1) [13-15], show higher ethanol yields in lactose concentrations near or below 80 g L-1. Ethanol yields near the theoretical values obtained by K. marxianus UFV-3 in CWP with a lactose concentration near 100 g L-1 are promising when considering the economic viability of using permeate as the raw material for producing ethanol. Economic feasibility studies show that ethanol production from cheese whey becomes economically viable when it is concentrated two-fold to achieve a lactose concentration near 100 g L-1 [18]. It is to be noted that significant variations in the RF were only observed at dry cell mass concentrations near 2 g L-1 and pH values near 4.5 or 6.5 (Figure 4B). A weaker response to the cell biomass
(A)
(B)
(A)
(B)
in ethanol production from cheese whey by Kluyveromyces fragilis Kf1 [15]. Apparently, cell biomass concentration only affects the rate at which lactose is converted into ethanol and does not increase the conversion efficiency. In fact, recent studies with the K. marxianus DSMZ 7239 strain found that lower cell biomass concentrations led to longer lag phases before initial ethanol production but without significant changes in ethanol yields [19].
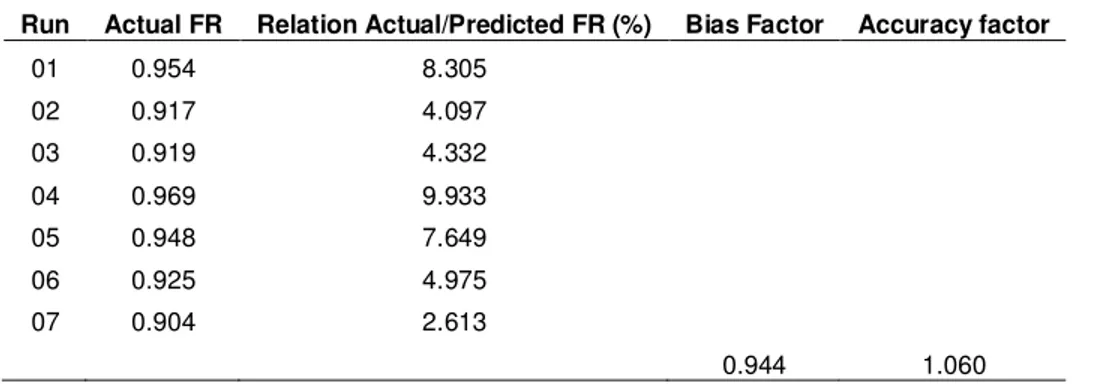
Despite the consensus in the scientific community regarding the potential for using K. marxianus under industrial conditions, there are few studies on optimizing these processes and validating the resulting optimization models. In the present study, the bias and accuracy factors were evaluated (Table 3) to test the reliability and suitability of the fitted model for predicting RF values in optimizing the fermentation parameters for CWP. Seven fermentations were performed under the following conditions: temperature, 37ºC; pH, 5.4; lactose concentration, 94 g L-1; and cell biomass concentration, 1.72 g L-1. The values obtained for the bias factor (0.944) and the accuracy factor (1.060) indicate that the model is reliable and suitable for estimating the RF values of this process and that modulations of the factors pH, temperature, lactose concentration, and cell concentration all contribute to maximizing the RF in optimizing ethanol production from cheese whey permeate.
Table 3. Validation of the quadratic model (Equation 8) obtained for optimizing ethanol production from cheese whey permeate by Kluyveromyces marxianus UFV-3. The culturing
conditions were as follows: temperature, 37ºC; pH, 5.4; lactose concentration, 95 g L-1; and dry cell mass concentration, 1.72 g L-1.
Run Actual FR Relation Actual/Predicted FR (%) Bias Factor Accuracy factor
01 0.954 8.305
02 0.917 4.097
03 0.919 4.332
04 0.969 9.933
05 0.948 7.649
06 0.925 4.975
07 0.904 2.613
5. CONCLUSIONS
Temperature, pH, lactose concentration, and dry cell mass concentration are factors that significantly affect the fermentation of cheese whey permeate by K. marxianus UFV-3. Optimization of the RF values through factors that affect the fermentation process produced ethanol yields above 90%. The quadratic response model was adequately validated and may be used for guiding the scaling of the fermentation process. The ranges in values that obtained ethanol yields above 90% were as follows: temperatures between 33.3-38.5ºC, pH between 4.7-5.7, lactose concentrations between 50-108 g L-1, and dry cell mass concentration between 1.21-1.67 g L-1.
The results indicated that using K. marxianus UFV-3 to convert lactose from cheese whey permeate into ethanol is promising because yields close to the theoretical value were achieved over a range of temperatures, pH values, and lactose concentrations, all of which are considered crucial to the economic feasibility of using the permeate as a raw material for ethanol production.
Acknowledgements
6. REFERENCES
[1] González-Siso MI. The Biotechnological utilization of cheese whey: a review. BioresourceTechnol 1996;57(1):1-11.
[2] OECD-FAO. OECD-FAO Agricultural Outlook 2008–2017 Highlights. Paris: Organization for Economic Co-operation and Development Food and Agriculture Organization of the United Nations, 2008. Available at http://www.agri-outlook.org/dataoecd/54/15/40715381.pdf; march 2012. [3] Vienne P, Stockar UV. An investigation of ethanol inhibition and other limitations occurring during the fermentation of concentrated whey permeate by Kluyveromyces fragils. Biotechnol Lett 1985;7(7):521-6
[4] Haberl H, Erb KH, Krausmann F, Bondeau A, Lauk C, Müller C, Plutzar C, Steinberger JK. Global bioenergy potentials from agricultural land in 2050: Sensitivity to climate change, diets and yields. Biomass Bioenerg 2011;35(12):4753-69.
[5] Guimarães PMR, Teixeira JA, Domingues L. Fermentation of lactose to bio-ethanol by yeasts as part of integrated solutions for the valorization of cheese whey. Biotechnol Adv 2010;28(3):375–84.
[6] Lane MM, Burke N, Karreman R, Wolfe KH, O'byrne CP, Morrissey JP. Physiological and metabolic diversity in the yeast Kluyveromyces marxianus. A Van Leeuw 2011;100(4):507-19.
[7] Lane MM, Morrissey JP. Kluyveromyces marxianus: A yeast emerging from its sister’s shadow. Fungal Biol Rev 2010;24(1-2):17–26.
[10] Uncu ON, Cekmecelioglu D. Cost-effective approach to ethanol production and optimization by response surface methodology. Waste Manage 2011;(31)4:636-43.
[11] Myers RH, Montgomery DC. Response surface methodology: process and product optimization using designed experiments. 1st ed. Canada: John Wiley & Sons; 1995.
[12] Baranyi J, Pin C, Ross T. Validating and comparing predictive model. Int J Food Microbiol 1999;48(3):159–66.
[13] Akta N, Boyaci IH, Mutlu M, Tanyolaç A. Optimization of lactose utilization in deproteinated whey by Kluyveromyces marxianus using response surface methodology (RSM). Bioresource Technol 2006;97(18): 2252–9.
[14] Sansonetti S, Curcio S, Calabro V, Iorio G. Optimization of ricotta cheese whey (RCW) fermentation by response surface methodology. Bioresource Technol 2010; 101(23):9156–62.
[15] Dragone G, Mussatto SI, Silva JBA, Teixeira JA. Optimal fermentation conditions for maximizing the ethanol production by Kluyveromyces fragilis from cheese whey powder. Biomass Bionerg 2011;35(5):1977-82.
[16] Ghaly AE, Kamal MA. Submerged yeast fermentation of acid cheese whey for protein production and pollution potential reduction. Water Res 2004;38(3):631–44.
[17] Babiker MA, Banat A, Hoshida H, Ano A, Nonklang S, Akad R. High-temperature fermentation: how can processes for ethanol production at high temperatures become superior to the traditional process using mesophilic yeast? Appl Microbiol Biotechnol 2010; 85(4):861–86.
[18] Mawson AJ. Bioconversions for whey utilization and waste abatement. Bioresource Technol 1994;47(3):195-203.
ARTIGO 2
Title
Effect of cultivation methods on Kluyveromyces marxianus UFV-3 protein secretion and biotechnological applications
1. ABSTRACT
protein diversity was higher than in other cultures and a protein with apparent Mr of 45 KDa was predominant. Furthermore, one of the bands was clearly stronger than other bands in the gel. The secretome of K. marxianus UFV-3 was characterized from growth in continuous culture, because the environmental conditions are highly controlled and therefore the results are more reproducible than during fed-batch cultures. Samples of the continuous culture supernatant were subjected to protein size fractioning and in-gel digestion, followed by a reversed-phase peptide separation in the nano-LC system, and a subsequent peptide identification made by MALDI-TOF/TOF. Eight proteins were identified as structural proteins or membrane proteins, and the protein that was heavily secreted was identified as an endopolygalacturonase - endoPG - (EC 3.2.1.15). EndoPG shows optimum enzymatic activity at 59.5 ºC and pH 5.1. Furthermore, it was found that secretion diminished in glucose while showing intense secretion in batch cultures containing lactose, galactose and mainly glycerol as carbon source.
2. INTRODUCTION
Yeasts have occupied a prominent position in modern genetics, molecular biology and cell biology. Focus has been set predominantly on Saccharomyces cerevisiae, the “conventional” yeast considered a model for eukaryotic cells, Schizosaccharomyces pombe, the "fission yeast" model, Kluyveromyces lactis, a convenient model for oxidative and lactose metabolism studies, and Candida albicans due to its clinical significance. There is an increasing interest in the study and the finding of new biotechnological applications of the so-called ‘‘non-conventional’’ yeasts (Lane and Morrisey, 2010). Recently, Kluyveromyces marxianus has attracted attention due to its biotechnological potential. This yeast has been isolated from different environments, and the different strains show high metabolic diversity and substantial degree of intra-specific polymorphism. Several biotechnological applications have been investigated in K. marxianus such as cellular protein (single-cell protein), aromatic compounds, ethanol and heterologous protein production, bio-ingredients from cheese whey and bioremediation (Lane et al., 2011).
composition of a given microorganism once its genome has been sequenced; i.e. computational analyses of C. albicans genome predicted approximately 200 potentially secreted proteins (Mattanovich et al., 2009). However, there are obvious limitations in these predictions, such as those attributed to proteins released from the cell wall during growth and budding. Moreover, the actual composition of the secretome is strongly dependent on the growth conditions and on the actual expression of the genes encoding potentially secreted proteins The identification of proteins secreted by K. marxianus UFV-3 will be useful to understand how this yeast responds to external stimuli, providing new insights for improved production of heterologous proteins. (Mattanovich et al., 2009).
3. MATERIAL AND METHODS
3.1. Yeast strain and maintenance
Kluyveromyces marxianus UFV-3 used in this study was isolated from a Brazilian regional dairy environment. During the course of this work it was maintained streaking on YPL plates (10 g L-1 yeast extract, 20 g L-1 peptone, 20 g L-1 lactose, 15 g L-1 agar) at 4 ºC. A pre-culture was prepared by inoculating one isolated colony in YPL agar to synthetic YNB medium (Sigma®, St. Louis, U.S.A.) with lactose (20 g L-1 final concentration). The pre-cultures were incubated at 37 ºC in rotary shaker at 150 rpm and grown overnight. After this period, the cells were centrifuged (3,000 g, 5 minutes), washed three times with sterile distilled water, and inoculated up to an A600nm 0.1 into the medium.
3.2. Growth conditions
for 8-10 generations to reach steady-state when cell mass concentration and the pH of the samples were monitored.
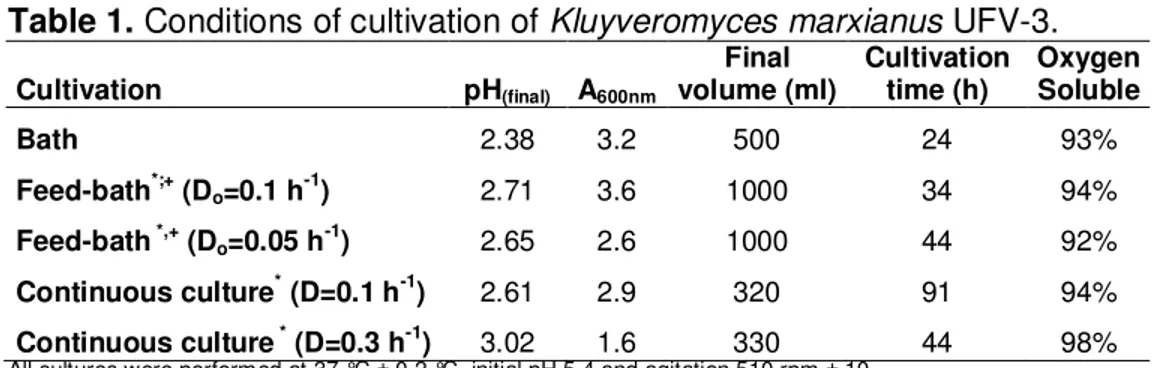
Table 1. Conditions of cultivation of Kluyveromyces marxianus UFV-3.
Cultivation pH(final) A600nm
Final
volume (ml) Cultivation time (h) Oxygen Soluble
Bath 2.38 3.2 500 24 93%
Feed-bath*;+ (D
o=0.1 h-1) 2.71 3.6 1000 34 94%
Feed-bath *,+ (D
o=0.05 h-1) 2.65 2.6 1000 44 92%
Continuous culture* (D=0.1 h-1) 2.61 2.9 320 91 94%
Continuous culture * (D=0.3 h-1) 3.02 1.6 330 44 98%
All cultures were performed at 37 °C ± 0.2 °C, initial pH 5.4 and agitation 510 rpm ± 10 The culture medium used was YNB 2% lactose
The initial A600nm all cultivation was 0.1
*The feeding were initiated after 24 hours of cultivation
+The culture medium used in the batch feed was fed: YNB (2x) supplemented with lactose10%
After identifying the K. marxianus UFV-3 extracellular secretome, experiments were performed to analyze the pattern of secretion of yeast in complex medium (YP) with different carbohydrates. Extracellular protein diversity was analyzed in cultures carried out in YP medium supplemented with glucose, lactose, galactose or glycerol (final concentration 2 g L-1 w v-1). The yeast was cultured at 37 ºC at 150 rpm for 24, 48, and 72 hours.
3.3. Protein concentration and SDS-PAGE
For the in-gel fractioning, 20 µL of each extracellular concentrated protein sample was loaded in 12% acrylamide in-house gels and separated by SDS-PAGE in a Protean® mini-gel system (Bio-Rad, Hercules, (CA), U.S.A.) at a constant voltage of 100V. The gels were lightly stained with Coomassie Blue for 10 minutes to check protein integrity. Each entire lane was size-fractioned into 4 sections, which were subsequently processed separately. Each section was de-stained with methanol, generating three experimental replicates, diced into small pieces and in-gel digested, following a standard procedure (Shevchenko et al., 2006). Briefly, the samples were desiccated for 16 hours at 37 ºC with acetonitrile, reduced with DTT, alkylated with iodoacetamide and trypsin-digested (6 ng L-1, PromegaMSgold, Madison, (WI), U.S.A.). Peptides were then extracted, dried in a speed-vac, reconstituted in 0.1% trifluoroacetic acid and de-salted by using self-made frits for nanoscale columns.
In the experiments analyzing the diversity of proteins in YP medium, the supernatant was not concentrated; it was centrifuged and filtered through 0.22 µm membrane (Millipore, Billerica, (MA), U.S.A.).
3.4. NanoLC–MALDI-TOF/TOF
The peptide fractions were separated using reversed phase chromatography in a nanoLC system (Tempo, Eksigent, Dublin, (CA), U.S.A.). Samples were loading through a trapping column into a C18 silica-based column (New Objective, Woburn, MA, U.S.A.) with an internal diameter of 300 Å. Peptides were eluted at a flow rate of 0.35 ìL min-1 during 30-minute by a linear gradient from 2% to 40% acetonitrile (mobile phase A: 0.1% trifluoroacetic acid 2% acetonitrile; mobile phase B: 0.1% trifluoroacetic acid 95% acetonitrile), mixed with á-cyano matrix (4 mg mL-1 at a flow rate of 1.1 ìL min-1) and deposited onto a MALDI plate using an automatic spotter (SunCollect, Sunchrome, Friedrichsdorf, Germany). Chromatograms, corresponding to each gel section, were composed of 120 spots, each one comprising a 15-second deposition.
using a fixed laser intensity of 3800 kV and 1500 shots/spectrum. Automated precursor selection was done using a Job-Wide interpretation method (up to 10 precursors/fraction, signal-to-noise lower threshold 50) with a laser voltage of 4800 and 1500 shots/spectrum at medium CID collision energy range. A second Job-Wide precursor selection was done by excluding those previously fragmented precursors and by using a lower signal-to-noise threshold of 30, to identify peptides coming from low-abundance proteins. Data from both MS/MS acquisitions were used for data processing and subsequent protein identification.
3.5. Database search and protein identification
The complete MS and MS/MS raw data were processed separately using the Protein Pilot® software platform (ABSciex, Framingham, (MA), U.S.A.) and Mascot Search (Pearkins et al., 1999). Peptide identification in Protein Pilot® software was performed against the last uniprot_sprot-release (2012_05 of 20-may-2012, 536029 sequence entries). Search parameters for Mascot and Protein Pilot® included carbamidomethylation of cysteines (fixed), oxidation of methionine (variable, ≤ 4), 1 missed trypsin normal cleavage,
precursor ion mass range 800–4000 Da, ± 50-150 ppm tolerance on precursor and ± 0.3 Da on fragmentation of ions. The scoring model was defined by the algorithm, and the peptide acceptance parameters were peptide length ≥ 5; minimum peptide z-score of 5.0; maximum peptide
p-value of 1.0 e−7; and an AC score of 8.0. False Discovery Rate (FDR) was estimated by contrasting both uniprot_sprot and decoy uniprot_sprot databases.
3.6. Endopolygalacturonase enzymatic assay
10 minuteswith temperatures ranging from 50 to 70 ºC. One unit of activity was defined as the amount of enzyme that releases 1 µmol of galacturonic acid or the equivalent in reducing power per minute.
3.7. Experimental design of response surface methodology on endopolygalacturonase activity
To determine the effects of the two factors on endopolygalacturonase activity, a CCRD (2K+2K+5, where K is the number of factors) was proposed, with a total of 13 experimental units and 5 replicates at the central point (K=2). The investigated factors, pH and temperature, were selected after preliminary testing (data not shown). The experiment was performed in YNB medium, supplemented with lactose. The CCRD was designed using the Minitab®16.0 software, and the assays were randomized to avoid any experimental or technical bias. This experimental design allowed for the specification of a quadratic model to estimate the enzymatic activity (EA) (Equation 1) using the factors given by:
RF = β0 + Σ4i=1βiiXi+ Σ4i=1βiiX2i + Σ3i=1Σ4j=i+1βijXiXj (Equation 1)
Where β0 is the constant; xi are the variables in natural scale (not coded); βi (i = 1-2) and βii are the coefficients corresponding to linear and quadratic terms,
respectively; and βij (i and j= 1-2) are the second-order interaction
coefficients. The data were analyzed using the F test for regression (analysis of variance), and the polynomial model (Equation 1) was fitted based on the significance (α = 0.05) of the coefficients according to the t-test. Statistical
4. RESULTS
4.1. Influence of growth conditions upon secreted proteins
In order to determine the influence of the growth control on the profile of secreted proteins by K. marxianus UFV-3, this yeast was cultured in lactose as the sole carbon and energy source under five different operation modes: batch, to reach entrance of stationary phase, fed-batch with initial feeding rate of 0.1 or 0.05 h-1, for the later log phase, and continuous culture with the entrance of the stationary phase being attributed to precise low growth rates of 0.3 and 0.1 h-1. In all conditions it was observed a narrow diversity of secreted proteins; however, the pool of secreted proteins changed according to the yeast culture mode (Figure 1).
Figure 1. Proteins of the K. marxianus UFV-3 secretome subjected to SDS-PAGE at 12%
polyacrylamide Tris-Glycine. Samples of 20 µL were loaded and the separated proteins were visualized by colloidal staining (A) and silver staining. M corresponds to protein standards (Molecular masses in KDa; Invitrogen). K. marxianus UFV-3 concentrated supernatants with
The diversity of secreted proteins was lower in continuous culture conducted at the growth rate closer to maximum (0.3 h-1) compared to any other culture mode. In both batch and fed-batch conducted at higher initial feeding rate (0.1 h-1), there was a greater number of bands, when compared to continuous culture conducted at higher dilution rate (0.3 h-1). It should be noted that in both culture operation batch and fed-batch conducted at higher feeding rate, the banding pattern was similar. On the other hand, in both fed-batch and continuous culture conducted at lower feeding and dilution rates 0.05 h-1 and 0.1 h-1, respectively, the band whose size ranges from 35 to 55 KDa was more strong than the other bands. Furthermore, it was found, in these cultures, a higher number of proteins.
4.2. Secretome characterization
Because the environmental conditions in fed-batch cultures are not as well controlled as in the continuous culture conducted at dilution rate of 0.1 h -1, the latter was chosen to analyze the secretome of K. marxianus UFV-3. Nine proteins found in the extracellular extract were identified (Table 2). The most abundant protein in the extracellular medium was excised from the gel for individual identification. It was identified as polyendogalacturonase, endoPG, (EC: 3.2.1.15) with approximately 45 kDa. The other proteins included in Table 2 are related to cell wall or metabolic functions and several are not directly recognized in Kluyveromyces, but in other genera probably due to the un-completeness of K. marxianus genome database
Table 2. Mass spectrometric analysis of the proteins released in culture continuous (D=0.1 h -1) of
Kluyveromyces marxianus UFV-3.
n ORF Organism Annoted protein function
1 Q6TA03_KLUMA Kluyveromyces marxianus Extracellular protein with
polygalacturonase activity
2 KLLA0D16214g Kluyveromyces lactis
P-P-bond-hydrolysis-driven protein transmembrane transporter activity
3 KLLA0D18304g Kluyveromyces lactis Intracellular protein transport
4 KLLA0B07392p Kluyveromyces lactis Structural constituent of cell wall
5 KLLA0B07370p Kluyveromyces lactis Structural constituent of cell wall
6 CAGL0M13805g Candida glabrata Hydrolase activity, hydrolyzing
O-glycosyl compounds 7 BRE1_CANAL Candida albicans E3 ubiquitin-protein ligase
8 C4QVL7_PICPG Pichia pastoris Cell wall protein with similarity
to glucanases
9 DRE2_UNCRE Uncinocarpus reesii iron-sulfur (Fe/S) protein assembly
machinery
4.3. Biochemical characterization of the predominant secreted protein The activity of the K. marxianus UFV-3 endoPG was evaluated as a function of temperatures and pH. It revealed a broad range of activity from 30 to 80 ºC and from pH 2.6-8 (data not shown). Based on this data, the parameters for the response surface were established to maximize the activity of this enzyme with temperatures ranging from 50-70 ºC and pH of 2.6-7.0 (Figure 2). A quadratic model was fitted (R2 = 90.94%) for this analysis, in which both the factors pH and temperature (T) exhibited significant linear and quadratic coefficients:
EA(U/ml): -1.572 +0.156(pH) + 0.046(T) - 0.015 (pH)2- 3.899x10⁻⁴(T)2
Equation (2)
Figure 2. Surface response for polyendogalacturonase activity (EC: 3.2.1.15) as a function of temperature and pH.
4.4. Secretion of endoPG in function of carbon source
(A)
Figure 3. Proteins supernatant of the K. marxianus UFV-3 cultured in YP medium containing
(B)
Figure 3. Proteins supernatant of the K. marxianus UFV-3 cultured in YP medium containing
5. DISCUSSION
It has been demonstrated that some Kluyveromyces marxianus strains are suitable for ethanol production from various carbohydrates (e.g. sucrose, lactose, glucose) while other strains have relevant characteristics to be used as host for heterologous proteins production (Rocha et al., 2010; Lane et al., 2011). K. marxianus UFV-3 is a strain capable of producing cell mass and ethanol from cheese whey permeate and it reaches high fermentation yields (Silveira et. al., 2005), but its ability for protein secretion has not been evaluated yet.
fed-batch is a routine, because they are simple, quick, and have great diversity of proteins. Furthermore, the proteins secreted are found in high concentrations because cell mass yield is higher. On the other hand, cultivations in continuous culture are more complex and demand more amounts of media, and the proteins secreted are in lower concentrations when compared to batch and fed-batch. This occurs because the culture medium, cells, proteins, and metabolites are continuously discharged from fermentator. Nevertheless, the growth conditions in continuous culture are well defined, providing more reproducible responses and homogeneity of the cell population. Furthermore, due to the constant flow of medium, only secreted proteins are constantly accumulated in the fermentator and, consequently, identified. Thus, the number of proteins identified in continuous culture is lower, because intracellular proteins that remain in the medium due to cell lysis are not identified (Daran-Lapujade et al., 2009).
Most of the proteins identified in the secretome have functions not expected a priori in the extracellular medium. KLLA0D18304g, KLLA0D16214g and BRE1_CANAL are proteins related to intracellular transport of other proteins. In Kluyveromyces lactis, KLLA0D18304g is mainly related to protein ubiquitination. In C. albicans, the BRE1_CANAL is also involved in the protein ubiquitination (Madinger et al., 2009; Swaim et al., 2008). KLLA0D16214g is related to the active transport of proteins and transmembrane protein traffic. KLLA0B07392g and KLLA0B07370g are structural constituents of the yeast cell wall. These proteins are part of the native conformation of the cell wall and can occasionally be released. C4QVL7 is also related to cell wall, and its glucanase function suggests that it is related to the remodeling of the cell wall during budding. DRE2 has an anti-apoptotic protein and participates in the maturation of proteins Fe/S, besides to be present in the control of oxidative stress.
the major components of the primary cell wall of plants, the main constituent of the middle lamella and is found in dividing cells and also in the areas of contact between cells having a secondary cell wall (Márques et al., 2011). EndoPG is common in filamentous fungi and found in yeasts, in minor amount. K. marxianus is one of the few ascomycetes able to secrete this enzyme (Serrat et al., 2011).
The maximum extracellular production of endoPG’s in batch culture occurs at early stationary phase because it is reported that involves stress conditions such as decreased rate of oxygen and nutrients (Schwan and Rose, 1994; Serrat et al., 2004). Fed-batch and continuous cultures produce higher concentrations of endoPG when compared to batch cultures (Rojas et al., 2011). In S. cerevisiae producing endoPG, the presence of glucose inhibits the expression of this enzyme, whereas cultivations in polygalacturonans or in galactose induce the expression. Therefore, glucose media are used, in general, for obtaining cell biomass (Radoi et al., 2005; Louw et al., 2010; Rojas et al., 2011). Apparently, the same effect occurs in K. marxianus UFV-3, because the endoPG was not observed on SDS-PAGE when this yeast was cultured in medium containing glucose as carbon source. Thus, apparently, the endo-PG expression in from K. marxianus UFV-3 is repressed by glucose and the enzyme is secreted predominantly in the absence of this carbohydrate, at higher abundance when grown on glycerol.
endoPG was already investigated using beet sugar as substrate and obtaining higher yields of both products (Serrat et al., 2004). The verification in this work that endoPG of K. marxianus UFV-3 is efficiently induced and secreted on lactose enables further studies on the production of ethanol and endoPG from agro-industrial residues containing lactose, as cheese whey.
Pectinase production occupies about 10% of the overall manufacturing of enzyme preparations. For this reason, it is important to investigate the production conditions and physico-chemical characteristics of new enzymes. The identification and characterization of endoPGs, in addition to providing new potential enzymes to participate in this vast international market, also assist the development of new methodologies (Pedrolli et al., 2009). Furthermore, the prominent expression of this protein in specific conditions of growth, as continuous culture at low growth rates in medium containing lactose, is an interesting feature to construct cloning vectors using the endoPG gene promoter. The K. marxianus UFV-3 strain secretes abundant protein into extracellular medium, which can be a base for a construction of an expression system. In addition, the limited number of proteins detected in all culture conditions facilitates down-stream purification of the produced recombinant protein. The genome of K. marxianus UFV-3 was recently sequenced, obtaining 10.7 Mpb, that will assist in future strategies to construct the cloning vectors since the promoter region of the gene of the endoPG can be identified in the genome. Furthermore, the genome sequence of K. marxianus UFV-3 will give support to in silico secretome analysis, because they will complement the information obtained in this work.
Acknowledgment
6. REFERENCES
Bergkamp RJ, Bootsman TC, Toschka HY, Mooren AT, Kox L, Verbakel JM, Geerse RH, Planta RJ (1993) Expression of an alpha-galactosidase gene under control of the homologous inulinase promoter in Kluyveromyces marxianus. Appl. Microbiol. Biotechnol. 40:309–317.
Bradford MM (1976) A rapid and sensitive method for quantitation of microgram quantities of protein utilizing the principle of protein-dye-binding. Anal Biochem 72:248-254.
Buerth C, Heilmann CJ, Klis FM, de Koster CG, Ernst JF, Tielker D (2011) Growth-dependent secretome of Candida utilis. Microbiology 157(9):2493-503.
Daran-Lapujade P, Daran JM, van Maris AJ, de Winde JH, Pronk JT (2009) Chemostat based micro-array analysis in baker's yeast. Adv Microb Physiol 54:257-311.
Diniz RHS, Silveira WB, Fietto LG, Passos, FML (2012) The high fermentative metabolism of Kluyveromyces marxianus UFV-3 relies on the increased expression of key lactose metabolic enzymes. A Van Leeuw 101(3):541-50.
Graf A, Dragosits M, Gasser B, Mattanovich D (2009) Yeast systems biotechnology for the production of heterologous proteins. FEMS Yeast Res 9(3):335-48.
Idiris A, Tohda H, Kumagai H, Takegawa K (2010) Engineering of protein secretion in yeast: strategies and impact on protein production. Appl Microbiol Biotechnol 86(2):403-17.
Kashyap DR, Vohra PK, Chopra S, Tewari R (2001) Applications of pectinases in the commercial sector: a review. Bioresour Techn 77:215-227. Laemmli UK (1970) Cleavage of structural proteins during the assembly of the head of Bacteriophage T4. Nature 227 680-685.
Lane MM, Morrissey JP (2010) Kluyveromyces marxianus: A yeast emerging from its sister’s shadow. Fungal Biol Rev 24(1-2):17–26.
Lara-Márquez A, Zavala-Páramo MG, López-Romero E, Camacho HC (2011) Biotechnological potential of pectinolytic complexes of fungi. Biotechnol Lett 33:859–868.
Louw C, Young PR, van Rensburg P, Divol B (2010) Regulation of endo-polygalacturonase activity in Saccharomyces cerevisiae. FEMS Yeast Res 10(1):44-57.
Madinger CL, Sharma SS, Anton BP, Fields LG, Cushing ML, Canovas J, Taron CH, Benner JS (2009) The effect of carbon source on the secretome of Kluyveromyces lactis. Proteomics 9(20):4744-54.
Mattanovich D, Graf A, Stadlmann J, Dragosits M, Redl A, Maurer M, Kleinheinz M (2009) Genome, secretome and glucose transport high light unique features of the protein production host Pichia pastoris. Microb Cell Fact 8:29.
Miller GL (1959) Use of dinitrosalicylic acid reagent for determination of reducing sugar. Anal Chem 31(3):426–428.
Neuhoff V, Arold N, Taube D, Ehrhardt W (1988) Improved staining of proteins in polyacrylamide gels including isoelectric focusing gels with clear background at nanogram sensitivity using Coomassie Brilliant Blue G-250 and R-250. Electrophoresis 9(6):255-62.
Pedrolli, DB, Monteiro, AC, Gomes, E, Carmona EC (2009) Pectin and pectinases: production, characterization and industrial application of microbial pectinolytic enzymes. The Open Biotech J 3:9-18.
Perkins DN, Pappin DJ, Creasy DM, Cottrell JS (1999) Probability-based protein identification by searching sequence data bases using mass spectrometry data. Electrophoresis 20(18): 3551–67.
Rabilloud T, Brodard V, Peltre G, Righetti PG, Ettori C (1992) Modified silver staining for immobilized pH gradients. Electrophoresis13:264-266.
Radoi F, Kishida M, Kawasaki H. Endo-polygalacturonase in Saccharomyces wine yeasts: effect of carbon source on enzyme production. FEMS Yeast Res 5(6-7):663-8.
Rojas NL, Ortiz GE, Baruque DJ, Cavalitto SF, Ghiringhelli PD (2011) Production of heterologous polygalacturonase I from Aspergillus kawachii in Saccharomyces cerevisiae in batch and fed-batch cultures. J Ind Microbiol Biotechnol. 38(9):1437-47.
Schwan RF, Rose AH (1994) Polygalacturonase production by Kluyveromyces marxianus: effect of medium composition. J Appl Bacteriol 76:62–67.
Jayani RS, Saxena S, Gupta R (2005) Microbial pectinolytic enzymes: A review. Process Biochem 40 2931–2944.
Serrat M, Bermúdez RC, Villa TG (2004) Polygalacturonase and ethanol production in Kluyveromyces marxianus: potential use of polygalacturonase in foodstuffs. Appl Biochem Biotechnol117(1):49-64.
Serrat M, Rodríguez O, Camacho M, Vallejo JA, Ageitos JM, Villa TG (2011) Influence of nutritional and environmental factors on ethanol and endopolygalacturonase co-production by Kluyveromyces marxianus CCEBI 2011. Int Microbiol 14:41-49.
Shevchenko A, Tomas H, Havlis J, Olsen JV, Mann M (2006) In-gel digestion for mass spectrometric characterization of proteins and proteomes. Nat Protoc 1:2856–60.
Silveira WB, Passos FJV, Mantovani HC, Passos FML (2005) Ethanol production from cheese whey permeate by Kluyveromyces marxianus UFV-3: A flux analysis of oxido-reductive metabolism as a function of lactose concentration and oxygen levels. Enzyme Microb Tech 36(7):930-6.
Swaim CL, Anton BP, Sharma SS, Taron CH, Benner JS (2008) Physical and computational analysis of the yeast Kluyveromyces lactis secreted proteome. Proteomics 8(13):2714-23.
Sorgo AG, Heilmann CJ, Brul S, Koster CG, Klis FM (2013) Beyond the wall: Candida albicans secret(e)s to survive. FEMS Microbiol Lett 338:10–17. Thomas DP, Bachmann SP, Lopez-Ribot JL (2006) Proteomics for the analysis of the Candida albicans biofilm life style. Proteomics 6(21):5795-804.
Tjalsma H, Bolhuis A, Jongbloed JD, Bron S, van Dijl JM (2000) Signal
peptide-dependent protein transport in Bacillus subtilis: a genome-based
CONCLUSÕES GERAIS
No processo de otimização da produção de etanol por Kluyveromyces marxianus UFV-3 a partir de permeado de soro de queijo, a temperatura foi o fator mais significativo seguido por pH, concentração de biomassa e de lactose. A faixa de valores para a obtenção de rendimentos de etanol superiores a 90% é: temperatura entre 33,3-38,5 ºC, pH entre 4,7-5,7, concentração de lactose entre 50-108 g L-1 e concentração celular seca entre 1,2-1,7 g L-1. O modelo quadrático foi validado podendo assim ser utilizado na comparação com outros micro-organismos com equações também validadas. Os dados obtidos também podem ser utilizados em processos de escalonamento da produção de etanol e viabilidade econômica por K. marxianus UFV-3. Com a equação da otimização pode-se analisar rendimentos de etanol utilizando matérias primas com valores diversos de pH e concentração de lactose.