Altered Right Ventricular Kinetic Energy Work
Density and Viscous Energy Dissipation in
Patients with Pulmonary Arterial
Hypertension: A Pilot Study Using 4D Flow
MRI
Q. Joyce Han1, Walter R. T. Witschey2, Christopher M. Fang-Yen3, Jeffrey S. Arkles5, Alex J. Barker4, Paul R. Forfia5, Yuchi Han1*
1Cardiovascular Division, University of Pennsylvania, Philadelphia, PA, United States of America,
2Department of Radiology, University of Pennsylvania, Philadelphia, PA, United States of America,
3Department of Bioengineering, University of Pennsylvania, Philadelphia, PA, United States of America,
4Department of Radiology, Northwestern University, Chicago, IL, United States of America,
5Cardiovascular Division, Temple University, Philadelphia, PA, United States of America
Abstract
Introduction
Right ventricular (RV) function has increasingly being recognized as an important predictor for morbidity and mortality in patients with pulmonary arterial hypertension (PAH). The increased RV after-load increase RV work in PAH. We used time-resolved 3D phase con-trast MRI (4D flow MRI) to derive RV kinetic energy (KE) work density and energy loss in the pulmonary artery (PA) to better characterize RV work in PAH patients.
Methods
4D flow and standard cardiac cine images were obtained in ten functional class I/II patients with PAH and nine healthy subjects. For each individual, we calculated the RV KE work density and the amount of viscous dissipation in the PA.
Results
PAH patients had alterations in flow patterns in both the RV and the PA compared to healthy subjects. PAH subjects had significantly higher RV KE work density than healthy subjects (94.7±33.7 mJ/mL vs. 61.7±14.8 mJ/mL, p = 0.007) as well as a much greater percent PA energy loss (21.1±6.4% vs. 2.2±1.3%, p = 0.0001) throughout the cardiac cycle. RV KE work density and percent PA energy loss had mild and moderate correlations with RV ejec-tion fracejec-tion.
OPEN ACCESS
Citation:Han QJ, Witschey WRT, Fang-Yen CM, Arkles JS, Barker AJ, Forfia PR, et al. (2015) Altered Right Ventricular Kinetic Energy Work Density and Viscous Energy Dissipation in Patients with Pulmonary Arterial Hypertension: A Pilot Study Using 4D Flow MRI. PLoS ONE 10(9): e0138365. doi:10.1371/journal.pone.0138365
Editor:Masataka Kuwana, Nippon Medical School Graduate School of Medicine, JAPAN
Received:April 18, 2015
Accepted:August 27, 2015
Published:September 29, 2015
Copyright:© 2015 Han et al. This is an open access article distributed under the terms of theCreative Commons Attribution License, which permits unrestricted use, distribution, and reproduction in any medium, provided the original author and source are credited.
Conclusion
This study has quantified two kinetic energy metrics to assess RV function using 4D flow. RV KE work density and PA viscous energy loss not only distinguished healthy subjects from patients, but also provided distinction amongst PAH patients. These metrics hold promise as imaging markers for RV function.
Introduction
The complex geometry and retrosternal location of the right ventricle (RV) confound accurate RV assessment by echocardiography. As a result, cine MRI is the reference standard for RV assessment due to its superior three-dimensional (3D) anatomy delineation and volume
calcu-lations [1–4]. RV structural changes occur in response to pulmonary vascular diseases such as
pulmonary arterial hypertension (PAH) and may improve in response to therapy [5–7].
How-ever, MRI structural parameters may lag behind clinical improvement [7], and there is a need
for the development of more sensitive and early imaging markers. Given that alterations of intracardiac and great vessel flow may precede RV structural changes, the dynamic assessment of complex intracardiac flow may be a promising tool to potentially improve prognosis and assessment of therapeutic efficacy. Nonetheless, a comprehensive approach to visualizing blood flow has remained a challenge due to the limited options for imaging RV flow. Recently, time-resolved 3D phase-contrast MRI (4D flow- as velocity is encoded in 3 dimensions and the
time dimension over the cardiac cycle is the 4thdimension) [8–12] has provided insights into a
number of complex flow patterns in congenital heart disease [13,14], aortic valve disease [15],
the disease of the aorta [16–18], and pulmonary hypertension[19–21].
Efforts have been made to develop quantitative parameters using 4D flow to study the heart and the great vessels. For example, Fredrikson et al. calculated kinetic energy of each of the four intracardiac flow components: direct flow, retained inflow, delayed ejection flow, and
residual volume [11]. In the great vessels, parameters such as total flow, peak systolic velocity,
and wall shear stress have shown excellent scan-rescan, inter-observer, and intra-observer
reproducibility [13]. In addition, Barker et al. compared various flow structures as well as wall
shear stress measurements measured using Cartesian- and radial-based 4D flow MRI
acquisi-tions, and found similar results.[21] The duration of vortex formation in the main pulmonary
artery (PA) was shown to allow accurate estimation of PA pressure and diagnose patients with
pulmonary hypertension. [12,20].
PA vortex formation increases fluid-mechanical losses and further increase cardiac after load. Thus, understanding the impact of flow abnormalities and their role in the loss of useful cardiac stroke work is important to elucidate the overall RV workload. This is especially rele-vant in the case of PAH, which often culminates in RV failure.
We propose to use 4D flow MRI to study kinetic energy efficiency of the RV and viscous energy loss in the PA of subjects with PAH. These two parameters can be calculated from the velocity data obtained in 4D flow and potentially can be used clinically to assess patients.
Materials and Methods
Study Population
Ten PAH subjects were recruited from the pulmonary hypertension clinic under the care of
one clinician. All were diagnosed based on mean pulmonary pressure25 mmHg measured
Funding:The study is funded by FOCUS Junior Faculty Award for Research in Women's
Cardiovascular Health funded by the Edna G. Kynett Memorial Foundation (to YH) and the Cardiovascular Medical Research and Education Fund (http://www. ipahresearch.org/)(to YH). The funders had no role in study design, data collection and analysis, decision to publish, or preparation of the manuscript.
by right heart catheterization [22]. Nine subjects were designated World Health Organization (WHO) Group 1 patients, and they were on at least one PAH-specific medication. One sub-ject, who was Group 4 (chronic thromboembolic pulmonary hypertension) prior to surgery, was not on any PAH-specific medication. PAH functional classes were accessed using the WHO class system, on the dates of their MRIs. Five patients, who had mild limitation in daily activities, were in functional class II and five patients, who had no limitation in daily activities, were in functional class I. Healthy subjects were recruited from the community and were free of cardiopulmonary disease and were not on any prescription medication. The study was approved by the local institutional review board and written consents were obtained from all subjects.
MRI Data Acquisition
The study population underwent cardiac MRI exams on a 1.5T Siemens scanner (Avanto, Sie-mens Health Systems, Germany). 2D cine short axis and long axis slices were acquired. No contrast agent was used during the scans. Cine data were obtained using steady state free
pro-cession imaging with the following parameter: TE = 1.1–1.3 ms, TR = 2.2–2.6 ms, matrix = 144–
192 x 192, field-of-view = 240–320 mm x 240–400 mm, BW = 930 Hz/pixel, phases = 30,
slices = 11–14, slice thickness = 8 mm, gap = 2 mm. Temporal resolution = 29.8 ± 7.0ms. The
average breath-hold duration was 12±3s.
The 4D flow data were acquired using a prospective ECG-gated 3D cine PC-MRI sequence covering the entire RA, RV, and the main pulmonary artery. Respiratory navigator gating were used to minimize motion artifacts. The scan parameters were: VENC = 125cm/s, flip angle = 8
degrees, voxel size = 2.5 x 2.5 x 2.5 mm3, bandwidth = 400Hz, and slab thickness of 60–70 mm.
Acquisition time was 17 to 25 minutes. Following the acquisition, the flow data were recon-structed into 13 to 21 time frames.
Cine Image Analysis
Cine MRI Images were imported into Argus Viewer (Siemens Health Care, Germany) and the endocardial contours were manually traced in diastole and systole for both LV and RV by an experienced observer. RV mass was obtained in end-systole by drawing epicardial contours on the RV, excluding the septum.
4D Flow Image Analysis
Background error removal (noise correction, anti-aliasing, and eddy-current correction) was
performed using in-house software [23] in MATLAB (Mathworks, Natick, MA).
Flow Visualization and Analysis
RV kinetic work density. Pathlines were emitted from the two planes from the first time frame to end-systole, tracing both forward and backward in time, encompassing a complete cardiac cycle. Each pathline is considered to represent a volume of blood corresponding to the voxel size. Flow through the tricuspid valve (TV) and pulmonic valve (PV) were calculated as
Q=R
cardiac cycle
R
valve(vn)ds dt, wherevis the velocity vector at the plane andnis the normal vector to the plane representing the TV or PV.
Kinetic energy through the TV and PV was calculated as
KE¼ ð systole or diastole ð valve 1 2r
v2ðvnÞdS dt; ð1Þ
wheredSis the differential area element the area of the valve,vis velocity of each blood particle
through the valve, andρ, the blood density, is taken to be 1.06 x 10³kg/m3. Total kinetic energy
input through tricuspid and pulmonic valves were calculated usingEq 1with diastolic and
sys-tolic durations as the integration limits. The integral was approximated using a trapezoidal
Rie-mann sum [24].
To assess the minimum kinetic energy of the heart as a system in equilibrium, we arrive at the following relation
RV KE work¼KEout KEin KEPRþKETR ð2Þ
where KEinand KEoutcorrespond to the kinetic energy coming in through the tricuspid valve
and out of the pulmonic valve, respectively; KEPRand KETRdenote the amount of kinetic
energy associated with pulmonic regurgitation and tricuspid regurgitation. Tricuspid
regurgi-tation velocity was not measured in this study because of high TR velocity. Assume KETR0,
the lower bound of kinetic work becomes KEout−KEin−KEPR(KEout, KEin, and KEPRwere
cal-culated in EnSight). RV KE work density is then defined as the minimum amount of kinetic
work required per stroke volume (SV) in a single cardiac cycle:
RV KE work density¼RV KE work
SV ð3aÞ
Thus, the lower bound of RV KE work density is established as:
RV KE work density KEout KEin KEPR
SV : ð3bÞ
PA viscous energy dissipation. We also analyzed the energy profile in the PA by assessing the irreversible loss of mechanical energy. Viscous dissipation, describing the conversion of mechanical energy into thermal energy per unit volume, was calculated as:
mv¼1
2m X i X j @vi @xj þ@vj
@xi
!
2
3ðrvÞdij
" #2
; ð4Þ
whereμis the blood viscosity,iandjdenotes the principal directionsx,yandz, andδijis the
Kronecker delta [25]. The viscous energy loss rate [26,27] can then be calculated as
E0
loss ¼
ð
Vol
The main PA was segmented by tracing regions of interest inside the vessel in all slices con-taining the vessel. The energy loss rate throughout the cardiac cycle was subsequently
calcu-lated using theEq 5in the segmented main PA, through numerical spatial derivatives.
Integrating E’loss_PAover the cardiac cycle gives us the total amount of kinetic energy loss in
the main PA, denoted by Eloss_PA. The percentage of energy loss in the total KE output can thus
be calculated by the ratio of totally dissipated energy and total KE output: Eloss_PA/KEout.
The initial observer repeated the complete series of placing the analysis planes, segmenta-tions, and calculations for three randomly chosen subjects (one health subject and two PAH patients). There was an interval of at least two weeks between the analyses. The results from the respective observations were analyzed using intraclass correlation (ICC).
Statistical Analysis
Measurements of energy and work density are expressed as mean ± standard deviation, unless
stated otherwise. Fisher’s exact test was used to test the significance of differences between the
two groups of subjects. Linear regression analysis was performed to test the significance of the
correlation between various RV measurements. Results with a p<0.05 were considered
statisti-cally significant.
Results
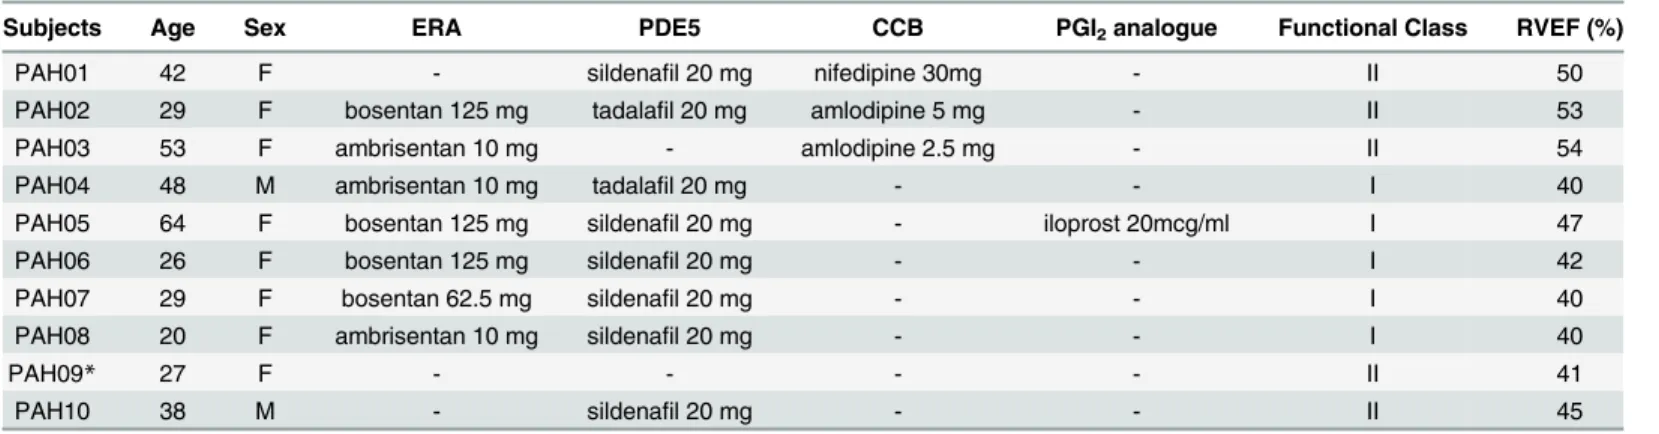
The demographics, relevant medications, and functional class of the ten PAH patients are listed inTable 1. Most patients had no recent pulmonary arterial pressure information by catheteri-zation or echocardiography. The median time interval between right heart cathetericatheteri-zation and MRI for the ten patients was 675.5 days with an interquartile range of [152.0, 1294.3] days. The
RV functional parameters of the healthy and PAH subjects are presented inTable 2. No
signifi-cant differences exist in age or gender. In PAH patients, the LV ejection fraction ranged between 53 to 72%, and the RV ejection fraction ranged between 40 and 54%. This is a group of relatively healthy PAH patients.
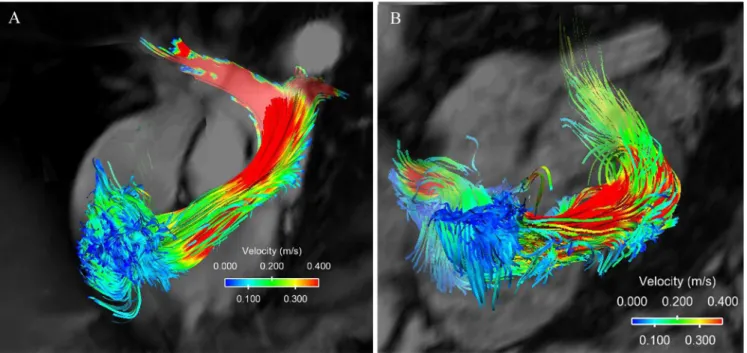
Pathline visualizations of a healthy subject and a PAH subject are shown inFig 1, and the
respective videos capturing the flow patterns over a complete cardiac cycle are available in the
supporting materials (S1andS2Videos). No significant difference was visualized pathlines
Table 1. PAH subject clinical characteristics and RV function.
Subjects Age Sex ERA PDE5 CCB PGI2analogue Functional Class RVEF (%)
PAH01 42 F - sildenafil 20 mg nifedipine 30mg - II 50
PAH02 29 F bosentan 125 mg tadalafil 20 mg amlodipine 5 mg - II 53
PAH03 53 F ambrisentan 10 mg - amlodipine 2.5 mg - II 54
PAH04 48 M ambrisentan 10 mg tadalafil 20 mg - - I 40
PAH05 64 F bosentan 125 mg sildenafil 20 mg - iloprost 20mcg/ml I 47
PAH06 26 F bosentan 125 mg sildenafil 20 mg - - I 42
PAH07 29 F bosentan 62.5 mg sildenafil 20 mg - - I 40
PAH08 20 F ambrisentan 10 mg sildenafil 20 mg - - I 40
PAH09* 27 F - - - - II 41
PAH10 38 M - sildenafil 20 mg - - II 45
Abbreviations: ERA = Endothelin receptor antagonists. PDE-5 = Phosphodiesterase Type 5 inhibitor. CCB = Calcium channel blocker. PGI2=
prostacyclin. All medications are taken in the usual dosing schedule. PAH09 was not on pulmonary hypertension specific medication due to chronic thromboembolic pulmonary hypertension before surgery.
between class I and class II patients. The PAH patient included inFig 1had the most represen-tative vortices, and was a class I patient. Healthy subjects have two similarly sized vortices underneath the tricuspid valve during diastole with consistent orientation, size and location in the RV. PAH subjects have much more complex flow features in the RV, with asymmetric vor-tices, and/or additional vortices. Healthy subjects show a laminar flow pattern inside the PA. PAH subjects with dilated PA show clear helical flow in the PA with vortices persist through systole and dissipate during diastole.
Table 2. Subject RV Functional Characteristics.
PAH (n = 10) Control (n = 9) p value
Gender (male, (%)) 2 (20) 3 (33.3) 0.27
Age (years) 48±14 30±13 0.14
BSA (m2) 1.9±0.37 1.70±0.21 0.85
RVEDV (ml) 181.8±73.9 173.2±33.3 0.38
RVEDVI (ml/m2) 96.4±26.5 99.9±15.8 0.32
RVESV (ml) 114.5±48.1 82.5±23.3 0.23
RVSV (ml) 80.3±29.1 93.1±17.7 0.15
RVEF (%) 45.2±5.5 52.9±6.2 0.01
RVM (g) 53.7±22.0 54.3±36.5 0.67
RVMI (g/m2) 31.1±11.3 28.5±17.4 0.29
Abbreviations: BSA = body surface area. RVEDV = right ventricular end-diastolic volume. RVEDVI = right ventricular end-diastolic volume indexed to BSA. RVESV = right ventricular end-systolic volume. RVSV = right ventricular stroke volume. RVEF = right ventricular ejection fraction. RVM = right ventricular mass. RVMI = right ventricular mass indexed to BSA.
doi:10.1371/journal.pone.0138365.t002
Fig 1. 4D flow patterns.(A) Flow pattern of a healthy subject in the right ventricle and the pulmolnary artery. The flow is laminar and is of relatively high velocity. (B) Flow pattern of a PAH patient with severe PA dilation where the vortices form in the PA and the flow velocities are lower.
Comparison of normalized kinetic energy between healthy subjects and PAH patients
through the tricuspid (KEin) and pulmonic valves (KEout) is shown inFig 2. Higher KE entered
into the RV and also left the RV in healthy subjects compared to PAH subjects. Healthy sub-jects showed significantly lower KE work density than PAH subsub-jects (61.7±14.8 mJ/mL vs. 94.7 ±33.7 mJ/mL, p = 0.007). RV KE work density did not correlate with age, sex, or functional
class, but negatively correlated with body surface area (Table 3). It did not correlate with any of
the RV functional measurements except for RVSV and RVEF, where moderate and mild
Fig 2. Comparison of the in flow kinetic energy and outflow kinetic energy in healthy subjects and PAH subjects.(A). Normalized KEinthrough the
tricupsid valve. (B). Normalized KEoutthrough the pulmonic valve.
doi:10.1371/journal.pone.0138365.g002
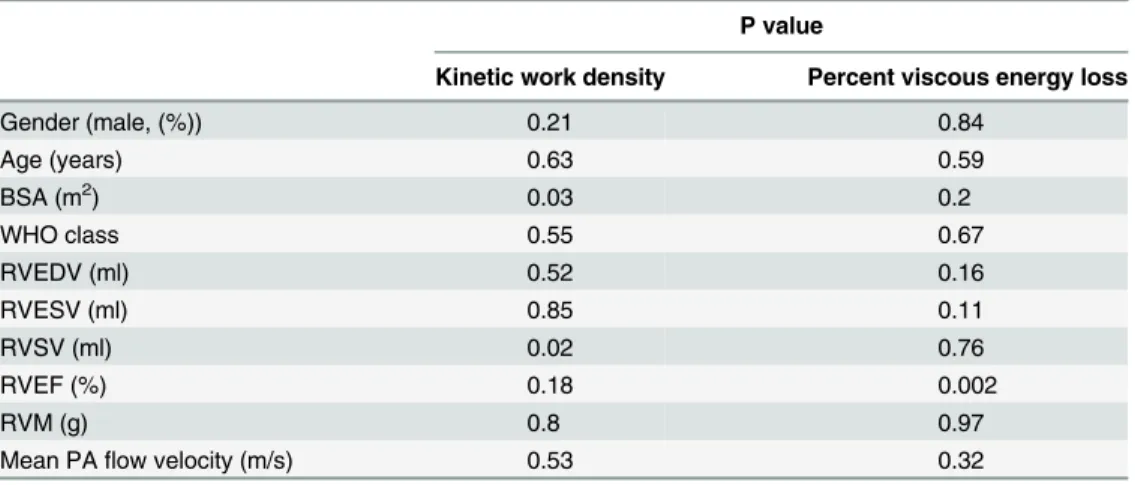
Table 3. Multivariate analysis of kinetic work density and percent viscous energy loss to demo-graphic and RV parameters.
P value
Kinetic work density Percent viscous energy loss
Gender (male, (%)) 0.21 0.84
Age (years) 0.63 0.59
BSA (m2) 0.03 0.2
WHO class 0.55 0.67
RVEDV (ml) 0.52 0.16
RVESV (ml) 0.85 0.11
RVSV (ml) 0.02 0.76
RVEF (%) 0.18 0.002
RVM (g) 0.8 0.97
Mean PAflow velocity (m/s) 0.53 0.32
Abbreviations: BSA = body surface area. RVEDV = right ventricular end-diastolic volume. RVEDVI = right ventricular end-diastolic volume indexed to BSA. RVESV = right ventricular end-systolic volume. RVSV = right ventricular stroke volume. RVEF = right ventricular ejection fraction. RVM = right ventricular mass. RVMI = right ventricular mass indexed to BSA.
correlations are found (Fig 3A). Note that RV KE work density is dependent on RVSV, by
defi-nition (Eqs3aand3b). Lastly, RV KE work density did not correlate mean PA flow velocity.
The total amount of viscous energy loss in the MPA was higher in patients during all phases
of the cardiac cycle, shown inFig 4A. The percentage of kinetic energy loss in the total kinetic
energy output in PAH subjects is significantly greater than that in healthy subjects (121.1
±6.4% vs. 2.2±1.3%, p = 0.0001) as shown inFig 4B. Percent viscous energy loss was not
corre-lated with any of the demographic or clinical parameters (Table 3), but it was moderately
corre-lated with RVEF (Fig 3B).
Fig 3. Comparison of kinetic energy density and viscous energy loss in PAH and healthy subjects.A. Healthy subjects showed significantly lower RV KE density than PAH patients (61.7±14.8 mJ/mL vs. 94.7±33.7 mJ/mL, p = 0.007). Linear regression of RV KE density against RVEF for both populations
gives result: y = -1.47x + 152.00, R² = 0.11. B. Healthy subjects showed significantly lower percent viscous energy loss than PAH patients (2.2±1.3% vs. 21.1 ±6.4%, p = 0.0001). Linear regression of percent viscous energy loss against RVEF for both populations gives result: y = -1.05x + 63.82, R² = 0.41.
doi:10.1371/journal.pone.0138365.g003
Fig 4. Comparing viscous energy loss in healthy subjects and patients with pulmonary arterial hypertension.(A) The amount of viscous energy loss is higher in patients throughout the cardiac cycle. (B) The percent viscous energy loss is significantly greater in PAH patients than in healthy subjects (21.1
±6.4% vs. 2.2±1.3%, p = 0.0001).
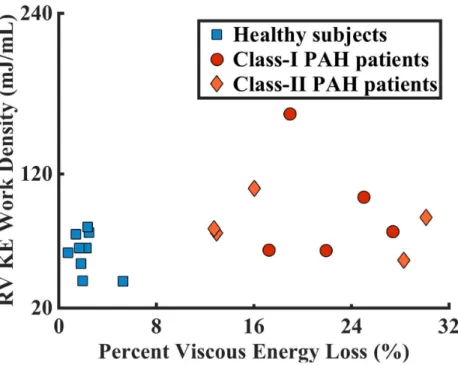
Plotting the percent viscous energy loss against the RV KE work density clearly separates
healthy subjects from the PAH patients (Fig 5). Healthy subjects congregate in the region with
low work density and low percent viscous energy loss, whereas the PAH patients were widely distributed on the graph. Regressing work density against percent viscous energy loss for the whole study population showed no correlation (p = 0.10); the congregated and scattered distri-bution of the two populations also do not show correlations between these two parameters (p = 0.26 for healthy subjects and p = 0.24 for PAH patients).
The consistency of agreement of KE work density and percent viscous energy loss in the randomly chosen subjects was high, 0.990 and 0.995 respectively, based on ICC analysis.
Discussion
Studies have shown the importance of RV functional measurements in determining PAH
patients’prognosis and response to treatments [5,28,29]. MRI has a increasing role in
assess-ing PAH patients [30]. We observed a significant increase in RV KE work density and a
signifi-cant increase in percent viscous energy loss in the PA in PAH patients compared to normal subjects. These two metrics not only distinguished healthy subjects from patients, but also pro-vided distinction amongst PAH patients, which might provide new insight over the conven-tional MRI parameters of the RV.
In previous 4D flow studies, ventricular flow has been categorized into four components
and each flow component has been characterized in normal subjects [11]. It is estimated that
44 ± 6% of flow from normal subjects is direct flow, that is flow that comes in and goes out in
the same cardiac cycle [11]. This quantification requires detailed segmentations of the RV and
intensive computation, which is not easily feasible for larger number of patients. We took a dif-ferent approach for energy estimation. We considered the RV as a system under steady state conditions during which the volume of the ventricle stays constant from one cardiac cycle to the next, and estimated kinetic energy input and output of the system over a complete cardiac
Fig 5. RV KE density and percent viscous energy loss together separated the PAH subjects from the healthy controls.In addition, PAH patients within the same functional classes had a wide distribution.
cycle based on the first law of thermodynamics. Sources of RV KE input include flow from the right atrium through the tricuspid valve and pulmonic regurgitation, while output includes output through the pulmonic valve and tricuspid regurgitation. Tricuspid regurgitation was not measured due to the high velocity encoding range that is needed to accurately capture the regurgitant jets. Part of the work done by the RV also includes the movement of the RV end systolic volume, which we did not account for in this study. Therefore, we estimated the lower bound of RV work. Despite these omissions for RV work using simplified estimations, lower bound of RV KE work density may still be helpful to assess the energetic work of the RV. Direct flow is visually diminished in PAH subjects in our cohort, which we suspect contribute to the higher RV KE work density.
Blood is a viscous fluid and viscosity is an intrinsic property of a fluid that gives rise to the
development of viscous shear stresses inside the flow [31]. Energy dissipation due to viscous
stresses transforms mechanical energy in fluids to thermal energy. Vortices are common intra-cardiac flow features. Vortices developed in the cardiovascular system play fundamental roles in the normal physiology, but the formation of unnatural vortices may alter the momentum
transfer in the blood flow and increase energy dissipation [31]. We observed diastolic vortex
formation pattern in the RV in healthy subjects is similar with the observed LV filling pattern
observed by others [32]. The diastolic vortices are altered in some PAH subjects with additional
vortices formed toward the apex of the RV or with asymmetrical vortices (Fig 1B), which
sug-gest abnormal energy dissipation.
In PAH and other high after-load pulmonary hypertensive conditions, the markedly altered
PA flow has long been recognized by Doppler echocardiography [33]. The Doppler‘notching’
relates to the pulmonary artery flow deceleration, as a result of early arrival of reflected waves
from high pulmonary artery impedance [34,35]. This abnormal flow pattern is associated with
greater degrees of RV dysfunction and is not present in pulmonary hypertension conditions where the pulmonary vascular resistance is relatively normal. The vortices formed in the main pulmonary artery has been studied in pulmonary hypertension by 4D flow, and are mostly found to be pathological and the persistence of it is related to elevated pulmonary arterial pres-sure [12,19].
Some recent studies have attempted to calculate energy loss using 4D flow in different dis-ease states. Barker et al. studied viscous energy loss in the thoracic and ascending aorta at peak systole, and found that to be significantly elevated in patients with dilated aortas as well as in
cases of aortic stenosis [27]. Lee et al. studied the rates of pressure-flow and KE transferred
between the branch PA and the MPA, as well as flow resistance due to MPA bifurcation, also
relations derived from the Navier—Stokes equations. They showed that patients with
congeni-tal heart disease had considerably increased energy loss in the branch PAs compared to normal
subject with normal PA physiology [36]. Besides energy loss, a modification in the 4D flow
technique with asymmetrical 4-point motion encoding has allowed measurement of irrevers-ible pressure loss through characterization of turbulent KE (34).
In our study, percent viscous energy loss in the PA is small in healthy subjects, but is almost an order of magnitude greater in PAH subjects. The increase in PA energy loss in the PAH sub-jects due to the vortex formation results in the decrease in mechanical energy available for the system, thus leads to elevated RV kinetic energy load. Note that the estimation was performed only in the MPA, a rather small portion of the overall pulmonary system. Thus, the actual loss is expected to be larger than calculated in our study.
Combining lower bound of RV kinetic energy work density and lower bound of percent vis-cous energy dissipation measurements, we observe a clear differentiation among PAH subjects
who are clinically in the same functional class, as shown inFig 5. This is especially relevant
patient’s functional capacity and survival [6]. These two metrics lead us to hypothesize that the patient with the highest RV kinetic energy work density and the highest viscous energy dissipa-tion might not do well over time and might require escaladissipa-tion of therapy sooner. The scatter plot of these two parameters showed congregated distribution in the healthy population and dispersed distribution in the PAH population. Factors such as the geometry of RV, the complex flow movements inside the RV, energy loss through viscous dissipation, and many others, may contribute different degrees to the increase of work density in PAH patients; thus work density does not directly correlate with any one of these factors alone.
There are limitations in this study in addition to a small sample size. Due to the large data set, the time frames taken did not cover the complete cardiac cycle for a few bradycardiac healthy subjects, which were compensated by extending the existing data to a complete cycle
using linear interpolating techniques. Thus, the actual KEInmight potentially be greater for
these healthy subjects and the actual KE work density is consequently lower. The median time
of MRI is nearly two years after RHC, thus we weren’t able to reliably investigate the correlation
between hemodynamic data and our analysis. The functional classes used in these analyses were accessed at the time of the MRI. Three patients have comorbid diseases. One patient had sys-temic sclerosis, but was still working full time; one patient has a restrictive membranous VSD; and one has a secundum ASD that was closed 8 months prior to imaging. With these small numbers, we are unable to assess the impact of these conditions on the results of our study.
In summary, we have quantified two kinetic energy metrics to assess RV function, namely, the lower bound of kinetic energy work density of the RV and lower bound of the percent vis-cous energy dissipation in the PA, which are solely based on imaging blood volume and veloc-ity. Our work has introduced a quantitative framework and metrics to analyze large amount of data from 4D flow imaging. Our next steps are to evaluate the clinical relevance of these metrics in longer follow-ups and larger patient population. We expect that these measurements will enable a more sensitive assessment of the RV function and its response to treatment, as com-pared to conventional MRI volumetric measurements.
Supporting Information
S1 Video. Pathline visualizations of a healthy subject over the complete cardiac cycle.
(MOV)
S2 Video. Pathline visualization of a PAH subject over the complete cardiac cycle.
(MOV)
Acknowledgments
The study is funded by FOCUS Junior Faculty Award for Research in Women's Cardiovascular
Health”funded by the Edna G. Kynett Memorial Foundation (to YH) and Cardiovascular
Medical Research and Education Fund (to YH).
Author Contributions
References
1. Haddad F, Couture P, Tousignant C, Denault AY. The right ventricle in cardiac surgery, a perioperative perspective: I. Anatomy, physiology, and assessment. Anesth Analg. 2009; 108(2):407–21. Epub 2009/01/20. doi:10.1213/ane.0b013e31818f8623108/2/407 [pii]. PMID:19151264.
2. Grothues F, Moon JC, Bellenger NG, Smith GS, Klein HU, Pennell DJ. Interstudy reproducibility of right ventricular volumes, function, and mass with cardiovascular magnetic resonance. Am Heart J. 2004; 147(2):218–23. Epub 2004/02/05. doi:10.1016/j.ahj.2003.10.005S0002870303007117 [pii]. PMID: 14760316.
3. Catalano O, Antonaci S, Opasich C, Moro G, Mussida M, Perotti M, et al. Intra-observer and interob-server reproducibility of right ventricle volumes, function and mass by cardiac magnetic resonance. J Cardiovasc Med (Hagerstown). 2007; 8(10):807–14. Epub 2007/09/22. doi:10.2459/JCM.
0b013e32801105ef01244665-200710000-00007 [pii]. PMID:17885519.
4. Maceira AM, Prasad SK, Khan M, Pennell DJ. Reference right ventricular systolic and diastolic function normalized to age, gender and body surface area from steady-state free precession cardiovascular magnetic resonance. Eur Heart J. 2006; 27(23):2879–88. Epub 2006/11/08. ehl336 [pii] doi:10.1093/ eurheartj/ehl336PMID:17088316.
5. van de Veerdonk MC, Kind T, Marcus JT, Mauritz GJ, Heymans MW, Bogaard HJ, et al. Progressive right ventricular dysfunction in patients with pulmonary arterial hypertension responding to therapy. J Am Coll Cardiol. 2011; 58(24):2511–9. Epub 2011/12/03. S0735-1097(11)03336-5 [pii] doi:10.1016/j. jacc.2011.06.068PMID:22133851.
6. Vonk-Noordegraaf A, Haddad F, Chin KM, Forfia PR, Kawut SM, Lumens J, et al. Right heart adapta-tion to pulmonary arterial hypertension: physiology and pathobiology. J Am Coll Cardiol. 2013; 62(25 Suppl):D22–33. Epub 2013/12/21. doi:10.1016/j.jacc.2013.10.027S0735-1097(13)05870-1 [pii]. PMID:24355638.
7. Peacock AJ, Crawley S, McLure L, Blyth K, Vizza CD, Poscia R, et al. Changes in right ventricular func-tion measured by cardiac magnetic resonance imaging in patients receiving pulmonary arterial hyper-tension-targeted therapy: the EURO-MR study. Circ Cardiovasc Imaging. 2014; 7(1):107–14. Epub 2013/11/01. doi:10.1161/CIRCIMAGING.113.000629CIRCIMAGING.113.000629 [pii]. PMID: 24173272.
8. Bolger AF, Heiberg E, Karlsson M, Wigstrom L, Engvall J, Sigfridsson A, et al. Transit of blood flow through the human left ventricle mapped by cardiovascular magnetic resonance. J Cardiovasc Magn Reson. 2007; 9(5):741–7. Epub 2007/09/25. 782019881 [pii] doi:10.1080/10976640701544530PMID: 17891610.
9. Eriksson J, Carlhall CJ, Dyverfeldt P, Engvall J, Bolger AF, Ebbers T. Semi-automatic quantification of 4D left ventricular blood flow. J Cardiovasc Magn Reson. 2010; 12:9. Epub 2010/02/16. 1532-429X-12-9 [pii] doi:10.1186/1532-429X-12-9PMID:20152026; PubMed Central PMCID: PMC2831022.
10. Eriksson J, Dyverfeldt P, Engvall J, Bolger AF, Ebbers T, Carlhall CJ. Quantification of presystolic blood flow organization and energetics in the human left ventricle. Am J Physiol Heart Circ Physiol. 2011; 300(6):H2135–41. Epub 2011/03/23. ajpheart.00993.2010 [pii] doi:10.1152/ajpheart.00993. 2010PMID:21421820.
11. Fredriksson AG, Zajac J, Eriksson J, Dyverfeldt P, Bolger AF, Ebbers T, et al. 4-D blood flow in the human right ventricle. Am J Physiol Heart Circ Physiol. 2011; 301(6):H2344–50. Epub 2011/09/20. doi: 10.1152/ajpheart.00622.2011ajpheart.00622.2011 [pii]. PMID:21926347.
12. Reiter G, Reiter U, Kovacs G, Kainz B, Schmidt K, Maier R, et al. Magnetic resonance-derived 3-dimen-sional blood flow patterns in the main pulmonary artery as a marker of pulmonary hypertension and a measure of elevated mean pulmonary arterial pressure. Circ Cardiovasc Imaging. 2008; 1(1):23–30. Epub 2008/07/01. 1/1/23 [pii] doi:10.1161/CIRCIMAGING.108.780247PMID:19808511.
13. Markl M, Wallis W, Harloff A. Reproducibility of flow and wall shear stress analysis using flow-sensitive four-dimensional MRI. J Magn Reson Imaging. 2011; 33(4):988–94. Epub 2011/03/31. doi:10.1002/ jmri.22519PMID:21448968.
14. Geiger J, Markl M, Jung B, Grohmann J, Stiller B, Langer M, et al. 4D-MR flow analysis in patients after repair for tetralogy of Fallot. Eur Radiol. 2011; 21(8):1651–7. Epub 2011/07/02. doi: 10.1007/s00330-011-2108-4PMID:21720942.
15. Barker AJ, Markl M, Burk J, Lorenz R, Bock J, Bauer S, et al. Bicuspid aortic valve is associated with altered wall shear stress in the ascending aorta. Circ Cardiovasc Imaging. 2012; 5(4):457–66. Epub 2012/06/26. doi:10.1161/CIRCIMAGING.112.973370CIRCIMAGING.112.973370 [pii]. PMID: 22730420.
17. Nordmeyer S, Riesenkampff E, Crelier G, Khasheei A, Schnackenburg B, Berger F, et al. Flow-sensi-tive four-dimensional cine magnetic resonance imaging for offline blood flow quantification in multiple vessels: a validation study. J Magn Reson Imaging. 2010; 32(3):677–83. Epub 2010/09/04. doi:10. 1002/jmri.22280PMID:20815066.
18. Frydrychowicz A, Markl M, Hirtler D, Harloff A, Schlensak C, Geiger J, et al. Aortic hemodynamics in patients with and without repair of aortic coarctation: in vivo analysis by 4D flow-sensitive magnetic res-onance imaging. Invest Radiol. 2011; 46(5):317–25. Epub 2011/02/03. doi:10.1097/RLI.
0b013e3182034fc2PMID:21285892.
19. Reiter U, Reiter G, Kovacs G, Stalder AF, Gulsun MA, Greiser A, et al. Evaluation of elevated mean pul-monary arterial pressure based on magnetic resonance 4D velocity mapping: comparison of visualiza-tion techniques. PLoS One. 2013; 8(12):e82212. Epub 2013/12/19. doi:10.1371/journal.pone.0082212 PONE-D-13-26171 [pii]. PMID:24349224; PubMed Central PMCID: PMC3861394.
20. Reiter G, Reiter U, Kovacs G, Olschewski H, Fuchsjager M. Blood flow vortices along the main pulmo-nary artery measured with MR imaging for diagnosis of pulmopulmo-nary hypertension. Radiology. 2015; 275 (1):71–9. Epub 2014/11/06. doi:10.1148/radiol.14140849PMID:25372980.
21. Barker AJ, Roldan-Alzate A, Entezari P, Shah SJ, Chesler NC, Wieben O, et al. Four-dimensional flow assessment of pulmonary artery flow and wall shear stress in adult pulmonary arterial hypertension: results from two institutions. Magn Reson Med. 2015; 73(5):1904–13. Epub 2014/07/01. doi:10.1002/ mrm.25326PMID:24974951; PubMed Central PMCID: PMC4277737.
22. Simonneau G, Gatzoulis MA, Adatia I, Celermajer D, Denton C, Ghofrani A, et al. Updated clinical clas-sification of pulmonary hypertension. J Am Coll Cardiol. 2013; 62(25 Suppl):D34–41. Epub 2013/12/21. doi:10.1016/j.jacc.2013.10.029S0735-1097(13)05872-5 [pii]. PMID:24355639.
23. Bock J KB, Hennig J, Markl M. Optimized pre-processing of time-resolved 2D and 3D Phase Contrast MRI data. Proc 15th Sci Meet ISMRM; Berline, Germany2007. p. 3138.
24. Stewart J. Calculus: Early Transcendentals. 6th ed. Belmont, CA: Thomson Brooks/Cole; 2008.
25. Bryon Bird R. WESE. Transport Phenomena. 2nd ed. New York: John Wiley & Sons, Inc.; 2007.
26. Venkatachari AK, Halliburton SS, Setser RM, White RD, Chatzimavroudis GP. Noninvasive quantifica-tion of fluid mechanical energy losses in the total cavopulmonary connecquantifica-tion with magnetic resonance phase velocity mapping. Magn Reson Imaging. 2007; 25(1):101–9. Epub 2007/01/16. S0730-725X(06) 00340-7 [pii] doi:10.1016/j.mri.2006.09.027PMID:17222721.
27. Barker AJ, van Ooij P, Bandi K, Garcia J, Albaghdadi M, McCarthy P, et al. Viscous energy loss in the presence of abnormal aortic flow. Magn Reson Med. 2013. Epub 2013/10/15. doi:10.1002/mrm.24962 PMID:24122967.
28. Forfia PR, Fisher MR, Mathai SC, Housten-Harris T, Hemnes AR, Borlaug BA, et al. Tricuspid annular displacement predicts survival in pulmonary hypertension. Am J Respir Crit Care Med. 2006; 174 (9):1034–41. Epub 2006/08/05. 200604-547OC [pii] doi:10.1164/rccm.200604-547OCPMID: 16888289.
29. van Wolferen SA, Marcus JT, Boonstra A, Marques KM, Bronzwaer JG, Spreeuwenberg MD, et al. Prognostic value of right ventricular mass, volume, and function in idiopathic pulmonary arterial hyper-tension. Eur Heart J. 2007; 28(10):1250–7. Epub 2007/01/24. ehl477 [pii] doi:10.1093/eurheartj/ehl477 PMID:17242010.
30. Peacock AJ, Vonk Noordegraaf A. Cardiac magnetic resonance imaging in pulmonary arterial hyper-tension. Eur Respir Rev. 2013; 22(130):526–34. Epub 2013/12/03. doi:10.1183/09059180.00006313 22/130/526 [pii]. PMID:24293468.
31. Kheradvar A, Assadi R, Falahatpisheh A, Sengupta PP. Assessment of transmitral vortex formation in patients with diastolic dysfunction. J Am Soc Echocardiogr. 2012; 25(2):220–7. Epub 2011/11/22. doi: 10.1016/j.echo.2011.10.003S0894-7317(11)00761-9 [pii]. PMID:22099070.
32. Charonko JJ, Kumar R, Stewart K, Little WC, Vlachos PP. Vortices formed on the mitral valve tips aid normal left ventricular filling. Ann Biomed Eng. 2013; 41(5):1049–61. Epub 2013/02/08. doi:10.1007/ s10439-013-0755-0PMID:23389556.
33. Arkles JS, Opotowsky AR, Ojeda J, Rogers F, Liu T, Prassana V, et al. Shape of the right ventricular Doppler envelope predicts hemodynamics and right heart function in pulmonary hypertension. Am J Respir Crit Care Med. 2011; 183(2):268–76. Epub 2010/08/17. 201004-0601OC [pii] doi:10.1164/ rccm.201004-0601OCPMID:20709819.
34. Weyman AE, Dillon JC, Feigenbaum H, Chang S. Echocardiographic patterns of pulmonic valve motion with pulmonary hypertension. Circulation. 1974; 50(5):905–10. Epub 1974/11/01. PMID:4430093. 35. Tahara M, Tanaka H, Nakao S, Yoshimura H, Sakurai S, Tei C, et al. Hemodynamic determinants of