HESSD
4, 2521–2560, 2007River Meuse discharge change
during the late Holocene
P. J. Ward et al.
Title Page
Abstract Introduction
Conclusions References
Tables Figures
◭ ◮
◭ ◮
Back Close
Full Screen / Esc
Printer-friendly Version
Interactive Discussion Hydrol. Earth Syst. Sci. Discuss., 4, 2521–2560, 2007
www.hydrol-earth-syst-sci-discuss.net/4/2521/2007/ © Author(s) 2007. This work is licensed
under a Creative Commons License.
Hydrology and Earth System Sciences Discussions
Papers published inHydrology and Earth System Sciences Discussionsare under open-access review for the journalHydrology and Earth System Sciences
Strong increases in flood frequency and
discharge of the River Meuse over the late
Holocene: impacts of long-term
anthropogenic land use change and
climate variability
P. J. Ward1, H. Renssen1, J. C. J. H. Aerts2, R. T. van Balen1, and J. Vandenberghe1
1
Institute of Earth Sciences, Faculty of Earth and Life Sciences, Vrije Universiteit Amsterdam, De Boelelaan 1085, 1081 HV Amsterdam, The Netherlands
2
Institute for Environmental Studies, Faculty of Earth and Life Sciences, Vrije Universiteit Amsterdam, De Boelelaan 1085, 1081 HV Amsterdam, The Netherlands
Received: 1 August 2007 – Accepted: 1 August 2007 – Published: 6 August 2007
Correspondence to: P. J. Ward ([email protected])
HESSD
4, 2521–2560, 2007River Meuse discharge change
during the late Holocene
P. J. Ward et al.
Title Page
Abstract Introduction
Conclusions References
Tables Figures
◭ ◮
◭ ◮
Back Close
Full Screen / Esc
Printer-friendly Version
Interactive Discussion Abstract
In recent years the frequency of high-flow events on the Meuse (northwest Europe) has been relatively great, and flooding has become a major research theme. To date, research has focused on observed discharge records of the last century and simula-tions of the coming century. However, it is difficult to delineate changes caused by 5
human activities (land use change and greenhouse gas emissions) and natural fluc-tuations on these timescales. To address this problem we coupled a climate model (ECBilt-CLIO-VECODE) and a hydrological model (STREAM) to simulate daily Meuse discharge in two time-slices: 4000–3000 BP (natural situation), and 1000–2000 AD (includes anthropogenic influence). For 4000–3000 BP the basin is assumed to be 10
almost fully forested; for 1000–2000 AD we reconstructed land use based on historical sources. For 1000–2000 AD the simulated mean annual discharge (260.9 m3s−1) is significantly higher than for 4000–3000 BP (244.8 m3s−1), and the frequency of large high-flow events (discharge>3000 m3s−1
) is higher (recurrence time decreases from 77 to 65 years). On a millennial timescale almost all of this increase can be ascribed to 15
land use changes (especially deforestation); the effects of climatic change are insignif-icant. For the 20th Century, the simulated mean discharge (270.0 m3s−1) is higher than in any other century studied, and is ca. 2.5% higher than in the 19th Century (despite an increase in evapotranspiration). Furthermore, the recurrence time of large high-flow events is almost twice as short as under natural conditions (recurrence time 20
decreases from 77 to 40 years). On this timescale climate change (strong increase in annual and winter precipitation) overwhelmed land use change as the dominant forcing mechanism.
1 Introduction
In recent years the frequency of high-flow events in the Meuse basin (northwest Eu-25
rope) (Fig. 1) has been relatively great compared to the rest of the 20th Century. As
HESSD
4, 2521–2560, 2007River Meuse discharge change
during the late Holocene
P. J. Ward et al.
Title Page
Abstract Introduction
Conclusions References
Tables Figures
◭ ◮
◭ ◮
Back Close
Full Screen / Esc
Printer-friendly Version
Interactive Discussion a result, flooding and flood mitigation have become major research themes. Hence,
numerous studies have been carried out to examine hydrological and climatological changes in the basin.
Observed discharge time-series for the Meuse at Borgharen (Fig. 1) show no signif-icant changes in annual or monthly mean discharge over the 20th Century (Tu, 2006). 5
However, increasing trends (albeit statistically insignificant) are detected for annual and winter maximum daily discharge (De Wit et al., 2001). Furthermore, change-point analyses suggest significant increases in annual and winter maximum daily discharge around 1984 (Pfister et al., 2000; Tu, 2006). Similar results are found for numerous Meuse tributaries (Tu, 2006). This increase in the frequency of high-flow events may 10
be related to an increase in annual precipitation totals and the frequency of very wet days in the winter since 1980, due to the fluctuation of large-scale atmospheric circu-lation (Bouwer et al., 2006) and a strengthened North Atlantic Oscilcircu-lation (Tu, 2006). Increased precipitation totals and intensity in the second half of the 20th Century, re-lated to variations in atmospheric circulation, have been observed in the Netherlands 15
and Luxembourg (Pfister et al., 2000).
Climate modelling results suggest that average temperatures and winter precipitation depths in the Meuse basin will increase in the 21st Century, whilst summer precipitation will decrease (De Wit et al., 2007; Kwadijk and Rotmans, 1995; Pfister et al., 2004; Van Deursen, 2000). Based on hydrological modelling, De Wit et al. (2001) suggest that 20
mean annual discharge will remain relatively stable over the 21st Century, whilst Booij (2005) suggests a slight decrease. The seasonal distribution of discharge may change so that winter discharge becomes greater and summer discharge lower (De Wit et al., 2007). These and other studies, however, suggest that the anticipated climate change of the 21st Century will lead to an increase in flood frequency (Bultot et al., 1988; 25
Gellens and Roulin, 1998; Middelkoop and Parmet, 1998; Van Deursen, 2000).
Discharge, however, depends not only on climate but also on land use. Little re-search has been carried out to examine the effects of land use change in the basin because the forested area has remained relatively stable at the basin-scale over the
HESSD
4, 2521–2560, 2007River Meuse discharge change
during the late Holocene
P. J. Ward et al.
Title Page
Abstract Introduction
Conclusions References
Tables Figures
◭ ◮
◭ ◮
Back Close
Full Screen / Esc
Printer-friendly Version
Interactive Discussion last century (Knol et al., 2004; Tu, 2006). Ashagrie et al. (2006) and Tu (2006) found no
evidence to suggest that land use changes in the 20th Century have had a significant effect on Meuse discharge.
The aforementioned studies have examined either the discharge changes of the last century, or used hydrological models calibrated against observations for that period. 5
However, when studying long-term discharge changes this approach is problematic. Firstly, accurate daily measurements of Meuse discharge have only been made since 1911, which is too short to evaluate long-term climatic changes (Jones, 2000). Sec-ondly, at a basin-scale the forested area has been relatively stable over the last century, making it difficult to assess the effects of large-scale changes in land use.
10
Palaeodischarge modelling provides a means to address the lack of long-term ob-served data by providing a dataset for the validation of model response on millennial timescales. This enables us to simulate the response of discharge to changes in cli-mate over longer timescales, and to more extensive changes in land use. However, palaeodischarge modelling is in its infancy. For example, Coe and Harrison (2002) 15
used runoffderived directly from a General Circulation Model (GCM), combined with a river routing algorithm, to simulate lake-level changes in Africa at ca. 6 ka BP. At the basin-scale, however, the use of runoffderived directly from GCMs has a disad-vantage as runoff output are less well resolved than climatic output. To address this problem, Aerts et al. (2006) and Ward et al. (2007) coupled a climate model and a hy-20
drological model to simulate the Holocene discharge of 19 rivers around the globe on a monthly time-step; the modeled discharges correspond well with multi-proxy records of palaeodischarge.
The aim of this paper is to examine the sensitivity of Meuse discharge to long-term changes in Holocene climate and land use. This is achieved using the modelling ap-25
proach of Aerts et al. (2006) and Ward et al. (2007), but with a daily time-step and higher spatial resolution. Meuse discharge is simulated for two time-slices: 4000–3000 BP and 1000–2000 AD. The period 4000–3000 AD is selected as a natural reference period since the natural climatic forcings were broadly similar to those of today, whilst
HESSD
4, 2521–2560, 2007River Meuse discharge change
during the late Holocene
P. J. Ward et al.
Title Page
Abstract Introduction
Conclusions References
Tables Figures
◭ ◮
◭ ◮
Back Close
Full Screen / Esc
Printer-friendly Version
Interactive Discussion human influence on land use was minimal (Bunnik, 1995; Gotj ´e et al., 1990; RWS
Limburg/IWACO, 2000). The period 1000–2000 AD was heavily influenced by human activities, namely changes in land use throughout the period, and greenhouse gas emissions since the industrial revolution. By comparing the changes in discharge char-acteristics between these two situations we can examine the effects of anthropogenic 5
changes in climate and land use.
2 Study area
The Meuse is a predominantly rain-fed river with a total length of ca. 875 km. For this study the basin has been modelled upstream from Borgharen (Fig. 1).
Mean annual precipitation over the basin is ca. 950 mm a−1, and is reasonably evenly 10
distributed throughout the year. The spatial distribution of precipitation is to a large ex-tent a reflection of elevation and distance from the coast. Mean temperatures show marked seasonal variations, and annual potential evapotranspiration is much greater in the summer half-year (May–October) than in the winter half-year (November–April) (76% and 24% of the total respectively) (Ashagrie et al., 2006). The mean annual dis-15
charge of the Meuse and its associated canals at the border of Belgium and the Nether-lands is ca. 276 m3s−1; summer and winter half-year mean discharges are 146 m3s−1 and 406 m3s−1respectively (Ashagrie et al., 2006).
3 Methods and approach
In this study we couple the climate model ECBilt-CLIO-VECODE (Brovkin et al., 20
2002; Goosse and Fichefet, 1999; Opsteegh et al., 1998) with the hydrological model STREAM (Aerts et al., 1999) to simulate Meuse palaeodischarge. The hydrological model is run with a daily time-step and spatial resolution of 2′×2′(ca. 2.4 km×3.7 km).
In this section we present the main features of the model; for a more detailed discussion
HESSD
4, 2521–2560, 2007River Meuse discharge change
during the late Holocene
P. J. Ward et al.
Title Page
Abstract Introduction
Conclusions References
Tables Figures
◭ ◮
◭ ◮
Back Close
Full Screen / Esc
Printer-friendly Version
Interactive Discussion see Ward (2007).
3.1 Models and climate forcing parameters
ECBilt-CLIO-VECODE is a three-dimensional coupled climate model consisting of three components describing the atmosphere, ocean and vegetation (Brovkin et al., 2002; Goosse and Fichefet, 1999; Opsteegh et al., 1998). The output used in this 5
study are derived from a transient run, forced by annually varying orbital parameters and atmospheric greenhouse gas concentrations (CO2and CH4) following Renssen et
al. (2005), and atmospheric volcanic aerosol content and fluctuations in solar activity following Goosse et al. (2005). The model was run in ensemble mode, with 4 ensem-ble members. Each ensemensem-ble member represents a single model run. The ensemensem-ble 10
members are forced using the same climatic parameters, but with slightly different ini-tial climatic conditions to account for the chaotic behaviour of the atmospheric system. Hence, the difference between the ensemble members gives an idea of the natural variability, whereas an ensemble mean can be used to evaluate long-term trends.
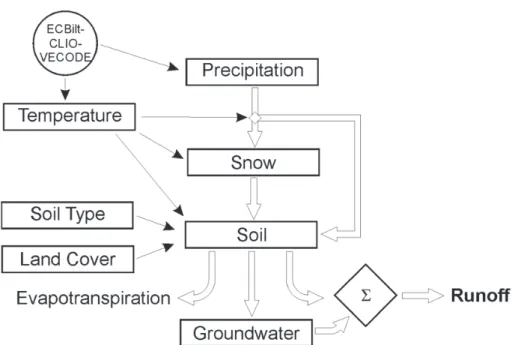
STREAM is a grid-based spatially distributed water balance model that describes the 15
hydrological cycle of a drainage basin as a series of storage compartments and flows (Aerts et al., 1999). It is based on the RHINEFLOW model of Kwadijk (1993). STREAM calculates the water balance per grid cell using the Thornthwaite (1948) equations for potential evapotranspiration and the Thornthwaite and Mather (1957) equations for actual evapotranspiration. The main flows and storage compartments used to calculate 20
water availability per cell are shown in Fig. 2.
In this study, STREAM is run at a spatial resolution of 2′×2′; this is high enough to
capture the dominant processes in the basin (Booij, 2002), whilst pragmatic concerns regarding computational time render a higher resolution unfeasible. Since we will be running STREAM on a daily time-step, as opposed to the monthly or 10-day time-step 25
used in previous applications, we have added a simple threshold-based direct runoff component to simulate infiltration excess overland flow. When precipitation exceeds a threshold (Ward and Robinson, 1990), excess precipitation runs off regardless of
HESSD
4, 2521–2560, 2007River Meuse discharge change
during the late Holocene
P. J. Ward et al.
Title Page
Abstract Introduction
Conclusions References
Tables Figures
◭ ◮
◭ ◮
Back Close
Full Screen / Esc
Printer-friendly Version
Interactive Discussion whether the soil is saturated. Runoffis routed through the river network on a daily basis
using data on average flow velocities stated in Berger (1992) (see Ward, 2007). The model was set up for the catchment upstream from Borgharen (Fig. 1), using the USGS GTOPO30 DEM (http://edc.usgs.gov/products/elevation/gtopo30/gtopo30.html).
3.2 Input data 5
3.2.1 Climate data
The climate data (daily temperature and precipitation) derived from ECBilt-CLIO-VECODE have a spatial resolution of ca. 5.6◦×5.6◦, and therefore need downscaling to
the resolution of the STREAM model. The downscaling takes into account the spatial distribution of monthly averages, in accordance with Bouwer et al. (2004), using base-10
line observed monthly temperature and precipitation data for the period 1901–2000 from the CRU TS 1.2 dataset (Mitchell and Jones, 2005).
The downscaled mean monthly temperature and precipitation data for the period 1901-2000 show good agreement with observed values for all ensemble members (temperature,r>0.99; precipitation,r>0.96). The downscaled daily temperature data 15
were validated against observed values for Maastricht, from the European Climate Assessment & Dataset (ECA&D) (http://eca.knmi.nl/) (Klein Tank et al., 2002). The modelled daily temperature data show good agreement with the observations (Mann-Whitney U test (MWU),α=0.05). The number of precipitation-free days at Maastricht (model, 27.5%; observed, 45.7%) is underestimated; this is related to the fact that the 20
original model grid cell represents an area of ca. 5.6◦×5.6◦, whilst the observed data
refer to a specific point. We found no significant difference between the frequency dis-tributions of observed and simulated daily precipitation for very wet days (10% wettest days) (Kruskal-Wallis (KW) test,χ2=1.691, p=0.792).
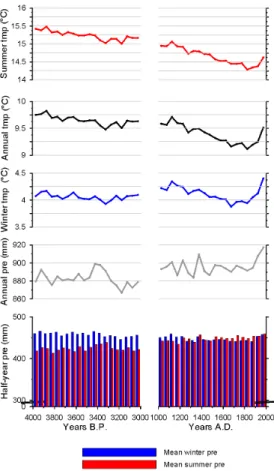
Simulated mean annual precipitation for 1000–2000 AD (895.93 mm) is slightly but 25
statistically higher than for 4000–3000 BP (882.56 mm) (t-test, p<0.001), though there is no statistical difference in variability (F-test, p=0.291) (Fig. 3). However, whilst mean
HESSD
4, 2521–2560, 2007River Meuse discharge change
during the late Holocene
P. J. Ward et al.
Title Page
Abstract Introduction
Conclusions References
Tables Figures
◭ ◮
◭ ◮
Back Close
Full Screen / Esc
Printer-friendly Version
Interactive Discussion summer precipitation for 1000-2000 AD (448.22 mm) is significantly higher than for
4000–3000 BP (424.37 mm) (t-test, p<0.001), winter precipitation is lower (1000–2000 AD, 447.71 mm; 4000–3000 BP, 458.19 mm; t-test, p<0.001). The greatest precipita-tion increase is between July and September. Mean 50-yr precipitaprecipita-tion shows neither a significant trend over the period 4000–3000 BP (MK-test, p=–0.1048) nor over the 5
last millennium (MK-test, p=–0.2176). For the period 1000–2000 AD, mean annual and summer temperatures (9.39◦C and 14.66◦C respectively) are significantly lower than for 4000–3000 BP (9.65◦C and 15.24◦C respectively) (t-test, p<0.001). Over the course of the last millennium, mean, summer, and winter 50-yr temperatures show decreasing trends (MK-test, p<0.001, p<0.001, p=0.004 respectively), although clear increases 10
are simulated over the last 150 years (Fig. 3). The long-term cooling trend of the late Holocene can be attributed to the biogeophysical effects of deforestation in (northwest-ern) Europe (Brovkin et al., 2006; Goosse et al., 2006; Matthews et al., 2003). For the 20th Century, mean simulated annual precipitation is 912.40 mm, and temperature is 9.38◦C; both show a relatively large increase in the second half of the 20th Century. 15
Precipitation depths on very wet days (95th and 99th percentiles) are greater during 4000–3000 BP than 1000–2000 AD. Although these precipitation depths increased in the 20th Century compared to the rest of the last millennium, they are still lower than at 4000–3000 BP.
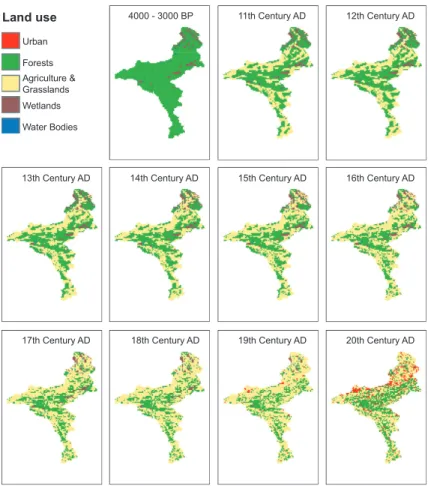
3.2.2 Land use data 20
A crop factor map is used in STREAM to calculate potential evapotranspiration (PE). Different crop factors are applied to different land uses to account for their relative differences in PE. In this study we have developed a land use map for each century (Appendix 1); for more detailed information see Ward (2007). The land use classes have been simplified due to the relative scarcity of detailed historical land use data, 25
and reclassed to crop factor maps based on values in Kwadijk (1993) and Aerts and Bouwer (2002): Urban (0.8), Forests (1.1), Agriculture and Grasslands (0.9), Wetlands (1.1), Water Bodies (1.5).
HESSD
4, 2521–2560, 2007River Meuse discharge change
during the late Holocene
P. J. Ward et al.
Title Page
Abstract Introduction
Conclusions References
Tables Figures
◭ ◮
◭ ◮
Back Close
Full Screen / Esc
Printer-friendly Version
Interactive Discussion For the 20th Century, we used the dataset CORINE Land Cover 2000 (CLC2000)
250 m version 8/2005 (V2) (© EEA, Copenhagen, 2005), available athttp://dataservice.
eea.eu.int/dataservice/. For the 19th Century we used data on forest and urban area from historical census information for Belgium (WL, 1994a) and France (Dutoo, 1994), and from historical maps for the Netherlands (Knol et al., 2004). Data on wetlands 5
and peat bogs were based on RWS Limburg/IWACO (2000). For the 11th Century we used a map of Meuse basin land use at ca. 1000 AD (RWS Limburg/IWACO, 2000), based on historical and archaeological evidence. For the remaining centuries (12th– 18th Centuries) no quantitative assessments of land use are available; instead the land use maps are based on qualitative historical studies (RWS Limburg/IWACO, 2000; WL, 10
1994a) and linear extrapolation (Ward, 2007).
Although archaeological and pollen evidence suggest that parts of the basin were populated by 4000–3000 BP (Bunnik, 1995; Gotj ´e et al., 1990), any disturbance in this period was, in our opinion, minor, and too small to have had any significant influence on hydrological processes. Since the natural vegetation of northwest Europe at that 15
time was predominantly deciduous forest (Bunnik, 1995; Gotj ´e et al., 1990), we have assumed a fully forested basin at 4000–3000 BP, except for those cells referring to “Water Bodies” (CORINE), and “Wetlands” (RWS Limburg/IWACO, 2000).
The basin-averaged crop factor (Fig. 4) shows a marked reduction between 4000– 3000 BP and 1000–2000 AD (conversion of forest to agriculture), and decreases further 20
over the last millennium (deforestation and peat extraction). However, in the 20th Cen-tury the crop factor increases slightly (due to the reforestation of previously cultivated land, although tempered by urbanisation). Changes in land cover (the physical char-acteristics of the Earth’s surface) have shown more change than land use over the last century (e.g. an increase in coniferous forest relative to deciduous forest, and changes 25
in types of agriculture) (Tu, 2006). However, on a millennial timescale the large-scale changes in land use are more important than such changes.
HESSD
4, 2521–2560, 2007River Meuse discharge change
during the late Holocene
P. J. Ward et al.
Title Page
Abstract Introduction
Conclusions References
Tables Figures
◭ ◮
◭ ◮
Back Close
Full Screen / Esc
Printer-friendly Version
Interactive Discussion 3.2.3 Soil water holding capacity
A map showing the maximum water holding capacity (WHC) of the soil (mm m−1) is used in STREAM to calculate evapotranspiration, runoff, groundwater seepage, and baseflow. For the present day we have used the United Nations Food and Agricul-ture Organization’s (FAO) map of WHC (FAO, 2003). Since the FAO dataset has too 5
coarse a resolution to accurately represent the remaining areas of peat-bog in the Meuse basin, we have assigned those areas a value of 71 mm m−1, i.e. the modal WHC value for the remaining large intact areas of European peat-bog (FAO, 2003). Changes in land use cause changes in soil textural properties, therefore influencing WHC. The FAO WHC map is based on dominant soil unit, component soil units, tex-10
ture, soil phase, and relief, but does not explicitly consider vegetation. We found a significant positive correlation between WHC and percentage forest cover between the various soil units, and a significant negative correlation between WHC and percentage cover of agriculture and grasslands (Spearman’s rank,α=0.05). Hence, the percent-age difference between the mean WHC of soils covered by forests and those covered 15
by agriculture and grasslands was calculated, and the resulting change factors were coupled with the land use anomalies over time, to produce WHC maps for each cen-tury, similar to Mahe et al. (2005). For areas covered by rendzinas (shallow humus-rich soils over limestone) the original WHC of 63 mm m−1
was retained since the WHC of this soil unit is mainly influenced by parent material (FAO, 2003). During the period 20
4000–3000 BP the estimated basin-wide WHC (Fig. 4) was 50.8 mm m−1. By the 11th Century AD this had fallen to 48.3 mm m−1(i.e. 4.9% lower than in 4000–3000 BP) as a result of deforestation. Basin-wide WHC fell between the 11th and 19th Centuries AD inclusive, reaching ca. 46.3 mm m−1(i.e. 8.9% lower than in 4000–3000 BP) by the 19th Century, and increased slightly during the 20th Century to ca. 46.9 mm m−1. 25
HESSD
4, 2521–2560, 2007River Meuse discharge change
during the late Holocene
P. J. Ward et al.
Title Page
Abstract Introduction
Conclusions References
Tables Figures
◭ ◮
◭ ◮
Back Close
Full Screen / Esc
Printer-friendly Version
Interactive Discussion 3.3 Calibration and validation
Calibration was carried out for the relatively wet period 1961–2000, and validation for the relatively dry period 1921–1960. The calibration was initially carried out for the main river at Borgharen, using data provided by Rijkswaterstaat RIZA (Institute for Inland Water Management and Waste Water Treatment), pertaining to the ‘undi-5
vided Meuse’; they are based on discharge measurements at Borgharen, corrected for canal extractions between Li `ege and Borgharen (De Wit et al., 2007), and are available since 1911. Further stations on the main river body were obtained for Chooz (Berger, 1992), and Stenay (DIREN Lorraine Bassin Rhin-Meuse). Tribu-tary data were obtained from: Direction G ´en ´erale des Voies Hydrauliques Region 10
Wallonne (http://voies-hydrauliques.wallonie.be/hydro/annuaireintro.do) for the Chiers (Chauvency-le-Ch ˆateau), Semois (Membre), Lesse (Gendron) Ambl `eve (Martinrive), Ourthe (Tabreux), and Viroin (Treignes); Roer and Overmaas Water Board for the Geul (Meerssen) and Roer (Stah); and Berger (1992) for the Sambre (Namur). The param-eters used in the final model can be found in Ward (2007).
15
The annual hydrographs for Borgharen (Fig. 5) show good correlations between mean annual and mean monthly modelled and observed discharges for the calibra-tion and validacalibra-tion periods, as well as for both periods taken together. The agree-ment of total annual discharge was assessed by expressing mean annual modelled discharge as a percentage of mean annual observed discharge (%), and the correla-20
tion of the means of monthly discharge was assessed using the correlation coefficient, r, and the co-efficient of efficiency, N&S. The modelled and observed daily discharge frequency distributions for 1921–2000 are statistically similar (MWU-test, p=0.366). In Table 1 the mean annual kth percentiles are given for the calibration and validation runs (k=1, 25, 50, 75, 90, 95, 99), showing good agreement for low, average, and 25
flows. The model slightly overestimates the frequency of summer half-year high-flows (Qk, k>97) due to an overestimation of high precipitation events in autumn in ECBilt-CLIO-VECODE. The model simulates the annual, monthly, and daily discharge
HESSD
4, 2521–2560, 2007River Meuse discharge change
during the late Holocene
P. J. Ward et al.
Title Page
Abstract Introduction
Conclusions References
Tables Figures
◭ ◮
◭ ◮
Back Close
Full Screen / Esc
Printer-friendly Version
Interactive Discussion characteristics of major tributaries well (Ward, 2007).
The simulated mean annual basin-average PE for 1921–2000 (605 mm a−1
) is of the same order of magnitude as the estimated PE for the Belgian sub-catchments for 1968–1998 (555 mm a−1) (Leander et al., 2005); the correlation between mean monthly PE totals is good (N&S=0.79, r=0.92). Data pertaining to the number of days per 5
year on which the ground is covered by snow at Maastricht (Klein Tank et al., 2002,
http://eca.knmi.nl/), were used in the calibration of parameters pertaining to snowmelt and snowfall. In the model output for 1961–2000 the ground was covered by snow at Maastricht on average 3.6% of days per year, compared to 3.7% of days in the observed record.
10
3.4 Sensitivity analysis
The model is sensitive to changes in parameters influencing evapotranspiration, and fairly insensitive to parameters pertaining to WHC and slope (Ward, 2007). Hence, it is important that the crop factors are reliable, as incorrect crop factors could lead to large errors in the estimation of evapotraspiration. We calculated the present day percent-15
age cover of forest and agriculture for 11 sub-catchments (upstream from the follow-ing points): Stenay, Chauvency-le-Ch ˆateau, Membre, Gendron, Martinrive, Meerssen, Chooz, Tabreux, Stah, Namur, Treignes. For each sub-catchment we also calcu-lated the percentage anomaly between annual observed and modelled discharge. We found no correlation between percentage forest cover and model accuracy (Spear-20
man’s Rank, p=0.467), which suggests that the accuracy of the model is not biased by the crop factor values used for forest and agriculture. Since the main land use changes of the late Holocene have been between these two land use types, the model should therefore be able to simulate the effects of these land use changes on evapotranspira-tion.
25
The basin-wide changes in WHC used in our model (Fig. 4) show a maximum change between the periods 4000–3000 BP and 1000–2000 AD of 8.9%. The sensitivity anal-ysis showed that an increase or decrease of WHC of 10% led to a change in mean
HESSD
4, 2521–2560, 2007River Meuse discharge change
during the late Holocene
P. J. Ward et al.
Title Page
Abstract Introduction
Conclusions References
Tables Figures
◭ ◮
◭ ◮
Back Close
Full Screen / Esc
Printer-friendly Version
Interactive Discussion annual discharge of just±0.7%, and had little influence on high and low-flows. Hence,
our palaeodischarge model is more useful for examining the effects of land use change on evapotranspiration, rather than on soil moisture.
4 Results
In this section we compare the results for 4000–3000 BP with those for 1000–2000 5
AD. We use the period 4000–3000 BP as a reference period in which the hydrological system was in a natural state. The discharge results for this reference period are compared to those of 1000–2000 AD, during which time the hydrological system was affected by anthropogenic changes in land use and climate.
4.1 Mean discharge 10
The simulated ensemble mean annual discharge shows a statistically significant in-crease (t-test, p<0.001) of 6.6% between 4000–3000 BP (244.8 m3s−1) and 1000– 2000 AD (261.0 m3s−1) (Fig. 4). The variability of mean annual discharge also in-creased (4000-3000 BP, σ=39.6; 1000–2000 AD, σ=44.8; F-test, p<0.001). The in-crease in the winter half-year (+2.3%) was small compared to the increase in the sum-15
mer half-year (+21.6%) (Fig. 6). During the period 1000-2000 AD, discharge shows an increasing monotonic trend (MK-test, p<0.001) (Fig. 4). Surplus water availability for runoff is in fact dependent on two key components: precipitation and actual evap-otranspiration (AE). The long-term changes in discharge cannot be simply related to changes in precipitation over the Holocene. The simulated increase in summer pre-20
cipitation between 4000–3000 BP and 1000–2000 AD was just 5.6% (compared to a 21.6% increase in summer discharge), whilst winter precipitation depths showed a decrease of 2.3% (compared to a 2.3% increase in winter discharge). Moreover, no monotonic trend of increasing annual precipitation is simulated for the last millennium, in contrast to mean annual discharge. However, simulated AE was significantly higher 25
HESSD
4, 2521–2560, 2007River Meuse discharge change
during the late Holocene
P. J. Ward et al.
Title Page
Abstract Introduction
Conclusions References
Tables Figures
◭ ◮
◭ ◮
Back Close
Full Screen / Esc
Printer-friendly Version
Interactive Discussion at 4000–3000 BP than at 1000–2000 AD (t-test, p<0.001). Furthermore, we see a
strong decreasing trend in AE over the last 1000 years (MK-test, p=0.004) (Fig. 4), as a result of: (a) reduced forest cover and hence reduced crop factor; and (b) reduced temperature.
We found no simple correlation relating mean annual temperatures to mean dis-5
charge or precipitation. Whilst we did simulate a strong positive correlation between 50-yr mean annual discharge and 50-yr summer precipitation totals for the period 1000–2000 AD, no such correlation was noted for 4000–3000 BP. Due to the higher crop factors at 4000–3000 BP, annual PE–AE at that time was almost two times as high as during the last millennium. Hence, more excess precipitation in wet summers 10
could be lost to AE, and therefore fluctuations in summer precipitation had less influ-ence on discharge. This facet of the system may also be responsible for the simulated increase in variability of mean annual discharge, since no change in precipitation or temperature variability was simulated between the time-slices.
For the 20th Century we see an increase in mean discharge compared to the 19th 15
Century (Fig. 4) (19th Century, 263.5 m3s−1; 20th Century, 270.0 m3s−1), despite a significant increase in AE (19th Century, 539.8 mm a−1; 20th Century, 548.8 mm a−1). This increase in discharge is ascribable to a relatively large increase in precipitation in the 20th Century (912.4 mm a−1) compared to the 19th Century (893.1 mm a−1); annual precipitation depths in the former period are thereby greater than in any preceding 20
century.
4.2 High-flow events
Between 4000–3000 BP and 1000–2000 AD the frequency of high-flows increased, with a further increase in the 20th Century (Fig. 7). The difference between the fre-quency distributions for the periods 4000–3000 BP and 1000–2000 AD is statistically 25
significant (KS-test, p<0.001).
We examined the changes in the simulated recurrence times of high-flow events of the following magnitudes: Q>800 m3s−1, 1300 m3s−1, 1950 m3s−1, and 3000 m3s−1
HESSD
4, 2521–2560, 2007River Meuse discharge change
during the late Holocene
P. J. Ward et al.
Title Page
Abstract Introduction
Conclusions References
Tables Figures
◭ ◮
◭ ◮
Back Close
Full Screen / Esc
Printer-friendly Version
Interactive Discussion (Table 2). These correspond approximately to the discharge percentiles Q95, Q99,
Q99.9, and Q99.995 in the observed record at Borgharen (1912–2000). Little change is
evident in the recurrence times of relatively small to medium high-flows (Q>800 m3s−1 and 1300 m3s−1) between 4000–3000 BP and 1000–2000 AD, although there is a slight but clear increase in frequency with regards to the 20th Century. For large high-5
flow events (Q>3000 m3s−1), a clear increase in recurrence frequency can be seen between 4000–3000 BP and 1000–2000 AD, with a further increase in the 20th Cen-tury. The recurrence time of flows of this magnitude is almost twice as short in the 20th Century as in the reference period 4000–3000 BP.
To examine whether the simulated number of large high-flow events (Q>3000 m3s−1) 10
for the 20th Century falls within the limits of natural variability, we calculated the number of flow events for which Q>3000 m3s−1 for each possible 100-yr period in the simu-lations. Note that the results of the 4 ensemble members have been lumped together, and hence each 100-year period corresponds to 400-years of observations. Firstly, we filtered out flow events of Q>3000 m3s−1 whereby the simulated discharges occurred 15
within 10 days of each other, so as to ensure that independent events were counted, following Tu (2006). For the period 1901–2000 AD, 10 flow events with Q>3000 m3s−1 were simulated in the 4 ensemble runs. Then we calculated the number of flow events for which Q>3000 m3s−1 for every possible 100-yr period in the simulations; 900 pos-sible periods of 100-yr duration exist for each millennial time-slice. During the period 20
1000–2000 AD, there were 8 periods of 100-yr duration in which this frequency of high-flow events (10 per 100-yr for Q>3000 m3s−1) was simulated; for the period 4000– 3000 BP it was simulated only one time. Hence, the frequency of large high-flows has been particularly great over the last 100 years, but does not fall outside natural variability.
25
4.3 20th Century trends
We investigated the presence or absence of monotonic trends (M-K test) in simulated discharge, precipitation, temperature, and AE time-series over the 20th Century. On
HESSD
4, 2521–2560, 2007River Meuse discharge change
during the late Holocene
P. J. Ward et al.
Title Page
Abstract Introduction
Conclusions References
Tables Figures
◭ ◮
◭ ◮
Back Close
Full Screen / Esc
Printer-friendly Version
Interactive Discussion this timescale land use is assumed to be constant in our model, so any trend can be
as-cribed to climatic change. For mean annual, summer, and winter discharge, as well as for the 75th, 90th, 95th, and 99th percentiles of daily discharge, we found no significant trends. Upward trends were found for mean annual, summer, and winter temperature, which forced significant upward trends in annual and winter AE, although no significant 5
trend in summer AE. For mean annual, summer, and winter precipitation no significant trends were simulated, although these parameters increased weakly. Hence, despite significantly increasing trends in AE over the last 100 years, no significant discharge trend was noted due to the compensatory effect of the weak increasing trend in precip-itation.
10
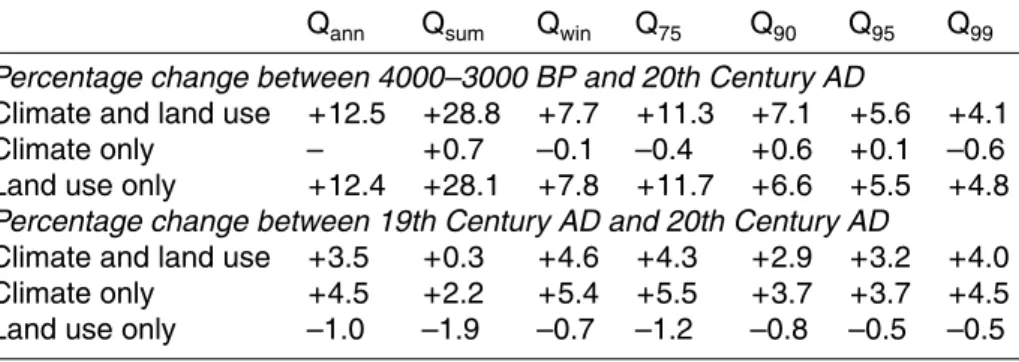
4.4 Relative contributions of climate and land use change to changes in discharge
The results described in Sects. 4.1 to 4.3 show an increase in mean discharge and flood frequency between the natural reference state and the last millennium, with a fur-ther increase in the 20th Century. Given that the simulated increase in mean discharge mainly took place in the summer, that precipitation shows no trend over the last 1000 15
years, and that the intensity of large precipitation events was higher in 4000–3000 BP, we attribute the increase in mean discharge and high-flow events to a large extent to changes in land use (lower evapotranspiration due to decreased forested area). How-ever, comparing the 20th Century results to those of the 19th Century, it appears that a significant increase in precipitation has become the dominant mechanism, since the 20
observed reforestation over that period should theoretically have led to decreased dis-charge. To test this theory we carried out further hydrological simulations to delineate the effects of land use and climatic change.
For the period 4000–3000 BP we carried out a further simulation with STREAM, using one ECBilt-CLIO-VECODE ensemble member as climate input data, but using 25
the land use and WHC maps of the 20th Century. Similarly, we ran a simulation with the 20th Century climate input data, but using the land use and WHC data for 4000– 3000 BP. In this way the effects of changes in climate and land use were delineated.
HESSD
4, 2521–2560, 2007River Meuse discharge change
during the late Holocene
P. J. Ward et al.
Title Page
Abstract Introduction
Conclusions References
Tables Figures
◭ ◮
◭ ◮
Back Close
Full Screen / Esc
Printer-friendly Version
Interactive Discussion Similarly, we ran STREAM using climate data of the 19th Century with land use data
for the 20th Century, and vice versa.
The results of these simulations (Table 3) show that the change in climatic conditions between 4000–3000 BP and the 20th Century has had almost no effect on discharge; almost all of the change on this timescale can be attributed to large-scale changes in 5
land use (mainly a large decrease in forest at the expense of agricultural and urban land). An examination of the changes in discharge characteristics between the 19th and 20th Centuries reveals the opposite pattern. As expected, the increased crop factor (due to reforestation) between these two time-periods means that the effect of land use change alone is to force a slight reduction in mean discharge and high-flow 10
magnitude. However, the increase in precipitation (mean and intensity) between these two time-periods has overwhelmed the land use forcing, leading to increased discharge magnitudes, especially in the winter half-year (due to a relatively large increase in winter precipitation), and increased magnitude of high-flow events (due to increased precipitation intensity and increased winter half-year antecedent soil moisture).
15
5 Discussion
5.1 Effects of land use change on discharge
Our results are in agreement with those of recent studies on the effects of land use change on Meuse discharge. Tu (2006) investigated the observed discharge character-istics of the Meuse for the period 1912–2000, and found the effects of land use change 20
to be marginal or statistically undetectable. Ashagrie et al. (2006) used the HBV model to simulate changes in Meuse discharge over the 20th Century, and concluded that the observed change in land use did not have a significant effect on discharge. Although we did not simulate changes in land use within the 20th Century, we see that the effect of land use change in the 20th Century in relation to the 19th Century is minor. On this 25
timescale the changes in land use were relatively small and worked in a compensatory
HESSD
4, 2521–2560, 2007River Meuse discharge change
during the late Holocene
P. J. Ward et al.
Title Page
Abstract Introduction
Conclusions References
Tables Figures
◭ ◮
◭ ◮
Back Close
Full Screen / Esc
Printer-friendly Version
Interactive Discussion fashion in terms of their effects on AE, since the crop factor associated with forest is
high, whereas that associated with urban areas is low.
Whilst land use change has not greatly influenced discharge over the last century, our results show that on a longer timescale the large-scale deforestation of the basin has led to significant increases in mean discharge and flood frequency. It is now widely 5
accepted that forests can cause a reduction in mean discharge, especially during the summer half-year (Calder, 1993). The results of paired catchment studies in temper-ate zones have established strong links between deforestation and increasing mean discharge, and vice versa (Andr ´eassian, 2004; Bosch and Hewlett, 1982; Hornbeck et al., 1993; Sahin and Hall, 1996). In single basin studies, large increases in dis-10
charge due to deforestation, or decreases due to reforestation, have been noted in Europe (Gallart and Llorens, 2004; Keesstra, 2006), Africa (Mahe et al., 2005; Scott et al., 2005), North America (Trimble et al., 1987), and South America (Costa et al., 2003; Iroum ´e et al., 2005). Various modelling studies of European streamflow have simulated significant changes in response to land use change (Bultot et al, 1990; Kl ¨ocking and 15
Hamberlandt, 2002; Wegehenkel, 2002). Two of the most important factors affecting discharge via land use change are: (a) alterations in evapotranspiration totals (Calder, 1993; Hornbeck et al., 1993; Keesstra, 2006; Robinson et al., 2003) due to changes in leaf area, stomatal response, and interception; and (b) changes in soil water holding characteristics (Cosandey et al., 2005; Mahe et al., 2005); in our model the discharge 20
effects of land use change can be mainly ascribed to changes in AE.
The effect of deforestation on high-flow events is more debated (EEA, 2001). In a review of 113 paired catchments, Andr ´eassian (2004) found that flood volumes and peak-flows could increase after deforestation, but that the response was much more varied in time and space than for mean discharge. Nevertheless, large-scale defor-25
estation has led to increased peak-flows around the globe (Brown et al., 2005; Gentry and Parody, 1980; Jones, 2000; Mahe et al., 2005), whilst reforestation has led to significant reductions in flood peaks (Fahey, 1994; Robinson et al., 1991).
HESSD
4, 2521–2560, 2007River Meuse discharge change
during the late Holocene
P. J. Ward et al.
Title Page
Abstract Introduction
Conclusions References
Tables Figures
◭ ◮
◭ ◮
Back Close
Full Screen / Esc
Printer-friendly Version
Interactive Discussion 5.2 Comparison of simulation results with proxy and historical data
In order to validate the results of our model for the late Holocene, we compared our findings with qualitative results based on multi-proxy data. Simulated mean summer and winter temperatures are in reasonable agreement with multi-proxy reconstructions of regional temperature for the late Holocene, which show a gradual decrease in tem-5
perature (especially in summer) (Bohncke et al., 1987; Goosse et al., 2006; Zagwijn, 1994). Proxy data on late Holocene precipitation change in the region are scarce, but suggest a slight increase in precipitation in the last millennium compared to the period 4000–3000 BP (Bohncke and Vandenberghe, 1991; Van Geel et al., 1996), though they give no indication of seasonal changes. Whilst these proxy data are very limited 10
in detail, their main trends are in agreement with our results.
The qualitative results of multi-proxy studies on late Holocene Meuse discharge are in agreement with our conclusion of increasing mean discharge and high-flows. Berendsen and Stouthamer (2001) suggest that an increase in meander wavelengths in the Rhine-Meuse delta after ca. 2800 BP may be indicative of increased bankfull dis-15
charge in both rivers. Furthermore, they postulate that an increase in flood frequency may have occurred somewhere between 3000-2000 BP, as attested by an increase in avulsion frequency and the reoccupation of residual channels by floodwaters (e.g. Hofstede et al., 1989). De Moor (2007) states that the increasing thickness of fining-up sequences in the fluvial deposits of the Geul (Meuse tributary) could represent 20
an increase in bankfull discharge due to deforestation since Roman times. Zagwijn (1986) suggests that a reduction of forested area in the Netherlands, especially since Roman times, led to a reduction in evapotranspiration, and consequently increased discharge. Similarly, Bohncke and Vandenberghe (1991) derived qualitative estimates of changes in evapotranspiration, precipitation, and temperature in the Mark Basin 25
(southern Netherlands) to suggest that discharge was higher at 1000–2000 AD than at 4000–3000 BP. Based on an examination of historically documented floods over the pe-riod 1000–2000 AD, WL (1994b) conclude that the frequency of high-flow events since
HESSD
4, 2521–2560, 2007River Meuse discharge change
during the late Holocene
P. J. Ward et al.
Title Page
Abstract Introduction
Conclusions References
Tables Figures
◭ ◮
◭ ◮
Back Close
Full Screen / Esc
Printer-friendly Version
Interactive Discussion 1911 appears to have been greater than in the preceding centuries. However, it should
be stressed that the frequency of floods in the historical record may be underestimated due to the lack of systematic measurements.
5.3 Uncertainties and limitations
Our model experiment includes a number of limitations, the most important being: (1) 5
the climate model has a low spatial resolution and simplified physics compared to GCMs. This makes it impossible to correctly simulate the regional details and vari-ability of daily precipitation; (2) the downscaling of precipitation is carried out using a simple linear correction technique based on monthly correction factors. Leander and Buishand (2007) found it to be advantageous to correct also for the variability of 10-day 10
precipitation amounts. However, given the long timescales involved in the palaeodis-charge approach a more sophisticated downscaling method was found to be unfeasi-ble; (3) the Thornthwaite & Mather equation (1957) for AE is highly simplified; (4) the impact of anthropogenic water extraction and canalisation is not fully accounted for; (5) the land use data represent only a generalised pattern of land use change over 15
the last millennium; (6) STREAM (and indeed any hydrological model), cannot fully describe the hydrological processes within the basin, and especially the groundwater and soil water processes are overly simplified. Hence it is difficult to assess the effects of changing soil characteristics on Meuse discharge, although changes in soil water holding capacity have been estimated; (7) the resolution used in STREAM means that 20
only larger river networks can be delineated. The chosen resolution does, however, allow for the assessment of changes in long-term discharge trends at the basin-scale (Ward, 2007).
These limitations inevitably introduce uncertainties in our results, and hence they should be used with caution. The discharge results should not be taken as exact 25
figures for each period studied, but rather they give an indication of the main trends in mean discharge and flood frequency over the late Holocene, and can be used to examine relative changes between the time-slices studied. Similarly, the land use data
HESSD
4, 2521–2560, 2007River Meuse discharge change
during the late Holocene
P. J. Ward et al.
Title Page
Abstract Introduction
Conclusions References
Tables Figures
◭ ◮
◭ ◮
Back Close
Full Screen / Esc
Printer-friendly Version
Interactive Discussion do not represent the exact situation per century, but give an indication of the trend in
land use change over the last millennium, and hence allow for an investigation of the sensitivity of the hydrological system to those changes.
Despite these limitations, the calibration and validation of the model was successful for annual, monthly and daily discharge characteristics. Furthermore, the climate and 5
discharge results are in agreement with the general trends inferred from the limited local and regional multi-proxy data. One of the major advantages of our approach is that we were able to perform millennial-scale simulations in ensemble mode, with multiple land use scenarios, which would not have been feasible with a full GCM.
6 Conclusions 10
According to our simulations the mean discharge, flood frequency, and flood magni-tudes of the Meuse river were significantly greater in the last millennium than in the period 4000–3000 BP, as was the variability of mean annual discharge. The mean annual discharge increased by 6.6% between these time-slices; the most marked in-crease occurred in the summer half-year (+21.6%). The recurrence time of large high-15
flow events (Q>3000 m3s−1) decreased from 77 years in the period 4000–3000 BP, to 65 years in 1000–2000 AD. On this timescale these increases can be almost fully attributed to changes in land use, and namely decreased evapotranspiration as a result of the large-scale deforestation of the basin. On a millennial timescale climatic change has had an insignificant effect on late Holocene Meuse discharge.
20
However, over the last century climate change has overwhelmed land use change as the most important mechanism. Although evapotranspiration showed an increase over the course of the 20th Century (due to reforestation and increasing temperature), the mean discharge was greater in the 20th Century than during any preceding cen-tury, and 2.5% greater than in the 19th Century. The occurrence of large high-flows 25
(Q>3000 m3s−1) was almost twice as frequent in the 20th Century as under natu-ral conditions. This increase in mean discharge and flood frequency is the result of a
HESSD
4, 2521–2560, 2007River Meuse discharge change
during the late Holocene
P. J. Ward et al.
Title Page
Abstract Introduction
Conclusions References
Tables Figures
◭ ◮
◭ ◮
Back Close
Full Screen / Esc
Printer-friendly Version
Interactive Discussion strong increase in annual and winter precipitation compared to the preceding centuries,
probably related to anthropogenic climate change.
Many basins in western Europe have experienced similar changes in land use as a result of human activities during the late Holocene, and similar land use changes have occurred at different times throughout the mid-latitudes. The results of this study 5
suggest that more research is needed to examine the potential contribution of land use management to flood mitigation in these regions. Theoretically, large-scale reforesta-tion may offer protection against increased flooding in basins with a similar hydrological setting to the Meuse. However, in many basins space is at a premium, and large-scale reforestation is not a viable option. Therefore, further experiments are needed 10
to assess the relative effects of limited reforestation in the coming century, in combi-nation with projected climate change scenarios. Since our model has been validated against (limited) multi-proxy data on a millennial timescale, and for large environmental changes, it forms a useful tool for such assessments.
Acknowledgements. This research project was carried out in the framework of the Dutch
Na-15
tional Research Programme “Climate changes Spatial Planning” (http://www.klimaatvoorruimte. nl). HR is supported by the Netherlands Organization for Scientific Research (NWO). We would like to thank Marcel de Wit for the provision of numerous datasets, and for reviewing an earlier version of the manuscript.
References 20
Aerts, J. C. J. H. and Bouwer, L. M.: STREAM Krishna. A hydrological model for the Krishna River in India. RIKZ/Coastal Zone Management Centre, The Hague, The Netherlands,http: www.geo.vu.nl/users/ivmstream/public/aerts&bouwer2002a.pdf, 2002.
Aerts, J. C. J. H., Kriek, M., and Schepel, M.: STREAM (Spatial Tools for River Basins and Environment and Analysis of Management Options): “Set Up and Requirements”, Physics 25
and Chemistry of the Earth, Part B: Hydrology, Oceans and Atmosphere, 24(6), 591–595, 1999.
HESSD
4, 2521–2560, 2007River Meuse discharge change
during the late Holocene
P. J. Ward et al.
Title Page
Abstract Introduction
Conclusions References
Tables Figures
◭ ◮
◭ ◮
Back Close
Full Screen / Esc
Printer-friendly Version
Interactive Discussion Aerts, J. C. J. H., Renssen, H., Ward, P. J., De Moel, H., Odada, E., Bouwer, L. M., and Goosse,
H.: Sensitivity of global river discharges under Holocene and future climate conditions, Geo-phys. Res. Lett., 33, L19401, doi:10.1029/2006GL027493, 2006.
Andr ´eassian, V.: Waters and forests: from historical controversy to scientific debate, J. Hydrol., 291, 1–27, doi:10.1016/j.jhydrol.2003.12.015, 2004.
5
Ashagrie, A. G., De Laat, P. J. M., De Wit, M. J. M., Tu, M., and Uhlenbrook, S.: Detecting the influence of land use changes on discharges and floods in the Meuse River Basin – the predictive power of a ninety-year rainfall-runoffrelation?, Hydrol. Earth Syst. Sci., 10, 691– 701, 2006,
http://www.hydrol-earth-syst-sci.net/10/691/2006/. 10
Berendsen, H. J. A. and Stouthamer, E.: Palaeogeographic development of the Rhine-Meuse delta, The Netherlands. Koninklijke Van Gorcum, Assen, The Netherlands, 2001.
Berger, H. E. J.: Flow Forecasting for the River Meuse. Ph.D thesis, Technische Universiteit Delft, Delft, The Netherlands, 1992.
Bohncke, S. J. P. and Vandenberghe, J.: Palaeohydrological development in the Southern 15
Netherlands during the last 15 000 years, in: : Temperate palaeohydrology, edited by: Starkel, L., Gregory, K. J., and Thornes, J. B., John Wiley & Sons, Chichester, U.K, pp. 253-281, 1991.
Bohncke, S. J. P., Vandenberghe, J., Coope, R., and Reiling, R.: Geomorphology and palaeoe-cology of the Mark valley (southern Netherlands), II Palaeoepalaeoe-cology and climate during the 20
Weichselian Late Glacial, Boreas, 16, 69–85, 1987.
Booij, M. J.: Appropriate modelling of climate change impacts on river flooding. Ph.D thesis, Universiteit Twente, The Netherlands, 2002.
Booij, M. J.: Impact of climate change on river flooding assessed with different spatial model resolutions, Journal of Hydrology, 303(1–4), 176–198, doi:10.1016/j.jhydrol.2004.07.013, 25
2005.
Bosch, J. M. and Hewlett, J. D.: A review of catchment experiments to determine the effect of vegetation changes on water yield evaporation, J. Hydrol., 55, 3–23, 1982.
Bouwer, L. M., Vermaat, J. E., and Aerts, J. C. J. H.: Winter atmospheric circu-lation and river discharge in northwest Europe, Geophys. Res. Lett., 33, L06403, 30
doi:10.1029/2005GL025548, 2006.
Brovkin, V., Bendtsen, J., Claussen, M., Ganopolski, A., Kubatzki, C., Petoukhov, V., and Andreev, A.: Carbon cycle, vegetation, and climate dynamics in the Holocene:
HESSD
4, 2521–2560, 2007River Meuse discharge change
during the late Holocene
P. J. Ward et al.
Title Page
Abstract Introduction
Conclusions References
Tables Figures
◭ ◮
◭ ◮
Back Close
Full Screen / Esc
Printer-friendly Version
Interactive Discussion Experiments with the CLIMBER-2 model, Global Biogeochem. Cycles, 16(4), 1139,
doi:10.1029/2001GB001662, 2002.
Brovkin, V., Claussen, M., Driesschaert, E., Fichefet, T., Kicklighter, D., Loutre, M.-F., Matthews, H. D., Ramankutty, N., Schaeffer, M., and Sokolov, A.: Biogeophysical effects of historical land cover changes simulated by six Earth system models of intermediate complexity, Cli-5
mate Dynamics, 26, 587–600, doi 10.1007/s00382-005-0092-6, 2006.
Brown, A. E., Zhang, L., McMahon, T. A., Western, A. W., and Vertessy, R.: A review of paired catchment studies for determining changes in water yield resulting from alterations in vegetation, J. Hydrol., 310, 28-61, doi:10.1016/j.jhydrol.2004.12.010, 2005.
Bultot, F., Coppens, A., Dupriez, G.L., Gellens, D., and Meulenberghs, F.: Repercussions of 10
a CO2 doubling on the water cycle and on the water balance – A case study for Belgium, Journal of Hydrology, 99(3–4), 319–347, 1988.
Bultot, F., Dupriez, G. L., and Gellens, G.: Simulation of land use changes and impacts on the water balance – case study for Belgium, J. Hydrol., 114, 327–348, 1990.
Bunnik, F. P. M.: Pollenanalytische Ergebnisse zur Vegetations- und Land-15
wirtschaftsgeschichte der J ¨ulicher L ¨oßb ¨orde von der Bronzezeit bis in die fr ¨uhe Neuzeit, Bonner Jahrb ¨ucher, 195, 313–349, 1995.
Calder, I. R.: Hydrologic effects of land use change, in Maidment, D. R. (Ed.): Handbook of hydrology. McGraw-Hill Inc., New York, pp. 13.1–13.50, 1993.
Coe, M. T. and Harrison, S. P.: The water balance of northern Africa during the Mid-Holocene: 20
an evaluation of the 6 ka BP PMIP simulations, Climate Dynamics, 19, 155–166, 2002. Cosandey, C., Andr ´eassian, V., Martin, C., Didon-Lescot, J. F., Lavabre, J., Folton, N., Mathys,
N., and Richard, D.: The hydrological impact of the mediterranean forest: a review of French research, J. Hydrol., 301, 235–249, 2005.
Costa, M. H., Botta, A., and Cardille, J. A.: Effects of large-scale changes in land cover on 25
the discharge of the Tocantins River, Southeastern Amazonia, J. Hydrol., 283, 206–217, doi:10.1016/S0022-1694(03)00267-1, 2003.
De Moor, J. J. W.: Human impact on Holocene catchment development and fluvial processes – the Geul River catchment, SE Netherlands. Ph.D thesis, Vrije Universiteit Amsterdam, Amsterdam, The Netherlands, 2007.
30
De Wit, M., Warmerdam, P., Torfs, P., Uijlenhout, R., Roulin, E., Cheymol, A., Van Deursen, W., Van Walsum, P., Ververs, M., Kwadijk, J., and Buiteveld, H.: Effect of climate change on the hydrology of the river Meuse. Dutch National Research Programme on Global Air
HESSD
4, 2521–2560, 2007River Meuse discharge change
during the late Holocene
P. J. Ward et al.
Title Page
Abstract Introduction
Conclusions References
Tables Figures
◭ ◮
◭ ◮
Back Close
Full Screen / Esc
Printer-friendly Version
Interactive Discussion tion and Climate Change, Report number 410.200.090, RIVM, Bilthoven, The Netherlands,
2001.
De Wit, M. J. M., Van den Hurk, B., Warmerdam, P. M. M., Torfs, P. J. J. F., Roulin, E., and Van Deursen, W. P. A.: Impact of climate change on low-flows in the river Meuse, Climatic Change, 82(3–4), 1573–1480, doi:10.1007/s10584-006-9195-2, 2007.
5
Dutoo, D.: Onderzoeksproject Watersnood Maas. Het areaal onder bos in het Franse maas-bekken van 1908 tot 1988. Universiteit Gent, Gent, Belgium, 1994.
EEA: Sustainable water use in Europe. Part 3: Extreme hydrological events: floods and droughts. Environmental issue report No. 21, EEA, Copenhagen, Denmark, http://reports. eea.europa.eu/Environmental Issues No 21/en, 2001.
10
Fahey, B.: The effect of plantation forestry on water yield in New Zealand, New Zealand Forestry, 39(3), 18–23, 1994.
FAO: Digital Soil Map of the World (DSMW) Version 3.6 (CD-ROM). Land and Water Develop-ment Division, FAO, Rome, Italy, 2003.
Gallart, F. and Llorens, P.: Observations on land cover changes and water resources in the 15
headwaters of the Ebro catchment, Iberian Peninsula, Physics and Chemistry of the Earth, A/B/C 29, 769–773, 2004.
Gellens, D. and Roulin, E.: Streamflow response of Belgian catchments to IPCC climate change scenarios, J. Hydrol., 210(1–4), 242–258, 1998.
Gentry, A. H. and Parody, J. L.: Deforestation and increased flooding of the Upper Amazon, 20
Science, 210, 1354–1356, 1980.
Goosse, H. and Fichefet, T.: Importance of ice-ocean interactions for the global ocean circula-tion: a model study, Journal of Geophysical Research - Oceans, 104(C10), 23 337–23 355, 1999.
Goosse, H., Renssen, H., Timmermann, A., and Bradley, R. S.: Internal and forced climate 25
variability during the last millennium: a model-data comparison using ensemble simulations, Quaternary Science Reviews, 24(12–13), 1345–1360, 2005.
Goosse, H., Arzel, O., Luterbacher, J., Mann, M. E., Renssen, H., Riedwyl, N., Timmermann, A., Xoplaki, E., and Wanner, H.: The origin of the European “Medieval Warm Period”, Climate of the Past, 2, 99–113, 2006.
30
Gotj ´e, W., Van Wayjen, M. C. A., and Van Geel, B.: A palynological study of a Holocene deposit from Grand-Bongard (Hautes-Fagnes, Belgium), Geologie en Mijnbouw, 69, 227–241, 1990. Hofstede, J. L. A., Berendsen, H. J. A., and Janssen, C. R.: Holocene palaeogeography and
HESSD
4, 2521–2560, 2007River Meuse discharge change
during the late Holocene
P. J. Ward et al.
Title Page
Abstract Introduction
Conclusions References
Tables Figures
◭ ◮
◭ ◮
Back Close
Full Screen / Esc
Printer-friendly Version
Interactive Discussion palaeoecology of the fluvial area near Maurik (Neder-Betuwe, The Netherlands), Geologie
en Mijnbouw, 68, 409–419, 1989.
Hornbeck, J. W., Adams, M. B., Corbett, E. S., Verry, E. S., and Lynch, J. A.: Long-term impacts of forest treatment on water yield: a summary for Northeastern USA, Journal of Hydrology, 150, 323–343, 1993.
5
Iroum ´e, A., Huber, A., and Schulz, K.: Summer flows in experimental catchments with different forest covers, Chile, J. Hydrol., 300, 300–313, doi:10.1016/j.jhydrol.2004.06.014, 2005. Jones, J. A.: Hydrologic processes and peak discharge response to forest removal, regrowth,
and roads in 10 small experimental basins, western Cascades, Oregon, Water Resour. Res., 36(9), 2621–2642, 2000.
10
Keesstra, S. D.: The effects of natural reforestation on the hydrology, river morphology and sed-iment budget of the Dragonja River catchment, SW Slovenia. Ph.D thesis, Vrije Universiteit Amsterdam, Amsterdam, The Netherlands, 2006.
Klein Tank, A. M. G., Wijngaard, J. B., K ¨onnen, G. P., B ¨ohm, R., Demar ´ee, G., Gocheva, A., Mileta, M., Pashiardis, S., Hejkrlik, L., Kern-Hansen, C., Heino, R., Bessemoulin, P., M ¨uller-15
Westermeier, G., Tzanakou, M., Szalai, S., P ´alsd ´ottir, T., Fitzgerald, D., Rubin, S., Capaldo, M., Maugeri, M., Leitass, A., Bukantis, A., Aberfeld, R., Van Engelen, A. F. V., Forland, E., Mietus, M., Coelho, F., Mares, C., Razuvaev, V., Nieplova, E., Cegnar, T., Antonio L ´opez, J., Dahlstr ¨om, B., Moberg, A., Kirchhofer, W., Ceylan, A., Pachaliuk, O., Alexander, O. V., and Petrovic, P.: Daily dataset of 20th-century surface air temperature and precipitation series for 20
the European Climate Assessment, International J. Climatol., 22(12), 1441–1453, 2002. Kl ¨ocking, B. and Haberlandt, U.: Impact of land use changes on water dynamics – a case study
in temperate meso and macro scale river basins, Physics and Chemistry of the Earth, Parts A/B/C, 27(9), 619–629, 2002.
Knol, W. C., Kramer, H., and Gijsbertse, H.: Historisch grondgebruik Nederland: een lan-25
delijke reconstructie van het grondgebruik rond 1900. Alterra report 573, Alterra, Wagenin-gen, The Netherlands, http://library.wur.nl/wasp/bestanden/LUWPUBRD 00328279 A502 001.pdf, 2004.
Kwadijk, J. C. J.: The impact of climate change on the discharge of the River Rhine. Ph.D thesis, Universiteit Utrecht, Utrecht, The Netherlands, 1993.
30
Kwadijk, J. and Rotmans, J.: The impact of climate change on the River Rhine: a scenario study, Climatic Change, 30, 397–425, 1995.
Leander, R. and Buishand, T. A.: Resampling of regional climate model output for the simulation
HESSD
4, 2521–2560, 2007River Meuse discharge change
during the late Holocene
P. J. Ward et al.
Title Page
Abstract Introduction
Conclusions References
Tables Figures
◭ ◮
◭ ◮
Back Close
Full Screen / Esc
Printer-friendly Version
Interactive Discussion of extreme river flows, J. Hydrol., 332, 487–496, doi:10.1016/j.jhydrol.2006.08.006, 2007.
Leander, R., Buishand, A., Aalders, P., and De Wit, M.: Estimation of extreme floods of the river Meuse using a stochastic weather generator and a rainfall-runoffmodel, Hydrol. Sci. J., 50(6), 1089–1103, 2005.
Mahe, G., Paturel, J.-E., Servat, E., Conway, D., and Dezetter, A.: The impact of land use 5
change on soil water holding capacity and river flow modelling in the Nakambe River, Burkina-Faso, J. Hydrol., 300, 33–43, 2005.
Matthews, H. D., Weaver, A. J., Eby, M., and Meissner, K. J.: Radiative forcing of climate by historical land cover change, Geophysical Research Letters, 30(2), 1055, doi:10.1029/2002GL016098, 2003.
10
Middelkoop, H. and Parmet, B.: Assessment of the impact of climate change on peak flows in the Netherlands - a matter of scale, in Lemell ¨a, R., and Helenius, N. (Eds.): Proceedings of the second international conference on climate and water. Helsinki University of Technology, Espoo, Finland, pp. 20–33, 1998.
Mitchell, T. D. and Jones, P. D.: An improved method of constructing a database of monthly cli-15
mate observations and associated high-resolution grids, International Journal of Climatology, 25, 693–712, 2005.
Opsteegh, J. D., Haarsma, R. J., Selten, F. M., and Kattenberg, A.: ECBILT: a dynamic alter-native to mixed boundary conditions in ocean models, Tellus, 50A, 348–367, 1998.
Pfister, L., Humbert, J., and Hoffmann, L.: Recent trends in rainfall-runoffcharacteristics in the 20
Alzette river basin, Luxembourg, Climatic Change, 45, 323–337, 2000.
Pfister, L., Kwadijk, J., Musy, A., Bronstert, A., and Hoffmann, L.: Climate change, land use change and runoffprediction in the Rhine-Meuse basins, River Research and Applications, 20, 229–241, 2004.
Renssen, H., Goosse, H., Fichefet, T., Brovkin, V., Driesschaert, E., and Wolk, F.: Simulating 25
the Holocene climate evolution at northern high latitudes using a coupled atmosphere-sea-ice-ocean-vegetation model, Clim. Dyn., 24(1), 23–43, 2005.
Robinson, M., Gannon, B., and Schuch, M.: A comparison of the hydrology of moorland under natural conditions, agricultural use and forestry, Hydrol. Sci. J., 36, 565–577, 1991.
Robinson, M., Cognard-Plancq, A.-L., Cosandey, C., David, J., Durand, P., F ¨urhrer, H.-W., 30
Hall, R., Hendriques, M. O., Marc, V., McCarthy, R., McDonnell, M., Martin, C., Nisbet, T., O’Dea, P., Rodgers, M., and Zollner, A.: Studies of the impact of forests on peak flows and baseflows: a European perspective, Forest Ecol. Manage., 186, 85–97,
HESSD
4, 2521–2560, 2007River Meuse discharge change
during the late Holocene
P. J. Ward et al.
Title Page
Abstract Introduction
Conclusions References
Tables Figures
◭ ◮
◭ ◮
Back Close
Full Screen / Esc
Printer-friendly Version
Interactive Discussion 1127(03)00238-X, 2003.
RWS Limburg/IWACO: Internationale ecologische verkenning Maas (EVIM). Historisch ecolo-gische ori ¨entatie op het stroomgebied (fase 2a). Rijkswaterstaat Directie Limburg, Afdeling Integraal Waterbeleid, Maastricht, The Netherlands, 2000.
Sahin, V. and Hall, M. J.: The effects of afforestation and deforestation on water yields, J. 5
Hydrol., 178, 293–309, 1996.
Scott, D. F., Bruijnzeel, L. A., and Mackensen, J.: The hydrological and soil impacts of foresta-tion in the tropics, in: Forests, water and people in the humid tropics, edited by: Bonell, M. and Bruijnzeel, L. A., Cambridge University Press, Cambridge, UK, 622–651, 2005.
Thornthwaite, C. W.: An approach toward a rational classification of climate, Geographical Rev., 10
38, 55–94, 1948.
Thornthwaite, C. W., and Mather, J. R.: Instructions and tables for computing potential evapo-transpiration and the water balance, Publications in Climatology, 10, 183-243, 1957.
Trimble, S. W., Weirich, F. H., and Hoag, B. L.: Reforestation and the reduction of water yield on the southern Piedmont since circa 1940, Water Resour. Res., 23, 425–437, 1987. 15
Tu, M.: Assessment of the effects of climate variability and land use change on the hydrol-ogy of the Meuse river basin. Ph.D thesis, Vrije Universiteit Amsterdam, Amsterdam, The Netherlands and UNESCO-IHE, Delft, The Netherlands, 2006.
Van Deursen, W.: MEUSEFLOW 2.1, Laagwaterstudies Maasstroomgebied. Report num-ber RI-2988A, RIZA, Arnhem, The Netherlands, http://www.carthago.nl/Publications/ 20
MeuseLaagwater.PDF, 2000.
Van Geel, B., Buurman, J., and Waterbolk, H. T.: Archaeological and palaeoecological indi-cations of an abrupt climate change in The Netherlands, and evidence for climatological teleconnections around 2650 BP, J. Quat. Sci., 11(6), 451–460, 1996.
Ward, P. J.: A coupled climate-hydrological model for Meuse palaeodischarge model-25
ing: set-up and calibration. Technical report July 2007, Department of Palaeoclimatology and Geomorphology, Faculty of Earth and Life Sciences, Vrije Universiteit Amsterdam, Amsterdam, The Netherlands,http://ivm5.ivm.vu.nl/adaptation/project/files/File/Documents/ Report Meusepalaeo Methods.pdf, 2007.
Ward, P. J., Aerts, J. C. J. H., De Moel, H., and Renssen, H.: Verification of a coupled 30
climate-hydrological model against Holocene palaeohydrological records, Global and Plane-tary Change, 57, 283–300, doi:10.1016/j.gloplacha.2006.12.002, 2007.
Ward, R. C. and Robinson, M.: Principles of hydrology. McGraw-Hill Book Company, London,