ISSN 2393-4913, ISSN On-line 2457-5836
Does the Budget Expenditure Composition Matter for
Long-Run Economic Growth in a Resource Rich
Country? Evidence from Azerbaijan
Khatai Aliyev1,2, Ceyhun Mikayilov1
1Institute for Social Sciences and Humanities, Qafqaz University,
Khirdalan/Baku, Azerbaijan, 1E-mail: [email protected] 2Institute of Control Systems, Azerbaijan National Academy of Sciences,
Baku, Azerbaijan,2E-mail: [email protected]
Abstract This study investigates the role of budget expenditure composition over
Azerbaijan’s non-oil economic growth in the long-run by classifying public spending
as capital, social and other expenditures. Authors’ employ ARDLBT approach to
co-integration for the period of 2000Q1-2014Q4 to estimate long-run contribution of each spending category before-and-after the oil boom while controlling for oil-related factors. Empirical results endorse the validity of long-run association among variables. Results concluded insignificant negative impact of capital expenditures, and significant negative impact of other expenditures. However, social spending has statistically and economically strong positive impact over the non-oil output growth. Therefore, research findings confirm that public expenditure composition significantly matters for long-run non-oil economic growth, and social expenditures have the greater positive impact in a resource-rich economy, Azerbaijan. Research results are highly useful for the government officials to consider while planning the expenditures in order to minimize negative response of non-oil sector to the fiscal contraction.
Key words Fiscal policy, public expenditure composition, non-oil economic growth, Azerbaijan
JEL Codes: E62
1. Introduction
Since Keynes, the impact of public expenditures over economic growth has been subject to a lot of theoretical (Arrow and Kurz, 2002; Barro, 1990; Lee, 1992; Devarjan et al., 1996; Chen, 2006; Economides et al., 2011; among others) and empirical studies (Landau, 1986; Barro 1991; Foster and Henrekson, 2001; Cooray, 2009 etc.). Nevertheless, there is not commonly adopted view on the direction of this relationship. In this respect, scholars separate public expenditures as productive and non-productive (Sturm and Haan, 1995; Glomm and Ravikumar, 1997; Kneller
148
use of budget resources for national defense, building of national parks, and implementation of social programs are non-productive. In case of excess use of resources, seemingly productive expenditures could also be less effective or unproductive (Devarjan et al., 1996). Analyzing economic growth effects of public expenditure allocation is important to formulate the economic policy for long-run period (Colombier, 2011).
Certainly, contribution of public expenditures to economic growth of countries differs due to differences in allocation and efficient use of budget revenues. In this sense, classification of public expenditures as productive and non-productive seems to be case sensitive which makes rational allocation of resources across different expenditure units more crucial.
In resource rich countries, composition of budget expenditures is also important to develop non-resource sector of the economy and avoid negative symptoms of resource based economic performance, well known as resource curse in the literature. Such economies are faced with the issue of if the natural resources are blessing or curse, investigated in many studies (Newberry, 1986; Gelb, 1988; Lane and Tornell, 1996; Sachs and Warner, 1997; Hasanov, 2013a among others). The main problem related to the budget expenditure efficiency arises in such economies when governments use the revenues somehow to reduce discontent of the people. Kolstad and Soreide (2009) underlines corruption issue mainly in the form of rent-seeking and patronage as the main reason behind bad economic performance in resource rich countries.
Many studies also emphasize the role of political-institutional factors (Talvi and Vegh, 2005; Alesina, Campante and Tabellini, 2008) and corruption (Andersen and Aslaksen, 2008; Dietz, Neumayer, and Soysa, 2007) behind fiscal policy behavior in such economies.
As a resource rich country, Azerbaijan thanks to its rich oil and gas reserves, had been living oil boom period of its history since 2005 until the end of 2014 (Aliyev and Gasimov, 2016). In parallel to increasing revenues from oil industry, the amount of budget expenditures also flew upward sharply within this period. However, the country is challenged with lowering oil prices since the end of 2014 and resource dependence has also affected fiscal policy behavior of the government. And
elimination of “unnecessary” expenditures is priority for Azerbaijan while building
new budget expenditure allocation strategy for the near future.
Therefore, investigation of public expenditure productivity and efficiency of
expenditure allocation is necessary for Azerbaijan. Here, we hypothesis that public
Vol. 2 (2), pp. 147–168, © 2016 AJES
2. Theoretical justification
Direction of causality between public expenditures and economic growth has been
subject to the studies under the validity of Wagner’s law, and Keynesian hypothesis,
and empirically tested both for developing and developed countries. The conceptual
framework of both Wagner’s law and Keynesian hypothesis could be explained by
the classical view of Aggregate Demand and Aggregate Supply (AD-AS) model.
However, each promotes different direction of causality. Thus, in Wagner’s law it is
hypothesized that public expenditure is an endogenous factor depended on the growth of national income (Wagner, 1890) while Keynesian approach considers public expenditure as an exogenous factor explaining economic growth (Keynes, 1936). According to Aliyev and Gasimov (2016), expansionary fiscal policy trend was mostly due to resource revenues and financed by direct transfers from the State Oil Fund of Azerbaijan Republic (SOFAZ), not because of non-oil national income growth. Here we take only non-oil GDP as the smaller part of national income in resource rich countries like Azerbaijan, and therefore only Keynesian hypothesis is tested.
Within AD-AS framework, as the government expenditures increases, it might shift the AD curve to the right. In other words, expansionary fiscal policy should result in better economic performance or higher economic growth and vice versa. When resource rich economies are analyzed, increasing public expenditures creates additional demand for non-resource national products under ceteris paribus condition. For Azerbaijan, this spending effect is empirically revealed in Hasanov (2013b). However, if public expenditures create demand mainly for imported products then generate less contribution to the national economy. Meanwhile, if increasing size of public sector expenditures pulls resources from the private sector (especially well-skilled human capital), non-resource private sector will be negatively
affected. In this context, public expenditure category with lower demand generation
for imported products, and less resource movement impact will have greater impact. About the second hypothesis why social expenditures is expected to have greater impact, note that such spending is done mainly as payment of wages, pensions and other type of social responsibilities of the government, achieved directly by the citizens, turned back to the economy as the demand for consumption purposes. Moreover, this category expenditures is expected no to have substantial resource movement effect as much as remaining two categories. Simultaneously, corruption is another main factor to consider for expenditure productivity in resource rich
countries, defined as “misuse of public or entrusted authority for personal gain” in
150
and other expenditures than the social expenditures. Because, social expenditure receivers could be considered as utility maximizers.
3. Literature review
Existing literature on the relationship between public expenditure and economic growth relationship has been studied broadly. In case of resource rich economies, resource revenues injected into the economy by using fiscal channels, especially in developing countries may lead to arise of Dutch Desease symptoms (Krugman, 1987; Auty, 2001), weak institutional development (Sala-i-Martin and Subramanian, 2003; Gylfason, 2004), and etc. Previous researches do not investigate only the impact of total budget expenditures, estimate effects of different budget expenditure categories over economic growth as well.
For example, Devarjan et al. (1996) employ OLS to estimate the data covering 43
developing countries for the period of 1970-1990. Their findings show that economic growth effect of current expenditures is positive and statistically significant while impact of capital expenditures is found to be negative. Gupta et al. (2005) have studied public expenditure composition factor in a sample covering 39 low-income countries for the period of 1990-2000, estimated by using Generalized Method of Moments (GMM). Their findings reveal that countries with concentration of public spending on wages demonstrate lower economic growth performance while capital and nonwage purchases dominated allocation of expenditures positively affects the growth. In case of Swiss, Colombier (2011) analysis the impact of budget expenditure composition over economic growth for 1960-2005 by employing an Autoregressive Distributed Lag (ARDL) model with an error-correction
representation. Author’s conclusion also confirms that expenditure composition matters for economic growth. Thus, public expenditures on transport infrastructure, education and administration stimulate output expansion which is crucial to consider in the context of tightening budget constraints (Colombier, 2011).
Ali et al. (2013) employ ARDL model to investigate the impact of public expenditure sub-categories in Pakistan for 1972-2009 by classifying that as development and current expenditures. Their finding reveals that development expenditure influences economic growth in Pakistan positively while current expenditure does not lead to higher growth performance.
Within endogenous growth framework, Gosh and Grogeriou (2008) use GMM techniques for panel data consisted by 15 developing countries for the period of 1972-1999 conclude with existence of statistically significant impact of both current (positive) and capital expenditures (negative) over the growth rate.
Because this research takes Azerbaijan’s fiscal policy issues into consideration,
Vol. 2 (2), pp. 147–168, © 2016 AJES
Distributed Lags Bounds Testing (ADLBT) approach, Hasanov and Alirzayev (2012) have investigated the impact of total budget expenditures over non-oil economic growth for 2001Q1-2012Q4 period and found out existence of significant positive relationship. Hasanov (2013a) also investigated this relationship by using single equation-based, ADLBT approach and system-based co-integration approach by Johansen (1988) and Johansen and Juselius (1990) for the period 1998Q4-2012Q3 ended with similar finding. While examining Dutch disease symptoms in Azerbaijan
economy, Hasanov (2013b) discovered a “spending effect” in the economy created
by budget expenditures. Existence of positive contribution of total public expenditures and/or its components is also found in Aliyev (2013) who analyzed oil-exporting countries including Azerbaijan, in Aliyev and Nadirov (2016a) who employed ARDLBT approach to cointegration for the period of 2000Q1-2015Q2. Before, Abbasov (2013) has calculated optimal allocation of budget expenditures in Azerbaijan which maximizes GDP per capita growth. In this research, author employs OLS method to estimate the objective function, and Lagranje multiplier method to calculate optimum points for allocation across capital expenditures, expenditures for wage and pensions, and other expenditures for 2001:Q1-2008:Q4, and 2001:Q1-2012:Q3 period. Abbasov (2013) concludes with the optimal allocation proportion for capital, wage and pensions, and other expenditures respectively 26%, 25%, and 49% for 2001:Q1-2008:Q4, 22%, 18%, and 60% for 2001:Q1-2012:Q3 period.
Many empirical studies on Azerbaijan investigate the relationship in total basis or the impact of total budget expenditures rather than dividing them into different categories (Hasanov and Alirzayev, 2012; Hasanov, 2013a, 2013b; Aliyev and Nadirov, 2016a). Main limitation in Abbasov (2013) who applies this categorization is not controlling for oil related factors (oil prices, and oil production) supposed to be correlated with economic growth indicators which are included in our estimations. Moreover, Abbasov (2013) takes GDP per capita as the dependent variable covering production in both oil and non-oil sector of the economy. However, budget expenditures should not have direct impact over oil sector GDP, and development of non-oil sector is/must be priority for a resource rich country while allocating budget expenditures which is given as the dependent variable in this study. One more contribution presented by this research is covering wider period in analysis including latest statistics.
4. Methodology of research
4.1. Data
152
method with 2000Q4 as the base period. Definition of employed variables is presented below:
Real Non-oil GDP (RGDPN) is the amount produced output in the economy excluding oil sector contribution, measured in million manat. Data is obtained from the Central Bank of Azerbaijan (CBAR) database, provided in statistical bulletins of
CBAR which could be reached online at
http://www.cbar.az/pages/publications-researches/statistic-bulletin/.
Budget expenditures to the national economy (REXPEC) are the amount of capital expenditures from the state budget, measured in millions of manat. Yearly data is obtained from the State Statistical Committee of Azerbaijan Republic, and quarterly date of total budget expenditures is taken from the CBAR database. Then we found percentage shares of quarterly expenditures in total for all quarters, and simply calculate quarterly amounts for REXPEC by multiplying the shares of quarterly total budget expenditures by the amount of yearly REXPEC for each quarter.
It is noteworthy to express that quarterly data for remaining two other budget expenditure allocation items (expenditures for social-cultural activities, and other expenditures) employed in this research is also calculated by using the same methodology discussed above, and data source is the same.
Budget expenditures for social-cultural activities (REXPSOC) is the amount of budget expenditures spend for corresponding purposes, covering expenditures for education, health, social protection and security, and other type of expenditures used for social and cultural activities, measured in millions of manat. Note that
education expenditures covers education costs from the central budget such as
financing of general educational expenditures and other related institutions and events. Health expenditures comprises costs related to maintenance of hospitals, outpatient clinics and ambulatories, and other related services as well as costs related to applied research in the field of public services. Expenditures for social protection and security consisted of the amount of costs from the central budget for remuneration, pension and benefits, purchase of medicines, dressing materials, food products etc. for social purposes.
6.0 6.4 6.8 7.2 7.6 8.0 8.4
00 01 02 03 04 05 06 07 08 09 10 11 12 13 14 LOG_RGDPN
2
3 4 5 6 7 8
00 01 02 03 04 05 06 07 08 09 10 11 12 13 14 LOG_REXPEC
Vol. 2 (2), pp. 147–168, © 2016 AJES 4.0 4.5 5.0 5.5 6.0 6.5 7.0
00 01 02 03 04 05 06 07 08 09 10 11 12 13 14 LOG_REXPSOC 3.5 4.0 4.5 5.0 5.5 6.0 6.5 7.0
00 01 02 03 04 05 06 07 08 09 10 11 12 13 14 LOG_REXPOTH 2.8 3.2 3.6 4.0 4.4 4.8 5.2
00 01 02 03 04 05 06 07 08 09 10 11 12 13 14 LOG_OPRC 5.6 5.8 6.0 6.2 6.4 6.6 6.8 7.0
00 01 02 03 04 05 06 07 08 09 10 11 12 13 14 LOG_OPRN
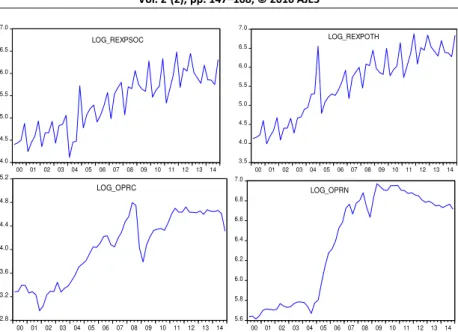
Figure 1. Time profile of the logs of variables
Other budget expenditures (REXPOTH) includes the amount of expenditures for science, maintenance of the judicial authority, law-enforcement and prosecution bodies as well as covers other types of costs not included within above mentioned categories, especially defense and security costs, measured in millions of manat.
Oil production (OPrn) presents quarterly oil production records in Azerbaijan, measured in thousands barrels per day, in average. Monthly data is taken from
Trading Economics database (retrieved from http://www.tradingeconomics.com/
azerbaijan/crude-oil-production) and converted to quarterly data by employing the
method of finding the average in Excel 2010.
Oil price (OPrc) indicates the quarterly world average price of one barrel oil. Data is
obtained from IndexMundi database. Originally data is monthly but was converted to
quarterly frequency by using the method of finding the average in Excel 2010.
Figure 1 presents profile of log of all variables – RGDPN, REXPEC, REXPSOC,
154
4.2. Data analysis
Before discussing empirical methodology and findings, it is noteworthy to overview the data statistics in short. This enables to see also the value range of each variable and its share in total which will prevent misunderstandings while interpreting elasticity coefficients below. Table 1 tabulates basic descriptive statistics of the variables for the whole period as well as before-and-after the oil boom.
Table 1. Descriptive statistics of the variables (million AZN)
Whole period: 2000Q1-2014Q4
Variable Obs. No. Mean Maximum Minimum Std.Dev. Sum RGDPN 60 1697.215 3445.780 515.0000 840.1434 101832.9 REXPEC 60 375.4160 1288.890 17.96000 339.5447 22524.96 REXPSOC 60 252.6270 652.5800 69.53000 150.2544 15157.62 REXPOTH 60 339.0777 974.3800 54.18000 253.5557 20344.66
OPrc 60 65.26633 121.1000 19.30000 31.80699 -
OPrn 60 664.400 1066.000 274.0000 296.3564 39684.00
Before the oil boom: 2000Q1-2005Q4
RGDPN 24 939.0617 1455.540 515.0000 253.3167 22537.48 REXPEC 24 47.49958 138.4890 17.97400 31.35865 1139.990 REXPSOC 24 120.9258 305.7330 61.08400 53.28565 2902.219 REXPOTH 24 135.8451 703.7750 54.04200 130.0381 3260.283
OPrc 24 32.73958 56.96000 19.30000 10.53077 -
OPrn 24 325.7917 532.0000 274.0000 59.58332 7819.000
After the oil boom: 2006Q1-2014Q4
RGDPN 36 2202.651 3445.780 964.3100 700.5475 79295.44 REXPEC 36 591.9618 1288.124 160.8560 266.2861 21310.62 REXPSOC 36 338.8964 652.6960 135.4160 131.6815 12200.27 REXPOTH 36 498.6383 974.0270 177.7640 213.4525 17950.98
OPrc 36 86.95083 121.1000 44.20000 20.57681 -
OPrn 36 890.1389 1066.000 553.0000 121.1755 32045.00
Source: Authors’ own completion
2000-Vol. 2 (2), pp. 147–168, © 2016 AJES
2005 while average daily oil production also increased more than 2.7 times within the compared periods. On the other hand, of 58 billion AZN total expenditures, only less than 12.6% was spent before the oil boom (2000-2005) while remaining 87.4% after the boom. This is observed in amount of average quarterly budget expenditures across all three directions – capital, social, and other which is 12.5 times, 2.8 times, and 3.7 times more than those in before the oil boom, respectively. All there un-proportional changes signals potential unproductive allocation of budget expenditures in Azerbaijan.
Table 2. Descriptive statistics of the allocation of budget expenditures (as share of total)
Whole period: 2000Q1-2014Q4
Variable Obs. No. Mean Maximum Minimum Std.Dev. REXPEC 60 0.311515 0.460231 0.117004 0.125985 REXPSOC 60 0.327665 0.500802 0.213220 0.109070 REXPOTH 60 0.360790 0.398322 0.320546 0.024149
Before the oil boom: 2000Q1-2005Q4
REXPEC 24 0.152838 0.207736 0.117792 0.037116 REXPSOC 24 0.454850 0.500802 0.393927 0.039733 REXPOTH 24 0.380319 0.398322 0.369689 0.009730
After the oil boom: 2006Q1-2014Q4
REXPEC 36 0.409304 0.460231 0.328981 0.035794 REXPSOC 36 0.242925 0.276957 0.213220 0.023197 REXPOTH 36 0.347771 0.394062 0.320546 0.022022
Source: Authors’ own completion
In this context, table 2 provides very useful representation of budget expenditure allocation statistics while taking the whole period into consideration as well as the periods before-and-after the oil boom, separately.
Before the oil boom, social expenditures dominate in the central budget followed by the other expenditures. With small budget, government did not spend much on economy. This is understandable as the priority of government might be implementation of social projects and maintaining security and defense of the country.
However, proportional allocation significantly changes after when the oil boom
observed. With the huge easy gained revenues from oil sector, Azerbaijan’s budget
156
2.7 times greater than the previous period as share of total. Here also other expenditures follow the dominant category with nearly 35%. Interesting point is sharp fall in the share of social expenditures by approximately 9%, decreased to 24%. When the whole period is considered, allocation of expenditures across the categories seems to be almost proportional, dominated with other expenditures.
4.3. Unit Root Test
To examine the order of integration of the given variables before conducting a co-integration analysis, the Augmented Dickey-Fuller (Dickey and Fuller, 1981) unit root test was employed. Note that ADF tests the null hypothesis that a given time series is non-stationary.
For a given time series variable denoted as y, ADF statistics value is the t-ratio on
b1 from the equation below:
Here, Δ is the first difference operator; b0 is a constant term; k represents number of
lags; trend is linear time trend; white noise residuals and the lag order are εt and i,
respectively. The test is broadly discussed in Dickey and Fuller (1981), Stock and
Watson (1993), Dolado et al. (1990), Enders (2010) with both advantages and
disadvantages.
4.4. Autoregressive Distributed Lag Bounds Testing (ARDLBT) Approach
Autoregressive Distributed Lag Bounds Testing approach to co-integration (ARDLBT hereafter) is suggested as an alternative approach to the co-integration in
Pesaran et al. (2001). In comparison with the similar approaches, ARDLBT has
several advantages such as applicability in small samples, and easy application by employing OLS. Moreover, there is not any endogeneity problem while employing ARDLBT approach. One more advantage of this approach is possibility of simultaneously estimating long-run and short-run coefficients which is applicable
with both I(1) and I(0) series or combination of them (Pesaran et al. 2001, Sulaiman
et al., 2010). Due to working with small sample size, ARDLBT approach to cointegration is more compatible to employ in this research.
Methodologically, ARDLBT approach is built over following several stages in
sequence given in Pesaran et al. (2001). First stage is construction of an
unrestricted ECM based on the equation below.
Vol. 2 (2), pp. 147–168, © 2016 AJES
Where y is the dependent and x is the explanatory variable. u denotes white noise
errors. c0 is the drift coefficient while θi represents long-run coefficients and ωi and
φi symbolize short-run coefficients.
However, we should correctly define optimal lag length of the first differenced right-hand side variables while employing ARDLBT approach because of sensitiveness of finding co-integrating relationship to correct lag order selection (Pesaran et al., 2001: 23). If there is not serial autocorrelation in residuals, minimum Akaike and Schwarz information criteria values provides optimal lag length in the model
(Pesaran et al., 2001). Schwarz information criterion is preferred to the former one
for small sample size (Pesaran et al., 1999).
The second stage is testing co-integrating relationship by using Wald-test (or the
F-Test) on the θi coefficients from the constructed ECM. Here, we test null hypothesis
of “no co-integration” defined as: H0: θ1= θ2 = θ3=0 against the alternative hypothesis of H1: θ1 ≠ θ2 ≠ θ3 ≠ 0.
Note that in the ARDLBT co-integration test F-statistics have non-standard distribution. Therefore, conventional critical values of F- distribution are not valid. To avoid this problem, critical values of F-distribution calculated by Pesaran and
Pesaran should be employed (see: Pesaran and Pesaran, 1997 or Pesaran et al.,
2001).
In the ARDLBT co-integration test we can reject the null hypothesis if the value of F-statistic obtained from the sample is greater than the upper bound of the critical value at a given significance level. In an opposite situation where computed F-statistic value from the sample is lower than the low bound of the critical value corresponding to a given significance level. Test result is inconclusive if the computed F-statistic value is within up-and-low bound of the critical value at a certain level of significance.
Following the second stage test results which support existence of co-integration relationship among the variables, at the third stage we can estimate/calculate the long-run coefficients by using Bewley transformation (Bewley 1979) or manually
setting to zero on the basis of the equation (2) and solving
this equation for y as below:
(2)
158
At the last stage, stability of the co-integration relationship is tested. For this purpose, we calculate long-run residuals on the basis of equation (3) and employ that in the equation (2) by removing level variables and related coefficients:
Where,
Based on the equation above, the co-integration relationship is considered to be stabile if γ gets the value between -1 and zero, and statistically significant. Note that stability condition implies temporariness of the short run deviations from the long-run equilibrium path which correct towards the latter one within the next periods.
4.5. Small Sample Bias Correction in ARDLBT Approach
Existing literature includes different views related to the validity of critical values of F-distribution in the cases of small and large size samples. Despite of calculation of the upper and lower critical values of F-distribution by Pesaran and Pesaran (1997) by employing sample sizes of 500 and 1000 even 20 000 and 40 000 replications respectively, these values are challenged to be applicable for small sample sizes in Narayan (2005). Narayan (2004, 2005) argues that critical values by Pesaran and Pesaran (1997) are not for small sample sizes. In order to justify his argument, Narayan has compared his own critical values on 31 observations with the critical values in Pesaran et al. (2001), with four regressors and at the 5% level of
significance. The results supported Narayan’s argument. That is why critical values
in Narayan (2005) will be also employed in our ARDLBT co-integration test in order to avoid the issues due to relatively small sample size.
5. Empirical results
5.1. Unit root test results
Before applying ARDLBT approach, defining order of integration of variables is important because many economic time-series variables demonstrate non-stationarity without or with trend around the mean. Table 3 reports ADF unit root test results with only intercept and with trend and intercept provides the information about order of integration of the variables.
Vol. 2 (2), pp. 147–168, © 2016 AJES
Table 3. ADF unit root test results
Variables Intercept Trend and intercept
I (0) I (1) I (0) I (1)
LOG_RGDPN -0.92 -5.33*** -2.41 -14.98***
LOG_REXPEC -1.56 0.08 -9.19*** -9.48***
LOG_REXPSOC -0.83 -14.31*** -2.09 -14.20***
LOG_REXPOTH -1.07 -10.24*** -6.91*** -10.19**
LOG_OPrc -1.23 -1.74 -6.45*** 6.44***
LOG_OPrn -1.34 -0.21 -5.58*** -5.71***
Note: *, ** and *** denote significance level of 10%, 5%, and 1% levels, respectively. Lag length is defined automatically based on Schwarz information criteria (SIC) of 10 maximum lags. P-values are one-sided MacKinnon (1996) values.
While modelling the elasticity relationships, all variables are included to the model as natural log. That is why existence of unit root problem is tested over natural logs of the variables. Unit root test results indicates none is I(0) without trend, but REXPEC, REXPOTH, OPrc, and OPrn are trend stationary, or I(0) while trend is included to test equation. However, natural logarithm of RGDPN and REXPSOC are I(1) in both cases. As ARDLBT is applicable with also combination of variables with I(0) and I(1), we can proceed with further estimations.
5.2. The Results from the ARDLBT Approach
Results from the application of ARDLBT approach to co-integration are based on the equation (2) with some modifications. Here, we estimate the relationships of interest with-and-without considering the issue of oil boom period. In this context, equation (5) and (6) are estimated separately by using E-Views 9 econometric software.
Equation (5) estimates the effects of expenditure composition elements without measuring the difference in the magnitude of effects for each item after the oil boom while equation (6) measures also this impact strength distinction. In both equations,
yt is the dependent variable or non-oil GDP. X1…5 represent dynamic regressors –
REXPEC, REXPSOC, REXPOTH, OPrc, and OPrn respectively all in natural logarithm, also codded as k Є[1;5] θS, ωi, φiand σi in the equation (5), and S, , i, δi
and μi in the equation (6) stand for coefficients while ut represents residuals and t
denotes the time.
160
Ψi and xi cover the list of fixed regressors, respectively. In equation (5) fixed regressors include seasonal dummies (season I, and IV) and outliers (2001Q2, and 2013Q4). However, fixed regsessors in equation (6) covers also intersection variables (log (rexpec)*policy,log(rexpsoc)*policy, and log(rexpoth)*policy)in addition to those in equation (5). Here, policy is a dummy variable represents budget expenditure effectiveness change before-and-after the oil boom, equals 1 after the launch of oil boom (2006Q1) and 0 otherwise.
Optimal lag size for the models is automatically selected by using E-Views 9 econometric software while using ARDL method for the estimation according to Akaike Information Criteria. Numbers of evaluated models for the lag selection is 12500 for both equations. Sequence of dynamic regressors in the models is as following: RGDPN, REXPEC, REXPSOC, REXPOTH, OPrc, OPrn. Considering this sequence, optimal lag size for equation (5) and (6) is determined as [4, 3, 4, 4, 4, 4], and [4, 4, 4, 3, 4, 4] which makes AIC value minimum. It is noteworthy to re-emphasize that all dynamic regressors are included to the models as natural
logarithm which will enables to calculate elasticity of Azerbaijan’s non-oil GDP to each regressor.
After defining the optimal lag size, we estimate each model. To conserve the space, results are not reported here and will be provided if requested.
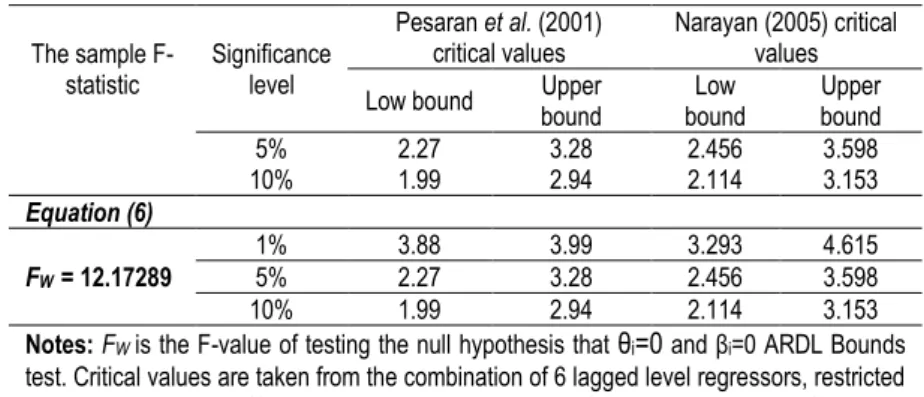
Next stage in testing for the existence of co-integration or long-run relationship is testing joint significance of long-run coefficients of the dynamic regressors (θS in equation (5), and S in equation (6), respectively). ARDL Bounds test statistics provide supporting evidence for existence of co-integration in both equations at 1% level of significance. Therefore, we can proceed with finding long-run equations for both equations (5) and (6).
Table 4. F-statistic for testing an existence of co-integration
The sample F-statistic
Significance level
Pesaran et al. (2001) critical values
Narayan (2005) critical values
Low bound Upper bound
Low bound
Upper bound
Null hypothesis: There is no long-run relationship
Equation (5)
FW = 11.23243 1% 3.88 3.99 3.293 4.615
Vol. 2 (2), pp. 147–168, © 2016 AJES
The sample F-statistic
Significance level
Pesaran et al. (2001) critical values
Narayan (2005) critical values
Low bound Upper bound
Low bound
Upper bound
5% 2.27 3.28 2.456 3.598
10% 1.99 2.94 2.114 3.153
Equation (6)
FW = 12.17289
1% 3.88 3.99 3.293 4.615
5% 2.27 3.28 2.456 3.598
10% 1.99 2.94 2.114 3.153
Notes: FW is the F-value of testing the null hypothesis that θi=0 and i=0 ARDL Bounds test. Critical values are taken from the combination of 6 lagged level regressors, restricted intercept and no trend (See: Pesaran et al., 2001, pp. 300) and 60 observations (Narayan, 2005, pp. 1987).
After confirming existence of co-integration relationship, we calculate long-run coefficients for the model regressors. Table 5 tabulates long-run coefficients with p-values in co-integration equation for both models. Note that stability condition is maintained as the value of Υ is negative and statistically significant for both models. Almost within one quarter, short-run deviations correct towards long-run equilibrium path.
Table 5. ARDL long-run estimation results
162
Panel B: Statistics and Residuals Diagnostics tests results Equation (5)
Equation (6)
Notes: Dependent variable is lrgdpnt; σ is standard error of regression; x2SC, x2ARCH and x2HETR denote chi-squared statistics to test the null hypotheses of no serial correlation, no autoregressive conditioned heteroscedasticity, and no heteroscedasticity in the residuals; JBN and FFF indicate statistics to test the null hypotheses of normal distribution and no functional miss-specification respectively; Probabilities are in brackets. Method; ARDL; Estimation period: 2000Q1-2014Q4.
6. Interpretation of the results
Both previous studies and this research finding support the view that the relationship between public expenditure and economic growth is not always in the same direction, and changes across different expenditure units. For resource rich countries, patterns of this relationship is expected to be much more complex as
those countries witnesses “paradox of plenty” for a period in their economic
development history. However, the policy outcome may be unsuccessful or ineffective depend on the model for use and management of revenues. Injection of revenues from the resource sector to the national economy through fiscal expansion requires well-planned efficient allocation of public expenditures, supported by this research finding.
According to the table 4, long-run relationship exists in both equations. Equation (5) estimates the contribution of public expenditures without taking oil boom effect on the expenditure efficiency into consideration while equation (6) covers this biasedness. The coefficient representing elasticity of non-oil output growth to capital expenditures is unexpectedly neither statistically nor economically significant, negative in both models. Contribution of capital expenditures to non-oil sector has been 0.63% lower in comparison with the previous period. It is noteworthy to remember that capital expenditures, in other words, infrastructure spending was
Vol. 2 (2), pp. 147–168, © 2016 AJES
expenditures is a reality in the context of long-run non-oil sector development, especially within the oil boom period.
The impact of other expenditures which is consisted of mainly defense and administration spending is also noteworthy to consider. Long-run contribution is found to be negative and statistically significant in both models. Nevertheless, its efficiency to promote non-oil sector output production had been significantly higher after the oil boom observed. Still, research reveals negative correlation in the long-run. This is quite reasonable as national defense expenditures are within
“unproductive” spending category (Carboni and Russu, 2013). Probably, this negative impact has been “weakened” due to including administration expenditures
into this category. Thus, Aliyev and Nadirov (2016b) reveal administration
expenditures as the most “productive”.
The role of social spending from the state budget in encouraging development of
Azerbaijan’s non-oil sector seems to be significantly greater than the other categories. Results provide statistically and economically significant and positive contribution of social spending to the non-oil sector. More precisely, 1% increase in amount of social spending leads to 3% greater non-oil GDP growth while holding other factors fixed in equation (5). Although this elasticity is substantially lower in equation (6), it is still statistically and economically significant, and larger than the elasticity coefficients in previous empirical studies on Azerbaijan (Hasanov and Alirzayev, 2012; Hasanov, 2013a; Aliyev and Nadirov, 2016a, 2016b). In consistent
with paradox of plenty assumption in consistent, and the statement in Devarjan et al.
(1996), “productivity” of social expenditures has also significantly decreased within
the oil boom. 0.83% lower efficiency is crucial amount should be taken into consideration by Azerbaijan fiscal policy-makers.
7. Discussions
Since the end of 2014, oil boom period is ended and new post-oil boom period is launched in Azerbaijan (Aliyev and Gasimov, 2016). In light of decreasing oil prices and fiscal challenges in front of the government, fiscal contraction and efficiency messages are frequently observed at the official level. In the closing speech at the meeting of the Cabinet of Ministers dedicated to the results of socioeconomic development in 2014 and objectives for 2015, the prezident of Azerbaijan, Ilham
Aliyev emphasized that “we can’t allow waste”, “we should improve management
principles in every state agency and state-owned company”, and “we will not give
our consent to projects that are not a priority”. In addition, while performing closing speech at the conference dedicated to results of second year implementation of the
State Program on socio-economic development in 2014-2018, the prezident’s
164
experience of developed countries” shows the re-consideration of public expenditure efficiency issue.
In this context, our empirical findings supports both hypotheses put forward in this investigation, and confirms that Azerbaijan government should carefully re-consider the composition of public expenditures. Capital expenditures are unproductive for development of non-oil sector. And the efficiency of both capital and social spending are decreased substantially in oil-boom period, which is mainly depending on political-institutional factors and/or corruption. The quality of management and oversight of public expenditures is also disputable and open to further investigations. Through decreasing the misuse of resources and enhancing oversight of the implementation of projects financed by the state budget, government may avoid potential contactionary fiscal policy threat to the non-oil sector. While contracting the budget, policy-makers should be careful and decrease capital and other expenditures, not the social category as such spending contributes a lot to the non-oil sector production.
8. Conclusions and Policy Implications
The research investigates the role of budget expenditure factor in development of non-oil output growth in Azerbaijan economy. Employing quarterly data for the period of 2000Q1-2014Q4 and ARDLBT approach to co-integration, we analyze long-run contribution strength of different public expenditure categories - namely capital, social, and other expenditures to the non-oil economic growth. Results demonstrate existence of co-integration relationship among the variables.
Estimation results endorsed our both hypotheses that expenditure composition is a crucial factor to consider while planning non-oil sector development as the priority for Azerbaijan, especially in time of fiscal contraction. Results concluded insignificant negative impact of capital expenditures, and significant negative impact of other expenditures while spending from the state budget for social purposes encourage non-oil producers the most.
Vol. 2 (2), pp. 147–168, © 2016 AJES
References
Abbasov, J. (2013). Optimum Budget Expenditures Having a Maximum Influence on the Personal Income per Capita. The Case of Azerbaijan. Central Bank of Azerbaijan. Unpublished manuscript.
Aliyev, I. (2013), Essays on Natural Resource Impact, Center for Economic Research and Graduate Education, Charles University Prague. Dissertation.
Retrieved from http://www.cerge-ei.cz/pdf/dissertations/2013-aliyev.pdf, 01.11.2015.
Aliyev, K. and Gasimov, I. (2016). Fiscal Policy Implementation in Azerbaijan before-within-and-after the oil boom period. Institute for Social Sciences and Humanities, Qafqaz University. Unpublished manuscript.
Aliyev, K. and Nadirov, O. (2016a). Modelling Azerbaijan’s fiscal policy impact over
non-oil GDP: ARDLBT approach. Institute for Social Sciences and Humanities, Qafqaz University. Unpublished manuscript.
Aliyev, K. and Nadirov, O. (2016b). Modelling “productivity” of Azerbaijan’s budget
expenditure items before-within-and-after the oil boom. Institute for Social Sciences and Humanities, Qafqaz University. Unpublished manuscript.
Ali, S., Rabbi, F., Hayat, U. and Ali, N. (2013). The Composition of Public
Expenditures and Economic Growth: Evidence from Pakistan. International Journal
of Social Economics 40 (11), 1010-1022.
Alesina, A., Campante, F. R. and Tabellini, G. (2008). Why is Fiscal Policy often
Procyclical?. Journal of the European Economic Association 6 (5), 1006-1036.
Andersen, J.J. and Aslaksen, S. (2008). Constitutions and the Resource Curse.
Journal of Development Economics 87 (2), 227-246.
Arrow, K.J. and Kurz, M. (1969). Optimal public investment policy and controllability
with fixed private savings ratio. Journal of Economic Theory 1, 141-77.
Auty, R. (2001). Resource Abundance and Economic Development. Oxford: Oxford
University Press.
Barro, R. (1990). Government Spending in a Simple Model of Endogenous Growth.
Journal of Political Economy 98 (5), 103-125.
Barro, R. (1991). Economic growth in a cross section of countries. Quarterly Journal
of Economics 106, 407-443.
Bewley, R.A. (1979). The Direct Estimation of the Equilibrium Response in a Linear
Model. Economics Letters 3 (4), 357-361.
Carboni, O.A. and Russu, P. (2013). A Model of Economic Growth with Public
Finance: Dynamics and Analytic Solution. International Journal of Economics and
Financial Issues, 3 (1), 1-13.
Chen, B. (2006). Economic growth with an optimal public spending composition.
166
Cooray A. (2009). Government Expenditure, Governance and Economic Growth.
Comparative Economic Studies 51 (3), 401-418.
Colombier, C. (2011). Does the Composition of Public Expenditure Affect Economic
Growth? Evidence from the Swiss Case. Applied Economics Letters 18 (16),
1583-1589.
Dietz, S., Neumayer, E. and De Soysa, I. (2007). Corruption, the Resource Curse
and Genuine Saving. Environment and Development Economics 12 (1), 33-53.
Dickey, D. and Fuller, W. (1981). Likelihood Ratio Statistics for Autoregressive Time
Series with a Unit Root. Econometrica 49, 1057-1072.
Doldado, J., Jenkinson, T. and Sosvilla-Rivero, S. (1990). Cointegration and Unit
Roots. Journal of Economic Surveys. 4, 249-273.
Devarajan, S., Vinaya, S. and Heng-fu, Z. (1996). The Composition of Public
Expenditure and Economic Growth. Journal of Monetary Economics 37, 313-344.
Economides, G., Park, H. and Philippopoulos, A. (2011) How should the government allocate its tax revenues between productivity enhancing and utility
enhancing public goods?. Macroeconomic Dynamics 15, 336-364.
Enders, W. (2010). Applied Econometrics Time Series, University of Alabama, Wiley
Series in Probability and Statistics, 2nd 4th edition.
Folster, S., and Henrekson, M. (2001). Growth effects of government expenditure
and taxation in rich countries. European Economic Review 45, 1501-1520.
Gelb, A. (1988). Oil Windfalls: Blessing or Curse? New York, Oxford University Press.
Gupta, S., Clements, B., Baldacci, E. and Mulas-Granados, C. (2005). Fiscal Policy,
Expenditure Composition, and Growth in Low-Income Countries. Journal of
International Money and Finance 24, 441-463.
Ghosh, S., Gregoriou, A. (2008). The Composition of Government Spending and
Growth: Is Current or Capital Spending Better?. Oxford Economic Papers 60,
484-516.
Glomm, G. and Ravikumar, B. (1997). Productive Government Expenditures and
Long-run Growth. Journal of Economic Dynamics and Control 21, 183-204.
Hasanov, F. (2013a). The Role of the Fiscal Policy in the Development of the
Non-Oil Sector in Azerbaijan. Hazar Raporu 4, 162-73.
Hasanov, F. (2013b). Dutch disease and the Azerbaijan economy. Communist and
Post-Communist Studies 46, 463–480.
Hasanov, F. and Alirzayev, E. (2012). The government spending, FDIs and the non-oil sector of the non-oil-exporting economy. The Center for Socio-Economic Research, Qafqaz University. Unpublished manuscript.
Vol. 2 (2), pp. 147–168, © 2016 AJES
growth. Institute for Social Sciences and Humanities, Qafqaz University. Unpublished manuscript.
Keynes, J.M. (1936). The General Theory of Employment, Interest and Money. New
York: Harcourt, Brace and Co.
Kolstad, I. and Soreide, T. (2009). Corruption in Natural Resource Management:
Implications for Policy Makers. Resources Policy 34, 214-226.
Kneller, R., Bleaney, M. F. and Gemmel, N. (1999). Fiscal Policy and Growth:
Evidence from OECD Countries. Journal of Public Economics 74, 171-190.
Krugman, P. (1987). The Narrow Moving Band, the Dutch Disease and the Competitive Consequences of Mrs. Thatcher: Notes on Trade in the Presence of
Dynamic Scale Economies. Journal of Development Economics 27, 41-55.
Landau, D. (1986). Government and Economic Growth in the Less Developed
Countries: An Empirical Study of 1960-80. Economic and Culture 35, 35-76.
Lane, P.R. and Tornell, A. (1996). Power, Growth and the Voracity Effect. Journal of
Economic Growth 1, 213-241.
Lee, J. (1992). Optimal size and composition of government spending. Journal of the Japanese and International Economies 6, 423-439.
Narayan, P.K. (2004). An Econometric Model of Tourism Demand and a Computable General Equilibrium Analysis of the Impact of Tourism: the Case of the
Fiji Islands. Unpublished PhD thesis, Department of Economics, Monash University,
Melbourne, Australia.
Narayan, P.K. (2005). The Saving and Investment Nexus for China: Evidence from
Cointegration Tests. Applied Economics 37, 1979-1990.
Newberry, D.M.G. (1986). “Round-Table Discussion” in J. Peter Neary and Sweden
van Wijnbergen eds. Natural Resources and the Macroeconomy, Oxford, Basil,
Blackwell.
Pesaran, H.M. and Shin, Y. (1999). An Autoregressive Distributed Lag Modeling
Approach to Cointegration Analysis, in S. Strom, Econometrics and Economic
Theory in the 20th Century: The Ragnar Frisch Centennial Symposium, pp. 371-413, Cambridge University Press, Cambridge, UK.
Pesaran, M.H., Shin, Y and Smith, R. J. (2001). Bound Testing Approaches to the
Analysis of Level Relationships. Journal of Applied Econometrics 16, 289-326.
Pesaran, H.M. and Pesaran, B. (1997). Working with Microfit 4.0: Interactive
Econometric Analysis, Oxford University Press, UK.
Sturm, J.E. and de Haan, J. (1995). Is Public Expenditure Really Productive? New
Evidence for the US and the Netherlands. Economic Modelling 12, 60-72.
Sachs, J.D. and Warner, A.M. (1997). Sources of Slow Growth in African
168
Stock, J.H. and Watson, M. (1993). A simple Estimator of Cointegrating Vectors in
Higher Order Integrated Systems. Econometrica 61, 783-820.
Sulaiman, D.M. and Muhammad, U. (2010). The Bound Testing Approach for Co-Integration and Causality between Financial Development and Economic Growth in
Case of Pakistan. European Journal of Social Sciences 13, 525-531.
Talvi, E. and Vegh, C.A. Tax Base Variability and Procyclical Fiscal Policy in
Developing Countries. Journal of Development Economics 78, 156-190.
Wagner, A. (1890) “Finanzwissenschaft” (2nd editions). Leipzig. (Partly reprinted in