Phosphorylation Regulates the Bound
Structure of an Intrinsically Disordered
Protein: The p53-TAZ2 Case
Raúl Esteban Ithuralde1,2, Adrián Gustavo Turjanski1,2*
1Departamento de Química Inorgánica, Analítica y Química Física y Departamento de Química Biológica-Facultad de Ciencias Exacas y Naturales-Universidad de Buenos Aires, ciudad de Buenos Aires, Argentina,
2INQUIMAE-Facultad de Ciencias Exactas y Naturales-Universidad de Buenos Aires/Consejo Nacional de Investigaciones Científicas y Técnicas-CONICET, ciudad de Buenos Aires, Argentina
Abstract
Disordered regions and Intrinsically Disordered Proteins (IDPs) are involved in critical cellu-lar processes and may acquire a stable three-dimensional structure only upon binding to their partners. IDPs may follow a folding-after-binding process, known as induced folding, or a folding-before-binding process, known as conformational selection. The transcription fac-tor p53 is involved in the regulation of cellular events that arise upon stress or DNA damage. The p53 domain structure is composed of an N-terminal transactivation domain (p53TAD), a DNA Binding Domain and a tetramerization domain. The activity of TAD is tightly regu-lated by interactions with cofactors, inhibitors and phosphorylation. To initiate transcription, p53TAD binds to the TAZ2 domain of CBP, a co-transcription factor, and undergoes a fold-ing and bindfold-ing process, as revealed by the recent NMR structure of the complex. The activ-ity of p53 is regulated by phosphorylation at multiple sites on the TAD domain and recent studies have shown that modifications at three residues affect the binding towards TAZ2. However, we still do not know how these phosphorylations affect the structure of the bound state and, therefore, how they regulate the p53 function. In this work, we have used compu-tational simulations to understand how phosphorylation affects the structure of the p53TAD: TAZ2 complex and regulates the recognition mechanism. Phosphorylation has been pro-posed to enhance binding by direct interaction with the folded protein or by changing the unbound conformation of IDPs, for example by pre-folding the protein favoring the recogni-tion mechanism. Here, we show an interesting turn in the p53 case: phosphorylarecogni-tion mainly affects the bound structure of p53TAD, highlighting the complexity of IDP protein-protein interactions. Our results are in agreement with previous experimental studies, allowing a clear picture of how p53 is regulated by phosphorylation and giving new insights into how post-translational modifications can regulate the function of IDPs.
OPEN ACCESS
Citation:Ithuralde RE, Turjanski AG (2016) Phosphorylation Regulates the Bound Structure of an Intrinsically Disordered Protein: The p53-TAZ2 Case. PLoS ONE 11(1): e0144284. doi:10.1371/journal. pone.0144284
Editor:Yaakov Koby Levy, Weizmann Institute of Science, ISRAEL
Received:July 31, 2015
Accepted:November 15, 2015
Published:January 7, 2016
Copyright:© 2016 Ithuralde, Turjanski. This is an open access article distributed under the terms of the Creative Commons Attribution License, which permits unrestricted use, distribution, and reproduction in any medium, provided the original author and source are credited.
Data Availability Statement:All relevant data are within the paper and its Supporting Information files.
Introduction
The classical paradigm states that the structure of a protein is related to its function. However, it has been shown that at least 30% of the human genome has no specific structure, including the whole gene or part of it, and that these regions generally bind to other proteins or DNA [1]. Disordered regions and Intrinsically Disordered Proteins (IDPs) are involved in critical cellular processes, such as the cell cycle. The deregulation of their function may lead to important health problems, such as Parkinson's disease, Alzheimer’s and cancer [1]. Disordered regions may acquire a stable three-dimensional structure upon binding to their partners, so the transi-tion states of these processes are key to understanding this group of biomolecules [2–6]. In this sense there is great interest in unraveling the function of IDPs in cells. Experimental and computational studies show that many transcription factors exhibit large disordered regions that fold upon binding to their targets. Disordered regions may allow the protein to exhibit a greater capture radius, enhancing protein-protein recognition [1,7–8].
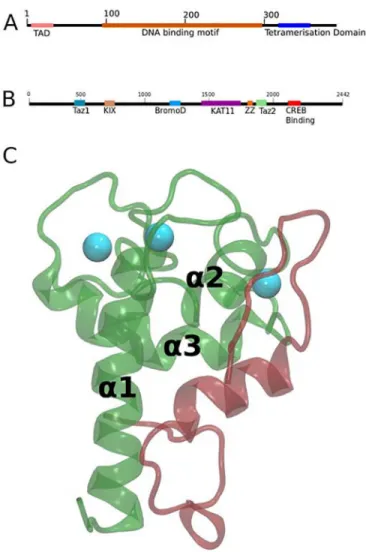
p53 is a transcription factor involved in the regulation of cellular events that arise upon stress or DNA damage, such as apoptosis or cell cycle arrest. Its activity is tightly regulated by its interaction with cofactors and inhibitors and by post-translational modifications, such as ubiquitination, phosphorylation or acetylation [6,9–11]. The p53 domain structure is com-posed of an N-terminal transactivation domain (p53TAD), a DNA Binding Domain and a tet-ramerization domain (Fig 1). The p53TAD domain is intrinsically disordered but folds upon binding to other proteins, as the cofactor CREB Binding Protein (CBP), or the inhibitors MDM2 and MDMX [6].
In unstressed cells, it has been proposed that p53 is bound to the E3 ubiquitin-ligase MDM2 that catalyzes its ubiquitination and therefore regulates p53 degradation by proteasomes regu-lating p53 cellular levels [9–11]. Upon DNA damage, a series of cellular signaling cascades are activated, leading to p53 phosphorylation at multiple sites on the TAD. The p53TAD complex with MDM2 is mainly disrupted when Thr18 is phosphorylated, on the other hand it has been proposed that when p53 is phosphorylated at Ser15, Thr18 or Ser20 the affinity with the TAZ2 domain of CBP is increased. CBP is then able to bind and acetylate free p53, making it more stable [12].
CBP is a critical regulator of the transcription of numerous target genes, such as tyrosine hydroxylase, interleukin-6 and type I collagen, by interacting with specific transcription factors [13]. The domain structure of CBP is composed of TAZ1, KIX, Bromo, KAT11, ZZ, TAZ2 and CREB Binding (Fig 1). Tetramers of p53 can bind to the DNA, and the p53TAD of each mono-mer can bind to four distinct domains of CBP: TAZ1, TAZ2, KIX and IBiD. The TAZ2 domain is composed of three zinc-coordination sites and four alpha helices, which are named (from N-terminal to C-terminal)α1,α2,α3 andα4 (Fig 1B) [14,15].
The structure of the p53TAD:TAZ2 complex has been solved by NMR and biophysical experiments have been conducted to characterize the effect of p53TAD phosphorylation on TAZ2 recognition. In the wild-type unphosphorylated p53TAD:TAZ2 NMR complex residues 19–25 of p53TAD form an alpha-helix (Fig 1) indicating that a folding and binding mechanism is involved in the recognition mechanism. As we only have the structure of unphosphorylated p53-TAZ2 it has been difficult to explain how phosphorylation of p53TAD affects the recogni-tion mechanism. NMR studies were done for two of the phosphor states but the structure of the complex could not be determined, in part due to overlap in the chemical shifts of the HSQC experiments [14]. Phosphorylation of p53TAD has been suggested to modulate the structure of the unbound p53 protein, specifically Thr18 phosphorylation has been postulated to decrease alpha-helix content in the unbound p53TAD, and phosphorylation of Ser20 has been postulated to increase it [9,16]. Moreover, it has been suggested that phosphorylation
affects its long-range dynamical properties [17] and, therefore, the interaction with the TAZ2 domain of CBP [16,18]. The binding constants of phosphorylated p53 at the three residues have been measured by means of ITC and fluorescence experiments and several mutants have been tested for their effects in a previous study [14]. In particular as phosphorylation intro-duces a negative residue, Arg1731A, Arg1732A and Arg1737A, have been tested to explain its role in the bound complex [14]. Remarkably, the binding of p53TAD to TAZ2 is enhanced at the three phosphorylation sites [14].
Despite the fact that the p53TAD:TAZ2 complex has been well characterized, we do not have a clear picture of how phosphorylation at the three key residues modulates the binding mechanism. Taking into account the significance of protein phosphorylation in IDPs and the physiological relevance of the p53 protein, we decided to study at atomic resolution and by means of computer simulations how phosphorylation at Ser15, Thr18 and Ser20 modulates the structure of p53 in the bound state and therefore modifies the binding mechanism to the TAZ2 domain of CBP. We used Molecular Dynamics(MD) to simulate the p53TAD:TAZ2 com-plexes: unphosphorylated and phosphorylated at p53TAD Ser15, Thr18 or Ser20. By using the FOLDX program to generate mutants and MD we have been able to reproduce previous
Fig 1. Structure of CBP and p53.(A) Domain structure of p53. (B) Domain structure of CREB Binding Protein (CBP). (C) The structure of the TAZ2 (green) domain of CBP with Zn2+ions (cyan balls) bound to the
p53TAD peptide (red). Ribbon representation is used for both domains.
experimental results and obtain a model of how phosphorylation regulates p53 binding to TAZ2. We show that, due to its intrinsic flexibility, phosphorylation in p53TAD produces changes in the bound structure of p53TAD to TAZ2, thereby modifying specific interactions that are relevant for affinity and specificity. We postulate that for IDPs, post-translational mod-ifications may be important not only for modifying the enthalpy of binding or inducing a con-formational change in the unbound protein, as has been previously shown, but also for modulating the structure of the bound complex and thereby allowing it to form new and spe-cific contacts that can only be understood if the bound phosphorylated structures are analyzed. Our study contributes to the understanding of how IDPs recognize their targets.
Materials and Methods
The initial structure files were obtained from the structure of the complex of p53TAD (1–39) and TAZ2 (1723–1812) registered in the Protein Data Bank (PDB ID: 2K8F) [14]. We selected the first structure of the 10 models that were deposited in the PDB for the simulations. The zinc atoms were taken from the X-ray structure of TAZ2 registered in the Protein Data Bank (PDB ID: 1F81) [15].
Phosphate groups were added to the p53TAD:TAZ2 complex and topology and coordinate files were created using the Leap program of the AmberTools package [19]. Three structures were modeled, phosphorylated at Ser15, Thr18 and Ser20 of p53TAD.
The AMBER99SBildn force field was used [20,21], the zinc ions were modeled using the dummy atom approach [22,23], and the Stitch parameters were used for the phosphoserine and phosphothreonine residues [24]. Then, the topology and restart files were converted to the GROMACS files using the amb2gmx.pl program [25], and the rest of the simulations were done using the GROMACS version 4.5.3 package [26–30].
Explicit water molecules and counter ions were added using the TIP3P [31] model for water. Periodic boundary conditions were used [32,33]. The systems were equilibrated in the NVT ensemble by running 25 ps long MD simulations using the Berendsen thermostat [34], and then, the temperature was slowly raised to 300 K while running another 25 ps long simula-tion. Finally, the system was equilibrated at 300 K using the Berendsen barostat [35] set to 1 bar and running 100 ps long MD simulations. During these processes, the CA atoms were restrained using a harmonic potential with a 84 kJ/(mol.Å2) constant for the thermalization
and a 42 kJ/(mol.Å2) constant for the density equilibration.
For each system, 230 ns long MD simulations were performed with no restraints and a 1.6 fs time step. Additionally, 100 ns long MD simulations were run for each system with different initial velocities that were selected using random numbers with the Boltzmann populations at 300 K. This second simulation was started from the 30 ns frame of the first one (when the dynamics seem to be equilibrated). We show in the supplementary information that the two set of simulations provide similar results. The temperature and pressure were kept constant by the v-rescale thermostat algorithm set at 300 K with a 0.1 ps coupling constant [36] and the Parri-nello-Rahman barostat [37] set at 1.0 bar with a 0.1 ps time coupling constant, respectively. The LINCS algorithm [38] was used for constraining the bonds that contained an H atom, and electro-static interactions were calculated by the Particle Mesh Ewald decomposition algorithm [32,33].
The Arg1737A mutant was modeled using a photo of the simulation of the p53TAD:TAZ2 complex phosphorylated at Ser15 where the Arg1737 of TAZ2 was not making contact with the phosphoserine residue. The FOLDX algorithm was used to generate the mutant.
The VMD program was used for visualization of the dynamics to create the images of the proteins and to calculate the g(r) plots [43]. Secondary structure analysis by residue was done using the DSSP program as implemented in GROMACS [44].
The AMBERTools package was used to calculate the RMSF and RMSD plots [45].
Results
The results are organized as follows: initially, the stability of the simulations is presented. Then, the structural and dynamical changes between the unphosphorylated state and the three phos-phorylated states are presented. In each case, detailed comparisons to previous NMR, muta-tional and biophysical experiments are presented.In silicomutational analysis was performed
to understand the contributions of the different amino acids to the folding and binding process. Overall, our simulations are in agreement with previous experiments and allow a deeper under-standing of how phosphorylation regulates the interaction of TAZ2 with p53TAD.
Stability of the MD simulations
We initially analyzed the stability of the simulations of the four systems studied, the
p53TADWT:TAZ2 complex and the same complex but with one phosphorylation at residues
Ser15, Thr18 and Ser20 (p53 15pSer, 18pThr and 20pSer phosphorylated states respectively). In the case of the p53TAD peptide, as its tails are too flexible and have no definite secondary structure [14], we only calculated the Backbone RMSD for the p53TAD alpha helix.Fig 2 shows the Backbone RMSD vs time plot for the four systems, either for the whole TAZ2 domain or for the 14–27 segment of the p53TAD peptide. Similar results were obtained in another set of simulations as reported in the supplementary material (S2–S9Figs).
The TAZ2 domain remains in a conformation similar to the NMR structure during the sim-ulations, and despite its intrinsic flexibility, the overall fold remains stable. After the initial relaxation, encompassing the equilibration, and initial 30ns of MD, the four systems (WT, 15pSer, 18pThr and 20pSer) display moderate values for the RMSD of the 14–27 segment of the p53TAD peptide, using the average structure as a reference (Fig 2). Again, the two tails of the p53TAD peptides, WT and phosphorylated ones, are highly flexible and explore many dif-ferent conformations within the simulations.
We also present a correlation of previously reported NMR chemical shifts for the CA for the complex and the ones calculated along the dynamics of the WT state with the SHIFTX pro-gram (S14 Fig). As can be seen there is a good agreement between simulations and experimen-tal results for the native complex. We do not have the data of the NMR data of the
phosphorylated complex, so we could not add a correlation figure in these cases.
We also analyzed the RMSF of the TAZ2 and p53 proteins (Fig 2C). In all of the simulations, there are no large differences in the TAZ2 domain in the four states. We did not observe large changes in the RMSF of p53TAD in the different states (Fig 2D) despite the fact that the 15pSer system reduces the fluctuation in both the N and C-terminal tails, which is likely due to a rotation of the central helices that accommodates the tail residues over the structure of the TAZ2 domain.
Structural comparison of the p53TAD:TAZ2 complex in the different
phosphorylation states
not be considered in the analysis. We separated the analysis in key residues previously reported to be relevant for the interaction of the two proteins. Key interactions are depicted inFig 3.
Arginine residues in theα1 helix. Key interactions involve Arg and Lys residues of TAZ2
and phosphorylated and acidic residues of p53. In the WT protein Arg1731 interacts with Glu11, but we do not see any interaction with Glu17, which lies nearby (Fig 3B). Arg1731 inter-action with Glu11 is observed in the 15pSer state but interinter-action Glu17 is observed but seems to be more transient (Fig 3C). In the 18pS state, the Arg1731 residue forms a salt bridge with the phosphate group and we also observed a salt bridge with Glu17 (Fig 3E). In the 20pSer state, Arg1731 interacts with p53TAD Asp21 (Fig 3H).
Arg1732 interacts in all states with the acidic residues of TAZ2, thus helping to maintain the secondary structure of theα1 helix (Fig 3).
Arg1737 is the most promiscuous of the three arginine residues. It interacts with Phe19 in the WT state (Fig 3B) but interacts with the phosphate group in the 15pSer and 18pThr (Fig 3C–3E) states and forms transient salt bridges with acidic N-terminal residues of p53TAD in
the 20pSer state (Not shown). Interestingly, in our simulations the TAZ2α1 helix bends Fig 2. Backbone RMSD vs time and RMSF plots.(A) Plot of the Backbone RMSD of TAZ2 along the simulation. The MD was fitted against the average structure and only 30 ns-130 ns of the dynamics was used. (B) Backbone RMSD of p53TAD fitted against the average structure of the 30 ns-130 ns MD. (C) Backbone RMSF vs residue plot of TAZ2. The structure was fitted against the average structure of 30ns-130ns MD siulation. (D) Backbone RMSF vs residue plot of p53TAD. Again the structure was fitted against the average structure. In all cases p53 WT is black, p53 15pSer is green, p53 18pThr is red and p53 20pSer is blue.
around Arg1737 in the 18pThr state, which may explain the changes in chemical shifts of the amide resonances of Leu1733, Ile1735, Ala1738, Ile1739, Gln1740, Ser1741 and Leu1742 seen previously in the two dimensional 1H, 15N NMR HSQC spectra [14].
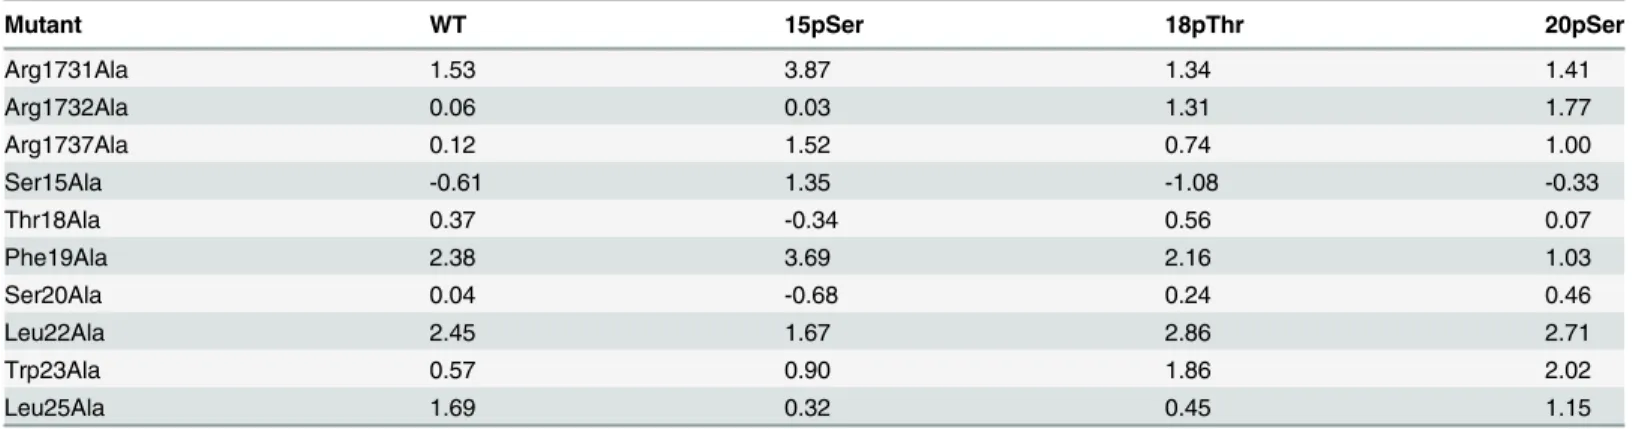
The interactions described for Arg1731, Arg1732 and Arg1737 may explain the relevance of these three positive residues in the binding process, as demonstrated by previous ITC experi-ments with TAZ2 mutants Arg1731Ala, Arg1732Ala and Arg1737Ala in the WT, 15pSer and 18pThr states, which show high and positiveΔΔG of binding [14] upon mutation. We will
dis-cuss the Arg1737Ala mutant in the 15pSer state in detail in the next section.
p53 Leu22 and Leu25. In the WT state, Leu22 of p53 is inside a hydrophobic pocket formed by helixα1,α2 andα3 (Fig 4A) [14]. Leu25 interacts mainly with helixα3 of TAZ2.
Leu22 and Leu25 also interact with each other (Fig 4A). Similar interactions are observed in all of the other states (Fig 4C, 4E and 4G). The mutational studies carried out with FoldX present positiveΔΔG of binding between TAZ2 and p53TAD for all states and results are presented in
Table 1. The important intermolecular contacts observed during the simulations for Leu25 and Leu22 are in agreement with experimental data reported by Bai [14], which state that there is no binding between WT TAZ2 and p53TAD mutants Leu22Ala and Leu25Ala.
p53 Phe19. In the WT state, Phe19 is surrounded by the side chains of Arg1737 and Met1761 (Fig 4B). The aromatic residue also takes part in a cation pi interaction with Lys1760 [14]. Due to the rotation of the p53TAD helix, in the p53 15pSer state, the Phe19 side chain gets into a hydrophobic pocket formed by helixα1 andα2 and interacts with Leu1788 and
Met1761 (Fig 4D). In the 18pThr state, Phe19 interacts with the hydrophobic regions of theα1
andα2 helix, as in the WT case, but due to the overall rotation of the peptide, it is now in a
region more exposed to solvent (Fig 4F). In the 20pSer state, Phe19 is more exposed to the sol-vent (Fig 4H). In all states, we observe large and positiveΔΔG of binding between TAZ2 and
Phe19Ala p53TAD with FoldX, as presented inTable 1. This is in agreement with experimental mutational studies for the WT state [14] that show decrease binding in the Phe19A mutants. The other aromatic residue of p53 Trp23 is less buried and maintains similar interactions in the different states as can be seen inFig 4.
Phosphorylated residues. In the p53 15pSer state, TAZ2 residue Arg1737 is the main con-tact with the phosphate (Fig 3C).
We observed that the p53TAD pThr18 phosphate group interacts with Arg1731, Arg1737, and the amide backbone of Glu17. Interestingly, pThr18 also has a hydrogen bond with its own amide group (Fig 3E). We also note that the phosphate group is almost not exposed to the sol-vent, which again produces a rotation in the central helix that changes the secondary structure conformation of the p53TAD residues (S1 Fig).
The p53TAD pSer20 residue exhibits a phosphate group that interacts with its own Lys24 and is clearly more exposed to solvent (Fig 3G), as can be seen in the gofr plot (S1 Fig).
In all three cases, mutational studies using FoldX give large and positiveΔΔG of binding
between TAZ2 and p53TAD, which is shown inTable 1. This results are in agreement with increase binding affinity of the phosphor proteins as compared to the WT [14]
The Arg1737Ala mutant of TAZ2 in complex with 15pSer. A recent study with ITC experiments shows that there is no significant change in the Kd for the Arg1737Ala mutant in the 15pSer phosphorylation state, suggesting that it is not relevant for the complex [14].
Fig 3. Changes in structure upon phosphorylation.(A) and (B) Structure of the Wild Type showing polar and charged inter protein interactions respectively. (C) and (D) depict the interactions of the15pSer and charged interactions respectively. (E) and (F) depict the interactions of the 18pThr and charged interactions respectively. (G and H) depict the interactions of the 20pSer and charged interactions respectively.
However, we found that Arg1737 is the key residue interacting with the phosphate. We hypothesized that due to the overall high flexibility of the complex, once Arg1737 is mutated, other residues that had previously been exposed to solvent could replace the role of this posi-tively charged residue in the interaction with the phosphoserine. To test this hypothesis, we performed molecular dynamics of the Arg1737Ala mutant based on our previous model. Inter-estingly, Lys1760 of TAZ2, which was previously exposed to solvent (ΔΔG of K1760A
calcu-lated by FoldX for the 15pSer molecular dynamics gives 0.92 kJ/mol, a relative low value), rotates and interacts with the phosphoserine, which could explain the observed experimental result and highlights the versatility of the protein complexes formed by intrinsically disordered proteins (Fig 5).
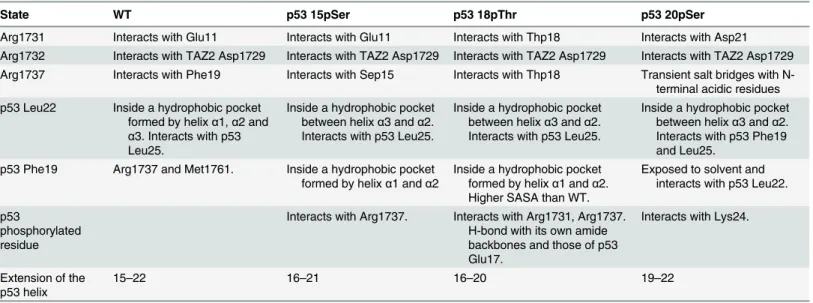
Table 2summarizes the findings described in this section. We will now focus on the changes in the overall structure of p53 in the different states upon binding to CBP.
Secondary structure of the p53TAD 14
–
27 segment
Usually, the effect of phosphorylation of Intrinsically Disorder Proteins is analyzed in the unbound state. Previous work on an unbound p53TAD WT peptide in two different phosphor-ylation states suggests that phosphorphosphor-ylation at Thr18 destabilizes the helix, while phosphoryla-tion at Ser20 stabilizes it [16]. These results can only be analyzed if we actually know the structure of the complex when p53 is phosphorylated. In a previous work, it is assumed to be very similar to the WT complex. The question now is whether the same results could be obtained in the complex with TAZ2, which would give insight into whether a pre-folded state is necessary for complex formation in the phosphorylated states.
In the unphosphorylated complex a helix is observed, both in the NMR structure and during the MD simulations, around residues 18–26 and is stabilized by the interactions between Lys24 and Asp17 and 21. However, in all three phosphorylated states of the complex the helix rotates and becomes shorter with respect to the WT state. Moreover, the change in the secondary structure upon binding is less pronounced than in the WT state (Fig 6). A helix structure is
Fig 4. Changes in structure upon phosphorylation, showing interactions around the hydrophobic residues of p53TAD.(A) and (B) structures of the Wild Type protein showing aliphatic and aromatic residues of p53 interacting with TAZ2 respectively. (C) and (D) depict p53 15pSer-TAZ2 complex protein showing aliphatic and aromatic residues of p53 interacting with TAZ2 respectively. (E) and (F) depict p53 18pThr-TAZ2 protein complex showing aliphatic and aromatic residues of p53 interacting with 18pThr-TAZ2 respectively. (G) and (H) depict p53 20pSer-TAZ2 protein complex showing aliphatic and aromatic residues of p53 interacting with TAZ2 respectively.
doi:10.1371/journal.pone.0144284.g004
Table 1. ΔΔG of binding of TAZ2 and p53TAD for several mutations (kJ/mol).
Mutant WT 15pSer 18pThr 20pSer
Arg1731Ala 1.53 3.87 1.34 1.41
Arg1732Ala 0.06 0.03 1.31 1.77
Arg1737Ala 0.12 1.52 0.74 1.00
Ser15Ala -0.61 1.35 -1.08 -0.33
Thr18Ala 0.37 -0.34 0.56 0.07
Phe19Ala 2.38 3.69 2.16 1.03
Ser20Ala 0.04 -0.68 0.24 0.46
Leu22Ala 2.45 1.67 2.86 2.71
Trp23Ala 0.57 0.90 1.86 2.02
Leu25Ala 1.69 0.32 0.45 1.15
formed between residues Asp21 and Leu25 in the 15pSer and 18pThr states (Fig 6). Interest-ingly, the interaction of Lys24 with other residues of the peptide is disrupted by the phosphate groups, which may partially destabilize the helix structure. In the 20pSer state, the helix is formed between residues 19–23. In the bound state, the central helix in the 18pThr and 20pSer states changes its position toward the N-terminal, around the phosphate group, and in the 15pSer has a kink at residues 20–21 that highly decreases the helical structure of p53. Similar results were obtained with another set of simulations as reported in supplementary material (S10,S11,S12andS13Figs).
The results presented in this section suggest that a pre-folded structure will not clearly favor the binding process, as the phosphorylated p53TAD peptides bound to TAZ2 show less ten-dency to form folded helix structures. Moreover, the reported tenten-dency of the unbound phos-phorylated peptides is not correlated with the helix formation in their bound state. PDB Files of all the structures are provided as supporting information (S1–S4 Files).
Fig 5. Dynamics and interactions in the Arg1737Ala mutant of p53 15pSer state.(A) Structure of Arg1737Ala mutant of p53 15pSer state, showing interactions between some residues around the phosphate group. (B) Distance of phosphorus atom of Sep15 and Nζof Lys1740 versus time in the Arg1737Ala mutant of p53 15pSer state molecular dynamics.
doi:10.1371/journal.pone.0144284.g005
Table 2. Structural comparison between different phosphorylation states.
State WT p53 15pSer p53 18pThr p53 20pSer
Arg1731 Interacts with Glu11 Interacts with Glu11 Interacts with Thp18 Interacts with Asp21 Arg1732 Interacts with TAZ2 Asp1729 Interacts with TAZ2 Asp1729 Interacts with TAZ2 Asp1729 Interacts with TAZ2 Asp1729 Arg1737 Interacts with Phe19 Interacts with Sep15 Interacts with Thp18 Transient salt bridges with
N-terminal acidic residues p53 Leu22 Inside a hydrophobic pocket
formed by helixα1,α2 and α3. Interacts with p53 Leu25.
Inside a hydrophobic pocket between helixα3 andα2. Interacts with p53 Leu25.
Inside a hydrophobic pocket between helixα3 andα2. Interacts with p53 Leu25.
Inside a hydrophobic pocket between helixα3 andα2. Interacts with p53 Phe19 and Leu25.
p53 Phe19 Arg1737 and Met1761. Inside a hydrophobic pocket formed by helixα1 andα2
Inside a hydrophobic pocket formed by helixα1 andα2. Higher SASA than WT.
Exposed to solvent and interacts with p53 Leu22.
p53
phosphorylated residue
Interacts with Arg1737. Interacts with Arg1731, Arg1737. H-bond with its own amide backbones and those of p53 Glu17.
Interacts with Lys24.
Extension of the p53 helix
15–22 16–21 16–20 19–22
Discussion and Conclusions
IDPs behave very differently than globular proteins, leading to a complex regulation of the mechanism of protein-protein recognition by changes in protein conformation.
Mutational studies have proven very useful in structural studies of globular proteins or pro-tein domains; they are able to suggest important residues for the interaction between macro-molecules and for stabilizing a secondary or tertiary structure needed for the interaction. However, as shown with the Arg1737 residue in the 15pSer state, in these highly flexible IDPs, low values ofΔΔG of binding does not always mean that the particular residue does not form
part of the intermolecular interaction, as the mutated protein could replace the WT interaction by other ones, even when this imply changing the structure of a major part of the complex, as we have shown.
Two main mechanisms have been proposed for protein-protein interactions in IDPs: induced folding and conformational selection. The former mechanism implies that the IDP will bind disorderly and fold over the globular protein; in this sense, changes in the unbound state that stabilize a 'bound' conformation do not increase the binding rate. In the latter mecha-nism, changes that stabilize a bound-like conformation of the unbound IDP change the bind-ing rate [46–48].
Possible changes in the unbound could be specific mutants designed to understand the binding mechanism or post-translational modifications, such as phosphorylation. It has been shown that many transcription factors are IDPs or have long intrinsically disordered regions and that phosphorylation is a common mechanism for regulating their function [1,6,7,49,50]. The role of phosphorylation could be to increase the equilibrium binding constant by specific
interactions with co-transcription factors or by stabilizing the structure of the unbound protein and therefore changing the binding affinity by increasing the binding rate [14,51–54]. The lat-ter requires a conformational selection mechanism.
In the case of the p53TAD, different mechanisms have been proposed [14,16,18], and the role of phosphorylation has been studied both in its contribution to direct interactions with CBP and in producing changes of the structure of the unbound complex. By performing molecular dynamics simulations andin silicomutations, we have shown that phosphorylation probably
reg-ulates p53TAD by changing the structure of the bound complex and not only the unbound p53TAD. This changes can increase the binding constant by stabilizing contacts with p53TAD residues other than the phosphorylated one. According to our results, the cell may then be taking advantage of both phosphorylation and the plasticity of a disordered protein to modify the inter-action of the protein complex by changing the bound structure. We believe this new path could be preferred in IDPs that do not undergo an important change in structure upon binding, and therefore, changes that affect the structure can clearly modulate the folding and binding process.
Our results not only help to understand p53 function but also contribute to the general knowledge of how IDPs recognize their targets.
Supporting Information
S1 Fig. gofr plot of the waters around the phosphate group.p53 15pSer state (green), p53 18pThr state (red) and p53 20pSer state (blue).
(TIFF)
S2 Fig. Comparison of Backbone RMSD for first and second simulations.Backbone RMSD vs time plot for the first simulation (black), only 30 ns-130 ns dynamics were used, and the sec-ond simulation (red), all fitted against the TAZ2 backbone 30 ns photo for WT TAZ2.
(TIFF)
S3 Fig. Comparison of Backbone RMSD for first and second simulations.Backbone RMSD vs time plot for the first simulation (black), only 30 ns-130 ns dynamics were used, and the sec-ond simulation (red), all fitted against the TAZ2 backbone 30 ns photo for WT TAD.
(TIFF)
S4 Fig. Comparison of Backbone RMSD for first and second simulations.Backbone RMSD vs time plot for the first simulation (black), only 30 ns-130 ns dynamics were used, and the sec-ond simulation (red), all fitted against the TAZ2 backbone 30 ns photo for 15pSer-T TAZ2. (EPS)
S5 Fig. Comparison of Backbone RMSD for first and second simulations.Backbone RMSD vs time plot for the first simulation (black), only 30 ns-130 ns dynamics were used, and the sec-ond simulation (red), all fitted against the TAZ2 backbone 30 ns photo for 15pSer-T TAD. (TIFF)
S6 Fig. Comparison of Backbone RMSD for first and second simulations.Backbone RMSD vs time plot for the first simulation (black), only 30 ns-130 ns dynamics were used, and the sec-ond simulation (red), all fitted against the TAZ2 backbone 30 ns photo for 18pThr-T TAZ2. (TIFF)
S8 Fig. Comparison of Backbone RMSD for first and second simulations.Backbone RMSD vs time plot for the first simulation (black), only 30 ns-130 ns dynamics were used, and the sec-ond simulation (red), all fitted against the TAZ2 backbone 30 ns photo for 20pSer-T TAZ2. (TIFF)
S9 Fig. Comparison of Backbone RMSD for first and second simulations.Backbone RMSD vs time plot for the first simulation (black), only 30 ns-130 ns dynamics were used, and the sec-ond simulation (red), all fitted against the TAZ2 backbone 30 ns photo for 20pSer-T TAD. (TIFF)
S10 Fig. Comparison of TAD helix structure for first and second simulations.Percentage time spent in helix structure vs TAD Residue Number plot for the first simulation (black), only 30 ns-130 ns dynamics were used, and the second simulation (red) for the WT state.
(TIFF)
S11 Fig. Comparison of TAD helix structure for first and second simulations.Percentage time spent in helix structure vs TAD Residue Number plot for the first simulation (black), only 30 ns-130 ns dynamics were used, and the second simulation (red) for the 15pSer-T state. (TIFF)
S12 Fig. Comparison of TAD helix structure for first and second simulations.Percentage time spent in helix structure vs TAD Residue Number plot for the first simulation (black), only 30 ns-130 ns dynamics were used, and the second simulation (red) for the 18pThr-T state. (TIFF)
S13 Fig. Comparison of TAD helix structure for first and second simulations.Percentage time spent in helix structure vs TAD Residue Number plot for the first simulation (black), only 30 ns-130 ns dynamics were used, and the second simulation (red) for the 20pSer-T.
(TIFF)
S14 Fig. Agreement between simulated NMR CA chemical shifts and experimental CA chemical shifts for the WT complex.
(TIFF)
S1 File. Structure file of the WT state obtained from MD simulations.
(PDB)
S2 File. Structure file of the 15pSer state obtained from MD simulations.
(PDB)
S3 File. Structure file of the 18pThr state obtained from MD simulations.
(PDB)
S4 File. Structure file of the 20pSer state obtained from MD simulations.
(PDB)
Acknowledgments
Assistant at the Department of Inorganic, Analytical Chemistry and Physical Chemistry, a PhD student at the Department of Biological Chemistry, School of Natural Sciences, University of Buenos Aires and a CONICET PhD fellow at INQUIMAE. We acknowledge Justin S. Smith for thoroughly revising and correcting the manuscript.
Author Contributions
Conceived and designed the experiments: REI AGT. Performed the experiments: REI. Ana-lyzed the data: REI AGT. Contributed reagents/materials/analysis tools: REI AGT. Wrote the paper: REI AGT.
References
1. Tantos A.; Han K.H. & Tompa P. Intrinsic disorder in cell signaling and gene transcription. Molecular and Cellular Endocrinology; 348: 457–65. doi:10.1016/j.mce.2011.07.015PMID:21782886
2. Turjanski A.G.; Gutkind J.S.; Best R.B. & Hummer G. Binding-induced folding of a natively unstructured transcription factor. PLoS Computational Biology. 2008; 4: e1000060. doi:10.1371/journal.pcbi. 1000060PMID:18404207
3. Ganguly D. & Chen J. Topology-based modeling of intrinsically disordered proteins: balancing intrinsic folding and intermolecular interactions. Proteins. 2011; 79: 1251–66. doi:10.1002/prot.22960PMID: 21268115
4. Huang Y. & Liu Z. Kinetic advantage of intrinsically disordered proteins in coupled folding-binding pro-cess: a critical assessment of the“fly-casting”mechanism. Journal of Molecular Biology. 2009; 393: 1143–59. doi:10.1016/j.jmb.2009.09.010PMID:19747922
5. Sugase K.; Dyson H.J. & Wright P.E. Mechanism of coupled folding and binding of an intrinsically disor-dered protein. Nature. 2007; 447: 1021–5. PMID:17522630
6. Wells M.; Tidow H.; Rutherford T.J.; Markwick P.; Jensen M.R.; Mylonas E. et al. Structure of tumor suppressor p53 and its intrinsically disordered N-terminal transactivation domain. Proceedings of the National Academy of Sciences of the United States of America. 2008; 105: 5762–7. doi:10.1073/pnas. 0801353105PMID:18391200
7. Wright P.E. & Dyson H. Intrinsically unstructured proteins: Re-assessing the protein structure-function paradigm. Journal of Molecular Biology. 1999; 293: 321–31. PMID:10550212
8. Dey A.; Verma C.S. & Lane D.P. Updates on p53: modulation of p53 degradation as a therapeutic approach. British Journal of Cancer. 2008; 98: 4–8. doi:10.1038/sj.bjc.6604098PMID:18182973
9. Kovacs D.; Szabo B.; Pancsa R. & Tompa P. Intrinsically disordered proteins undergo and assist fold-ing transitions in the proteome. Archives of Biochemistry and Biophysics. 2013; 539: 80–9.
10. Zhang H.G.; Wang J.; Yang X.; Hsu H.C. & Mountz J.D. Regulation of apoptosis proteins in cancer cells by ubiquitin. Oncogene. 2004; 23: 2009–15. PMID:15021888
11. Bieging K.T. & Attardi L.D. Deconstructing p53 transcriptional networks in tumor suppression. Trends in Cell Biology. 2012; 22, 97–106. doi:10.1016/j.tcb.2011.10.006PMID:22154076
12. Suganuma T. & Ikeda M.A. Tumor Growth Suppression by the Coactivator p300. Journal of Oral Biosci-ences. 2008; 50(2): 115–124.
13. Cook P.R.; Polakowski N. & Lemasson I. HTLV-1 HBZ protein deregulates interactions between cellu-lar factors and the KIX domain of p300/CBP. Journal of Molecucellu-lar Biology. 2011; 409: 384–98. doi:10. 1016/j.jmb.2011.04.003PMID:21497608
14. Feng H.; Jenkins L.M.; Durell S.R.; Hayashi R.; Mazur S.J.; Cherry S. et al. Structural basis for p300 TAZ2-p53 TAD1 binding and modulation by phosphorylation. Structure. 2009; 17: 202–10. doi:10. 1016/j.str.2008.12.009PMID:19217391
15. De Guzman R.N.; Liu H.Y.; Martinez-Yamout M.; Dyson H.J. & Wright P.E. Solution structure of the TAZ2 (CH3) domain of the transcriptional adaptor protein CBP. Journal of Molecular Biology. 2000; 303: 243–53. PMID:11023789
16. Mavinahalli J.N.; Madhumalar A.; Beuerman R.W.; Lane D.P. & Verma C. Differences in the transacti-vation domains of p53 family members: a computational study. BMC Genomics. 2010; 11 Suppl 1: S5. doi:10.1186/1471-2164-11-S1-S5PMID:20158876
18. Lee C.W.; Ferreon J.C.; Ferreon A.C.M.; Arai M. & Wright P.E. Graded enhancement of p53 binding to CREB-binding protein (CBP) by multisite phosphorylation. Proceedings of the National Academy of Sciences of the United States of America. 2010; 107: 19290–5. doi:10.1073/pnas.1013078107PMID: 20962272
19. Schafmeister C.E.A.F.; Ross W.S. & Romanovski V. LEAP. University of California, San Francisco; 1995.
20. Hornak V.; Abel R.; Okur A.; Strockbine B.; Roitberg A. & Simmerling C. Comparison of multiple Amber force fields and development of improved. Proteins. 2006; 65: 712–25. PMID:16981200
21. Lindorff-Larsen K.; Piana S.; Palmo K.; Maragakis P.; Klepeis J.; Dror R.O. et al. Improved side-chain torsion potentials for the Amber ff99SB protein force field. Proteins. 2010; 78: 1950–8. doi:10.1002/ prot.22711PMID:20408171
22. Pang Y.P. Novel zinc protein molecular dynamics simulations: Steps toward antiangiogenesis for can-cer treatment. Journal of Molecular Modeling. 1999; 5: 196–202.
23. Pang Y.P.; Xu K.; El Yazal J. & Prendergast F.G. Successful molecular dynamics simulation of the zinc-bound farnesyltransferase using the cationic dummy atom approach. Protein Science. 2000; 9: 1857–65. PMID:11106157
24. Homeyer N.; Horn A.H.C.; Lanig H. & Sticht H. AMBER force field parameters for phosphorylated amino acids in different protonation states: phosphoserine, phosphothreonine, phosphotyrosine and phosphohistidine. Journal of Molecular Modeling. 2006; 12: 281–9. PMID:16240095
25. Mobley D.L.; Chodera J.D. & Dill K.A. On the use of orientational restraints and symmetry number cor-rections in alchemical free energy calculations. Journal of Chemical Physics. 2006; 125: 084902. PMID:16965052
26. Bekker, H.; Berendsen, H.J.C.; Dijkstra, E.J.; Achterop, S.; van Drunen, R.; van der Spoel, D. et al. Gro-macs: A parallel computer for molecular dynamics simulations. Proceedings of the 4th International Conference Physics Computing. 1993; 92: 252–6.
27. Berendsen H.J.C.; van der Spoel D. & van Drunen R. GROMACS: A message-passing parallel molecu-lar dynamics implementation. Computer Physics Communications. 1995; 91: 43–56.
28. Lindahl E.; Hess B. & van der Spoel D. GROMACS 3.0: A package for molecular simulation and trajec-tory analysis. Journal of Molecular Modeling. 2011; 7: 306–17.
29. van der Spoel D.; Lindahl E., Hess B.; Groenhof G.; Mark A.E. & Berendsen H.J.C. GROMACS: Fast, Flexible and Free. Journal of Computational Chemistry. 2005; 26: 1701–18. PMID:16211538
30. Hess B.; Kutzner C.; van der Spoel D. & Lindahl E. GROMACS 4: Algorithms for Highly Efficient, Load-Balanced, and Scalable Molecular Simulation. Journal of Chemical Theory and Computation. 2008; 4: 435–47. doi:10.1021/ct700301qPMID:26620784
31. Jorgensen W.L.; Chandrasekhar J.; Madura J. & Klein M.L. Comparison of simple potential functions for simulating liquid water. Journal of Chemical Physics. 1983; 79, 926–35.
32. Darden T.; York D. & Pedersen L. Particle Mesh Ewald: An N•log(N) method for Ewald sums in large systems. Journal of Chemical Physics. 1993; 98: 10089–92.
33. Essmann U.; Perera L.; Berkowitz M.L.; Darden T.; Lee H. & Pedersen L.G. A smooth particle mesh ewald potential. Journal of Chemical Physics. 1995; 103: 8577–92.
34. Berendsen H. J. C. Transport properties computed by linear response through weak coupling to a bath. In: Meyer M., Pontikis V. eds. Computer Simulations in Material Science. Kluwer; 1991, pp. 139–155.
35. Berendsen H.J.C.; Postma J.P.M.; DiNola A. & Haak J.R. Molecular dynamics with coupling to an exter-nal bath. Jourexter-nal of Chemical Physics. 1984; 81: 3684–90.
36. Bussi G.; Donadio D. & Parrinello M. Canonical sampling through velocity rescaling. Journal of Chemi-cal Physics. 2007; 126: 014101. PMID:17212484
37. Parrinello M. & Rahman A. Polymorphic transitions in single crystals: A new molecular dynamics method. Journal of Applied Physics. 1981; 52: 7182–90.
38. Hess B.; Bekker H.; Berendsen H.J.C. & Fraaije J.G.E.M. LINCS: A linear constraint solver for molecu-lar simulations. Journal of Computational Chemistry. 1997; 18: 1463–72.
39. Stricher, F.; Lenaerts, T.; Schymkowitz, J.; Rousseau, F. & Serrano, L. FoldX 3.0.“In preparation”; 2008.
40. Schymkowitz J.; Borg J.; Stricher F.; Nys R.; Rousseau F. & Serrano L. The FoldX web server: an online force field. Nucleic Acids Research. 2005; 33: 382–8.
42. Guerois R.; Nielsen J.E. & Serrano L. Predicting changes in the stability of proteins and protein com-plexes: a study of more than 1000 mutations. Journal of Molecular Biology. 2002; 320: 369–87. PMID: 12079393
43. Humphrey W.; Dalke A. & Schulten K. VMD—Visual Molecular Dynamics. Journal of Molecular Graph-ics. 1996; 14: 33–8. Available:http://www.ks.uiuc.edu/Research/vmd/PMID:8744570
44. Kabsch W. & Sander C. Dictionary of protein secondary structure: Pattern recognition of hydrogen-bonded and geometrical features. Biopolymers. 1983; 22: 2577–2637. PMID:6667333
45. Roe D.R. & Cheatham T.E. III. PTRAJ and CPPTRAJ: Software forProcessing and Analysis of Molecu-lar Dynamics Trajectory Data. Journal of ChemicalTheory and Computation. 2013; 9(7): 3084–95.
46. Dogan J.; Gianni S. & Jemth P. The binding mechanisms of intrinsically disordered proteins. Physical Chemistry Chemical Physics. 2014; 16(14): 6323–31. doi:10.1039/c3cp54226bPMID:24317797
47. Hatzakis N.S. Single molecule insights on conformational selection and induced fit mechanism. Bio-physical Chemistry. 2014; 186: 46–54. doi:10.1016/j.bpc.2013.11.003PMID:24342874
48. Cortese M.S.; Uversky V.N. & Dunker A.K. Intrinsic disorder in scaffold proteins: Getting more from less. Progress in Biophysics and Molecular Biology. 2008; 98(1): 85–106. doi:10.1016/j.pbiomolbio. 2008.05.007PMID:18619997
49. Uversky V.N. & Dunker A.K. Understanding protein non-folding. Biochimica et Biophysica Acta (BBA) —Proteins and Proteomics. 2010; 1804(6): 1231–64.
50. Sigler P.B. Transcriptional activation. Acid blots and negative noodles. Nature. 1988; 333: 210–2. PMID:3367995
51. Iakoucheva L.M.; Radivojac P.; Brown C.J.; O'Connor T.R.; Sikes J.G.; Obradovic Z. et al. The impor-tance of intrinsic disorder for protein phosphorylation. Nucleic Acids Research. 2004; 32(3): 1037–49. PMID:14960716
52. Ferreon J.C.; Lee C.W.; Arai M.; Martinez-Yamout M.A.; Dyson H.J. & Wright P.E. Cooperative regula-tion of p53 by modularegula-tion of ternary complex formaregula-tion with CBP/p300 and HDM2. Proceedings of the National Academy of Sciences of the United States of America. 2009; 106(16): 6591–6. doi:10.1073/ pnas.0811023106PMID:19357310
53. Dastidar S.G.; Lane D.P. & Verma C.S. Multiple Peptide Conformations Give Rise to Similar Binding Affinities: Molecular Simulations of p53-MDM2. Journal of the American Chemical Society. 2008; 130 (48): 13514–5.