1Universidad Autónoma del Estado de Hidalgo, Instituto de Ciencias de la Salud, Centro Interdisciplinario de Investigación en Ciencias de la Salud. Carretera Actopan-Tilcuautla, s/n., 42162, San Agustín Talxiaca, Hidalgo, México. Correspondência para/Correspondence to: G LÓPEZ-RODRÍGUEZ. E-mail: <[email protected]>.
Effects of dietary high fructose
corn syrup on regulation of
energy intake and leptin
gene expression in rats
Efeitos da ingestão de xarope de milho
com alto teor de frutose na regulação
da ingestão energética e na expressão
gênica de leptina em ratos
Guadalupe LÓPEZ-RODRÍGUEZ1
Silke Kotasek OSUNA1
Marcos GALVÁN GARCÍA1
Teodoro SUÁREZ DIEGUEZ1
A B S T R A C T
Objective
To evaluate in Wistar rats the effect of chronic use of high fructose corn syrup on serum lipids, body weight, energy intake regulation, and expression of associated genes.
Methods
For 11 weeks, male rats were fed a standard diet with either water (control) or 15% high fructose corn syrup solution, or fed a high-fat diet. The rats’ food intake and body weight were measured weekly. Expression of
leptin and fatty acid synthase genes was quantified in their brain and adipose tissue upon sacrifice at age 119 days using real-time polymerase chain reaction.
Results
Conclusion
Fifteen percent high fructose corn syrup intake and the high-fat diet reduced leptin gene expression in the brain of Wistar rats, with differential effects on weight gain.
Keywords: Body weight. Diet, high-fat. Fatty acid synthase gene. Fructose. Leptin.
R E S U M O
Objetivo
Avaliar em ratos Wistar o efeito do consumo crônico de xarope de milho com alta concentração de frutose sobre os lipídeos séricos, peso corporal, regulação da ingestão energética e expressão de genes associados.
Métodos
Durante 11 semanas, ratos machos foram alimentados com uma dieta padrão com água (controle) ou 15% de xarope de milho com alta concentração de frutose, ou com uma dieta hiperlipídica. A ingestão alimentar e o peso corporal dos ratos foram medidos semanalmente. Os animais foram sacrificados com 119 dias de vida, e as expressões gênicas de leptina e da sintetase de ácidos graxos foram quantificadas no cérebro e no tecido adiposo usando a reação em cadeia da polimerase em tempo real.
Resultados
O consumo de 15% de xarope de milho com alto teor de frutose não afetou o peso dos animais, somente os ratos da dieta hiperlipídica aumentaram de peso significativamente. Nas dietas hiperlipídica e com alto teor de frutose, foram evidentes expressões mais baixas de leptina e mais altas de sintetase de ácidos graxos no cérebro, assim como concentrações mais altas de triacilglicerídeos séricos.
Conclusão
Ingestão de xarope de milho com alta concentração de frutose a 15% ou de dieta hiperlipídica diminuíram a expressão gênica de leptina no cérebro de ratos Wistar, com diferentes efeitos sobre o aumento de peso.
Palavras-chave: Peso corporal. Dieta hiperlipídica. Gene de sintetase de ácidos graxos. Frutose. Leptina.
I N T R O D U C T I O N
In Mexico the use of High Fructose Corn Syrup (HFCS) as a sweetener has increased in the last 20 years from 0.09 kg per capita in 1990 to 5.3 kg in 2000 and 12.5 kg in 20131. Fruit juices,
nectars, soft drinks, and cookies are foods that compose the diet of Mexican children sweetened with HFCS. High intake of these foods is associated with the nutritional transition toward ever growing prevalences of overweight and obesity in children2, and obesity and diabetes in
adults3. Associations between sugar intake from
beverages and weight gain4, type 2 diabetes5-7,
cardiovascular disease, and metabolic syndrome have been reported8,9.
High fructose corn syrup was initially regarded as a sweetener suitable for diabetic patients because it has low glycemic index compared
with glucose10. However, HFCS intake may
promote the development of chronic diseases, such as diabetes and cardiovascular disease11,
which have been related to hypertriglyceridemia12
and insulin resistance13 in patients with prolonged
HFCS intake.
Direct fructose administration into the hypothalamic arcuate nucleus increases food intake in rats and regulates the expression of some genes, such as orexigenic neuropeptide Y and agouti protein14. Glucose but not fructose changes
blood flow in brain regions associated with appetite and reward pathways, affecting hunger, fullness, and satiety15. Hence, fructose may be
M E T H O D S
Male rats aged 21 days were housed in standard polycarbonate shoebox cages under a 12 hour light and 12 hour dark regimen at 24±2ºC and 55±10% humidity. The control rats received water ad libitum and were fed a standard diet (Formulab Chow 5008, Purina®, Framinghn,
Massachusetts, United States). The other groups received defined diets: High-Fructose diet (HFr, standard diet containing 3.5 kcal/g and HFCS 55 solution in deionized water at 15% concentration) and High-Fat diet (HFat, diet containing 6.5 kcal/g with 40% calories from margarine) for 14 weeks.
Body weight, water intake, and food intake were measured weekly. Blood samples were obtained at 45 and 98 days of life to quantify plasma levels of triglycerides, total cholesterol, High-Density Lipoprotein (HDL) cholesterol, and glucose, using commercial enzymatic colorimetric kits (Winer Lab®). All procedures were approved
by the Universidad Autónoma del Estado de
Hidalgo Animal Research Committee.
Gene expression
At 14 weeks of life the rats were killed in the morning after fasting for 8 hours. After dissection, brain tissue and mesenteric adipose tissue were washed in dulbecco’s phosphate-buffered saline to eliminate blood contamination and immediately frozen in liquid nitrogen. Total Ribonucleic Acid (RNA) was extracted with TRIzol®
reagent (Invitrogen®, Carlsbad, California, United
States) supplemented with Ribonuclease (RNAse)-free Deoxyribonuclease (DNAse), and cleaned with the Qiagen RNeasy® mini kit according to
the manufacturer’s instructions. RNA integrity was assessed by gel electrophoresis. Complementary DNA (cDNA) was synthesized at 42°C for 60 minutes using 2 µg of total RNA and 0.5 µg of Oligo (dT) 18 primers (Invitrogen®) denatured at
72°C for 10 minutes. Then, strand buffer (1X), 0.5 µM dithiothreitol, 500 µM of each
deoxyribose-containing Nucleotide Triphosphate (dNTP), and 200 U of moloney Murine Leukemia Virus Reverse Transcriptase (MMLV-RT) were added (Invitrogen®). Subsequently, MMLV-RT was
inactivated at 72°C for 10 minutes.
Polymerase Chain Reaction (PCR) was performed in a Techne® TC-512 Thermal cycler
(Stone, Staffordshire, United Kingdom). The relative expression levels of the genes of interest and housekeeping genes (beta-actin and 18S rRNA) were determined by semi-quantitative PCR. Each reaction (20 µL) contained 20 mM Tris/ hydrochloric acid, 50 mM potassium chloride, 2 mM MgCl2, 200 µM dNTP, 0.25 pmol/µL specific primers, and 2.5 U of TaqDNA polymerase (Invitrogen®, Dun Looghaire, Dublin, Ireland).
Primers were designed with Primer Premiere 5.0 software and the sequences are as follows: Fatty Acid Synthase (FAS) forward (fo) 5’CTC CGT GGA ACA AAG GAG TG 3’, FAS reverse (re) 5’ GTC AAA GGG CAG AGG CAT AG 3’; Leptin (LEP) fo 5’AAA AGA ACG GGA CAG AAC AAC 3’, LEP re: 5’TGA CCA AGG TGA CAT AGC G 3’; Beta-actin fo: 5’ ACT GCC GCA TCC TCT TCC TC 3’, Beta-actin re: 5’ TCTGCTTGCTGATCCACATC 3’, 18S fo: CCTGAGAAACGGCTACCACATC and 18 re: CTTTCGCTCTGGGTCGTCTTGC, where A (Adenine), C (Cytosine), G (Guanine), and T (Thymine). The intensity of the amplified bands was analyzed by the AlphaImager®
software (San Jose, California, United States, and then normalized with the beta-actin or 18S signal.
Data were expressed as mean ± standard deviation. Means between groups were assessed by one-way Analysis of Variance (Anova), followed by a post-hoc comparison to determine differences between or within the groups. The two groups were compared by the Student’s t test. All statistical analyses were by the Statistical Package for the Social Sciences (SPSS Inc., Chicago, Illinois, United States) for Windows.
R E S U L T S
Intake regulation and weight gain
After 11 weeks of treatment, the mean weights of the groups differed significantly (Figure 1); however, calorie intake per kilogram (kcal/g weight) at 77 days of treatment was similar in all study groups because only the distribution of energy nutrients varied between the groups (Table 1). Rats fed the HFat diet were heavier by the end of the treatment (429.3±25.6 g). Rats fed the HFr diet presented the same pattern of weight gain as the control rats. This similar pattern of weight gain occurred despite different protein intakes (27% in the standard diet and 18% in the HFr diet). Rats fed the HFat diet consumed 10% of their energy as protein in week 14 of life.
Intake of a 15.0% HFCS solution ad libitum
for 11 weeks did not cause the rats to lose their energy intake regulation (kcal/g weight), the same was observed when they were fed with HFat diet (Table 1). The animals in the HFr group increased their carbohydrate consumption by consuming a larger volume of the HFCS solution (1.2 mL/g weight/week versus 0.6 mL/g weight/week in the
control group, p<0.001 Student’s t test). The 15.0% HFCS solution in week 14 of life accounted for 33.5±4.1% of the total calorie intake of animals in the HFr diet. Animals fed 15.0% HFCS solution preferred the sweet solution, while water intake was similar in animals fed the standard and HFat diets (Table 1).
Biochemical indicators
Table 2 shows the circulating levels of glucose, total cholesterol, HDL-cholesterol and triglycerides of the three groups. In the HFr group the effect of consuming the 15% HFCS solution on the metabolic indicators was present at 98 days (14 weeks) of treatment as serum triglycerides increased and HDL-cholesterol decreased. Animals in the HFat group had higher levels of glucose than the control group (p<0.01, Student’s t test).
Both treatment groups had higher plasma triglyceride levels than the control group (p<0.01, one-way Anova) but as expected, the HFr group had the highest levels. HDL-cholesterol levels decreased in both treatment groups (Table 2).
Expression of the leptin and FAS genes
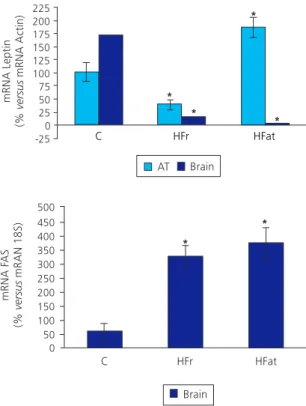
Levels of gene expression are shown in Figure 2. The HFat diet had higher leptin gene expression in adipose tissue than the control diet (p<0.05, Student’s t test) or the HFr diet, by 1.5 times in the latter. Leptin expression in the adipose tissue of rats fed the HFat diet contrasted expression in the brain, which was the lowest of the study groups (p<0.01, one-way Anova). Animals fed the HFr diet had lower leptin expression in adipose tissue and brain than the control group (p<0.01, Student’s t test).
Leptin expression was lowest in the brains of the HFat and HFr groups with the increased expression of FASin the brain. Compared with the control group, they presented 2.7- and 3.1-fold changes, respectively (p<0.01, one-way Anova). Figure 1. Body weight gain of weaned (21 days of life) male
Wistar rats fed High-Fat Diet (HFat), High-Fructose Diet (HFr), or standard diets. The results are presented as mean, standard deviation with six animals per group. Note: Differences are in relation to the standard diet, *p<0.05, **p<0.01;
Table 1. Comparison of effects of High Fructose Corn Syrup Solution (HFCS) and vegetable fat on food energy intake, liquid intake and energetic nutrient distribution in male rats.
Table 2. Biochemical markers of metabolic syndrome in Wistar rats. The data represent serum levels ± standard deviation at 24 and 77 days of treatment (n=6).
2 4 8 10 11 2 4 8 10 11 2 4 8 10 11 2 4 8 10 11 Week
Energy intake (kcal/g weight/week)
3.6 0.25a
3.1 0.18 2.2 0.12 1.8 0.10 1.8 0.12
Protein intake (g/g weight/week)
0.24 0.02a
0.21 0.02a
0.14 0.01a
0.13 0.10a
0.12 0.12a
Energetic nutrient distribution (Ch-L-P %)
56-17-27 56-17-27 56-17-27 56-17-27 56-17-27
Liquid intake (mL/g weight/week)
Water 1.23 0.22b
0.97 0.13b
0.68 0.12b
0.52 0.11b
0.6 0.12b
M SD
Control
M SD
HFr
4.7 0.32b
3.5 0.24b 2.2 0.13b 2.3 0.14b 2.3 0.23b
0.26 0.02a
0.17 0.01b
0.09 0.01b
0.14 0.14a
0.10 0.13a
69-12-19 69-12-19 72-11-17 68-12-20 71-11-18 Fr (15%) 2.38 0.35a
1.50 0.14a
1.32 0.13a
1.17 0.12a
1.2 0.13a
M SD
HFat
4.0 0.52 3.3 0.28 2.4 0.17 2.2 0.13 1.9 0.39
0.16 0.01b
0.09 0.01bc
0.06 0.004bc
0.05 0.003b
0.05 0.39b
21-69-10 21-69-10 21-69-10 21-69-10 21-69-10 Water 1.4 0.26b
0.7 0.17b
0.7 0.17b
0.7 0.13b
0.6 0.19b
Note: Data not sharing a common superscript (a, b, c) are significantly different (p<0.05, one-way analysis of variance, least significant difference
post hoc test).
HFr: High-Fructose diet; HFat: High-Fat diet; M: Mean; SD: Standard Deviation; Ch: Carbohydrates; L: Lipids; P: Proteins.
Control HFr HFat p Control HFr HFat p
24 days of treatment
104.8 17.1
095.5 13.4 103.2 21.7 0.222
77 days of treatment
094.5 06.5a 096.2 03.8 142.1 12.9b
≥0.001
Groups Glucose mg/dL
M SD
094.1 07.2a
123.2 11.1b
111.4 13.2 0.018
102.1 08.0
094.8 07.2a
121.3 07.6b
0.005 Cholesterol mg/dL M SD
140.9 15.8 143.9 16.7 133.5 13.7 0.263
105.5 12.1a
210.3 17.1b
183.2 18.2b
≥0.001 Triglycerides mg/dL
M SD
41.6 4.5 34.3 2.1 46.2 7.1 0.168
56.6 4.6a
27.3 3.3b
27.5 3.9b
≥0.001 HDL-c mg/dL M SD
Note: Data not sharing a common superscript (a, b, c) are significantly different (p<0.05, one-way analysis of variance, least significant difference
post hoc test).
D I S C U S S I O N
Growing obesity rates in Mexico have been linked to changes in eating habits and physical activity, along with higher intake of sweetened beverages, beginning in the first years of life16.
HFCS is widely used by the food industry to sweeten a large variety of foods consumed mainly by children and adolescents17. Chronic HFCS and
excess fat intakes by humans4,18 and rodents19,20
promotes weight gain, further altering blood metabolic indicators, such as triglycerides and glucose21.
To determine whether the changes in weight are explained by loss of energy intake regulation or by nutrient distribution, we used an animal model that allowed intake of a 15% HFCS ad libitum. The energy intake of rats fed a
high-fat diet, high-fructose diet, or standard chow was quantified and changes in body weight were measured.
The results indicate that consumption of 15% HFCS did not affect energy intake regulation, only the animals fed the HFat diet gained weight after 11 weeks of treatment. This weight difference was not solely related to dietary protein intake because protein intake was lower in the HFat diet group. The data suggest that male rats fed with a 15% HFCS solution and a standard diet after weaning can maintain a body weight similar to that of control rats.
In several studies there is controversy regarding the amount of fructose that promotes weight gain. Intake of 70% fructose, but not glucose, negatively affects weight gain in Wistar rats fed the same amount of protein22; however,
weight gain in female rats fed a solution of 13% HFCS ad libitum for 8 weeks has also been reported20. HFCS may have little effect on females
at the 30th week of life but still favor significant
weight gain in males (8% HFCS)19. The data
suggest that weight gain or loss is related to the proportion of HFCS consumed. Weight changes are not explained solely by protein intake; total glucose intake can also affect weight gain. The amount of glucose in the diet of animals consuming fructose should not be less than 23% of total energy intake22. In our study, the glucose
proportions in the control and HFr diets were 36 and 37%, respectively, thus same glucose intake could explain the equal weight gain of the animals.
As expected, the animals that consumed HFCS had hypertriglyceridemia. De novo lipogenesis promoted by high fructose intake is a primary mechanism in the development of hepatic steatosis23. Several animal studies indicate that
Sterol Regulatory Element-Binding Protein 1 (SREBP1c) is a major mediator of lipogenesis in the liver when high-carbohydrate diets are consumed24,25. In rats’ liver, hypertriglyceridemia
from fructose is related to activation of the transcription factor SREBP-1c, which activates Figure 2. Relative expression of the leptin and Fat Acid Synthase
(FAS) genes in adipose tissue and brain of 3.5-month-old male Wistar rats fed after weaning for 98 days (n=6) standard diet (C), standard diet plus 15% high-fructose corn syrup solution (High-Frutose diet, HFr), or diet with 40% margarine (High-Fat diet, HFat).
Note: *Different from control group (p<0.05, Student’s t test).
transcription of genes required for fatty acid synthesis, such as acetyl coenzyme A, carboxylase, fatty acid synthase, and stearoyl coenzyme-A desaturase-126. Sirtuin 1 (SIRT1) is a deacetylase
protein involved in the cellular metabolism of lipids and glucose27. Downregulation of SIRT1
expression resulted in a significant increase of triglyceride accumulation in 3T3-L1 cells28. In
humans’ and rats’ liver cells, fatty acid oxidation is inhibited by fructose by reducing peroxisome proliferator-activated receptor alpha expression and activity, through a mechanism involving SIRT1 downregulation29. This evidence suggests that
high triglycerides in the serum of animals fed the HFr diet is mediated by SREBP-1 and SIRT1.
Elevated triglyceride levels may inhibit the transport of leptin across the blood-brain barrier of rodents30, and high-fructose diets (60%)
induced hepatic triglycerides synthesis31 and
hypothalamic leptin resistance32, so there is a
relation between dietary fructose and leptin. The study animals fed the HFr or HFat diet had hypertriglyceridemia and low levels of leptin expression in the brain. These results suggest that, in the brain, the leptin gene is regulated by fat and fructose availability. Diet-induced obesity is associated with lower levels of leptin receptor expression in the hypothalamus yet high serum leptin33. Leptin mRNA levels in the hypothalamus,
cortex, and pituitary were undetectable in fasted rats34, which may have had fasting-induced
hypertriglyceridemia. Haring & Harris35 described
peripheral leptin resistance in rats fed fructose (40%). High fat diets also induced central leptin resistance36. Lower leptin gene expression by
HFCS intake also may be associated with leptin resistance.
Lower leptin expression compared with controls was associated with higher FAS expression in rats’ brains. Fructose intake (10%) increases the expression of the FAS gene up to six times from the seventh day of intake29, and
fructose directly inhibits the oxidation of fatty acids in rats’ livers37. This process is mediated by
an increase in xylulose-5-phosphate, which activates protein phosphatase 2A, which affects
leptin signaling, ultimately producing a fatty acid oxidation deficit in the liver38. These data suggest
that the effect of fructose on fatty acid oxidation is mediated by leptin and that resistance to it and/or low leptin signaling may be associated with a higher level of fatty acid synthesis.
C O N C L U S I O N
In conclusion, 15% HFCS did not affect weight gain in Wistar rats, possibly because the animals in the HFCS and control groups had the same glucose intake. The two experimental diets reduced the expression of leptin in the brain. This lower expression may be associated with hepatic synthesis of fatty acids, thereby producing the hypertriglyceridemia observed in the animals. Furthermore, the 15% HFCS in the HFr diet related to lower leptin expression in adipose tissue. The metabolic basis of low leptin expression in rats fed high-fructose diets has not been determined. It would be interesting if future studies determined the effect of HFCS intake on the expression of other genes associated with the regulation of hunger and satiety.
A C K N O W L E D G M E N T S
This study was supported by Programa del Mejoramiento del Profesorado (UAEH-EXP-090) and
Consejo Nacional de Ciencia y Tecnología, Project nº 216092.
C O N T R I B U T O R S
G LÓPEZ-RODRÍGUEZ designed the study, performed the data analysis, and wrote the study report. SK OSUNA and T SUÁREZ DIEGUEZ conducted the experimental analysis. M GALVÁN GARCÍA contributed to the writing and editing of the manuscript.
R E F E R E N C E S
Infocanã; 2014 [acceso 2014 Mar 1]. Disponible en: http://www.infocana.gob.mx /lista_balances. php?t=2
2. Barquera S, Campos I, Rivera JA. Mexico attempts to tackle obesity: The process, results, push backs and future challenges. Obes Rev. 2013; 14(Suppl. 2): 69-78. http://dx.doi.org/10.1111/obr.12096 3. Goran MI, Ulijaszek SJ, Ventura EE. High fructose
corn syrup and diabetes prevalence: A global perspective. Glob Public Health. 2013; 8(1):55-64. http://dx.doi.org/10.1080/17441692.2012.73 6257
4. Mattes RD, Shikany JM, Kaiser KA, Allison DB. Nutritively sweetened beverage consumption and body weight: A systematic review and meta-analysis of randomized experiments. Obes Rev. 2011; 12(5):346-65. http://dx.doi.org/10.1111/j.1467-78 9X.2010.00755.x
5. Palmer JR, Boggs DA, Krishnan S, Hu FB, Singer M, Rosenberg L. Sugar-sweetened beverages and incidence of type 2 diabetes Mellitus in African American women. Arch Int Med. 2008; 168(14): 1487-92. http://dx.doi.org/10.1001/archinte.168. 14.1487
6. Romaguera D, Norat T, Wark PA, Vergnaud AC, Schulze MB, van Woudenbergh GJ, et al.
Consumption of sweet beverages and type 2 diabetes incidence in European adults: Results from EPIC-InterAct. Diabetologia. 2013; 56(7):1520-30. http://dx.doi.org/10.1007/s00125-013-2899-8 7. Fagherazzi G, Vilier A, Saes Sartorelli D, Lajous M,
Balkau B, Clavel-Chapelon F. Consumption of artificially and sugar-sweetened beverages and incident type 2 diabetes in the Etude Epidemiologique aupres des femmes de la Mutuelle Generale de l’Education Nationale-European Prospective Investigation into Cancer and Nutrition cohort. Am J Clin Nutr. 2013; 97(3):517-23. http://dx.doi.org/ 10.3945/ajcn.112.050997
8. Bray GA. Fructose and risk of cardiometabolic disease. Curr Atheroscler Rep. 2012; 14(6):570-8. http://dx.doi.org/10.1007/s11883-012-0276-6 9. de Koning L, Malik VS, Kellogg MD, Rimm EB,
Willett WC, Hu FB. Sweetened beverage consumption, incident coronary heart disease, and biomarkers of risk in men. Circulation. 2012; 125(14):1735-41. http://dx.doi.org/10.1161/ CIRCULATIONAHA.111.067017
10. Bazzano LA, Li TY, Joshipura KJ, Hu FB. Intake of fruit, vegetables, and fruit juices and risk of diabetes in women. Diabetes Care. 2008; 31(7):1311-7. http://dx.doi.org/10.2337/dc08-0080
11. Dekker MJ, Su Q, Baker C, Rutledge AC, Adeli K. Fructose: A highly lipogenic nutrient implicated in
insulin resistance, hepatic steatosis, and the metabolic syndrome. Am J Physiol Endocrinol Metab. 2010; 299(5):E685-94. http://dx.doi.org/ 10.1152/ajpendo.00283.2010
12. Stanhope KL, Bremer AA, Medici V, Nakajima K, Ito Y, Nakano T, et al. Consumption of fructose and high fructose corn syrup increase postprandial triglycerides, LDL-cholesterol, and apolipoprotein-B in young men and women. J Clin Endocrinol Metab. 2011; 96(10):E1596-605. http://dx.doi.org/ 10.1210/jc.2011-1251
13. Stanhope KL, Schwarz JM, Keim NL, Griffen SC, Bremer AA, Graham JL, et al. Consuming fructose-sweetened, not glucose-fructose-sweetened, beverages increases visceral adiposity and lipids and decreases insulin sensitivity in overweight/obese humans. J Clin Invest. 2009; 119(5):1322-34. http://dx.doi. org/10.1172/JCI37385
14. Cha SH, Wolfgang M, Tokutake Y, Chohnan S, Lane MD. Differential effects of central fructose and glucose on hypothalamic malonyl-CoA and food intake. Proc Natl Acad Sci. 2008; 105(44):16871-5. http://dx.doi.org/10.1073/pnas.0809255105 15. Page KA, Chan O, Arora J, Belfort-Deaguiar R,
Dzuira J, Roehmholdt B, et al. Effects of fructose vs
glucose on regional cerebral blood flow in brain regions involved with appetite and reward pathways. JAMA. 2013; 309(1):63-70. http://dx. doi.org/10.1001/jama.2012.116975
16. Barquera S, Campirano F, Bonvecchio A, Hernandez-Barrera L, Rivera JA, Popkin BM. Caloric beverage consumption patterns in Mexican children. Nutr J. 2010; 9:47. http://dx.doi.org/10.11 86/1475-2891-9-47
17. Vos MB, Kimmons JE, Gillespie C, Welsh J, Blanck HM. Dietary fructose consumption among US children and adults: The Third National Health and Nutrition Examination Survey. Medscape J Med. 2008; 10(7):160.
18. Forshee RA, Storey ML, Allison DB, Glinsmann WH, Hein GL, Lineback DR, et al. A critical examination of the evidence relating high fructose corn syrup and weight gain. Crit Rev Food Sci Nutr. 2007; 47(6):561-82. http://dx.doi.org/10.1080/104083 90600846457
19. Bocarsly ME, Powell ES, Avena NM, Hoebel BG. High-fructose corn syrup causes characteristics of obesity in rats: Increased body weight, body fat and triglyceride levels. Pharmacol Biochem Behav. 2010; 97(1):101-6. http://dx.doi.org/10.1016/j. pbb.2010.02.012
Med. 2009; 234(6):651-61. http://dx.doi.org/10.3 181/0812-RM-368
21. Stanhope KL, Havel PJ. Fructose consumption: Potential mechanisms for its effects to increase visceral adiposity and induce dyslipidemia and insulin resistance. Curr Opin Lipidol. 2008; 19(1):16-24. http://dx.doi.org/10.1097/MOL.0b0 13e3282f2b24a
22. Shibata K, Fukuwatari T. High d(+)-fructose diet adversely affects testicular weight gain in weaning rats horizontal line protection by moderate d(+)-glucose diet. Nutr Metab Insights. 2013; 6:29-34. http://dx.doi.org/10.4137/NMI.S12584
23. Maersk M, Belza A, Stodkilde-Jorgensen H, Ringgaard S, Chabanova E, Thomsen H, et al.
Sucrose-sweetened beverages increase fat storage in the liver, muscle, and visceral fat depot: A 6-mo randomized intervention study. Am J Clin Nutr. 2012; 95(2):283-9. http://dx.doi.org/10.3945/ajcn. 111.022533
24. Shimano H, Horton JD, Shimomura I, Hammer RE, Brown MS, Goldstein JL. Isoform 1c of sterol regulatory element binding protein is less active than isoform 1a in livers of transgenic mice and in cultured cells. J Clin Invest. 1997; 99(5):846-54. http://dx.doi.org/10.1172/JCI119248
25. Li X, Xu Z, Wang S, Guo H, Dong S, Wang T, et al.
Emodin ameliorates hepatic steatosis through endoplasmic reticulum stress-sterol regulatory element binding protein 1c pathway in liquid-fructose feeding rats. Hepatol Res. 2015. http://dx. doi.org/10.1111/hepr.12538. [Epub ahead of print]. 26. Aragno M, Tomasinelli CE, Vercellinatto I, Catalano MG, Collino M, Fantozzi R, et al. SREBP-1c in nonalcoholic fatty liver disease induced by Western-type high-fat diet plus fructose in rats. Free Radical Biol Med. 2009; 47(7):1067-74. http://dx.doi.org/ 10.1016/j.freeradbiomed.2009.07.016
27. LaBarge S, Migdal C, Schenk S. Is acetylation a metabolic rheostat that regulates skeletal muscle insulin action? Mol Cells. 2015; 38(4):297-303. http://dx.doi.org/10.14348/molcells.2015.0020 28. Picard F, Kurtev M, Chung N, Topark-Ngarm A,
Senawong T, Machado de Oliveira R, et al. Sirt1 promotes fat mobilization in white adipocytes by repressing PPAR-gamma. Nature. 2004; 429(6993): 771-6. http://dx.doi.org/10.1038/nature02583 29. Rebollo A, Roglans N, Baena M, Sanchez RM,
Merlos M, Alegret M, et al. Liquid fructose downregulates Sirt1 expression and activity and impairs the oxidation of fatty acids in rat and human
liver cells. Biochim Biophys Acta. 2014; 1841(4): 514-24. http://dx.doi.org/10.1016/j.bbalip.2014.0 1.002
30. Banks WA, Coon AB, Robinson SM, Moinuddin A, Shultz JM, Nakaoke R, et al. Triglycerides induce leptin resistance at the blood-brain barrier. Diabetes. 2004; 53(5):1253-60.
31. Huang D, Dhawan T, Young S, Yong WH, Boros LG, Heaney AP. Fructose impairs glucose-induced hepatic triglyceride synthesis. Lipids Health Dis. 2011; 10:20. http://dx.doi.org/10.1186/1476-511 X-10-20
32. Bursac BN, Vasiljevic AD, Nestorovic NM, Velickovic NA, Vojnovic Milutinovic DD, Matic GM, et al. High-fructose diet leads to visceral adiposity and hypothalamic leptin resistance in male rats--do glucocorticoids play a role? J Nutr Biochem. 2014; 25(4):446-55. http://dx.doi.org/10.1016/j.jnutbio. 2013.12.005
33. Liu ZJ, Bian J, Liu J, Endoh A. Obesity reduced the gene expressions of leptin receptors in hypothalamus and liver. Horm Metab Res. 2007; 39(7):489-94. http://dx.doi.org/10.1055/s-2007-9 81680
34. Morash B, Li A, Murphy PR, Wilkinson M, Ur E. Leptin gene expression in the brain and pituitary gland. Endocrinology. 1999; 140(12):5995-8. http:// dx.doi.org/10.1210/endo.140.12.7288
35. Haring SJ, Harris RB. The relation between dietary fructose, dietary fat and leptin responsiveness in rats. Physiol Behav. 2011; 104(5):914-22. http:// dx.doi.org/10.1016/j.physbeh.2011.05.032 36. Zhang Y, Scarpace PJ. The role of leptin in leptin
resistance and obesity. Physiol Behav. 2006; 88(3):249-56. http://dx.doi.org/10.1016/j.physbeh. 2006.05.038
37. Prager GN, Ontko JA. Direct effects of fructose metabolism on fatty acid oxidation in a recombined rat liver mitochondria-hish speed supernatant system. Biochim Biophys Acta. 1976; 424(3):386-95. 38. Vila L, Roglans N, Alegret M, Sanchez RM,
Vazquez-Carrera M, Laguna JC. Suppressor of cytokine signaling-3 (SOCS-3) and a deficit of serine/ threonine (Ser/Thr) phosphoproteins involved in leptin transduction mediate the effect of fructose on rat liver lipid metabolism. Hepatology. 2008; 48(5):1506-16. http://dx.doi.org/10.1002/hep. 22523