Effect of Diet and Indoor Cycling on Body Composition and Serum
Lipid
Valéria Sales do Valle
1; Danielli Braga de Mello
2; Marcos de Sá Rego Fortes
3; Estélio Henrique Martin Dantas
4;
Marco Antonio de Mattos
5Laboratório de Biociências da Motricidade Humana da Universidade Castelo Branco (LABIMH/RJ)1; Escola de Educação Física do Exército
(EsEFEx)2; Instituto de Capacitação Física do Exército3; CNPq4; Instituto Nacional de Cardiologia-INC5, Rio de Janeiro, RJ - Brazil
Mailing address: Valéria Valle •
Rua Miecio Pereira da Silva, 80 - Campo Grande - 23088-320 - Rio de Janeiro, RJ - Brazil
E-mail: [email protected]
Manuscript received April 03, 09; revised manuscript received October 28, 2009, accepted on December 10, 2009.
Abstract
Background: Indoor cycling is an aerobic exercise that employs large muscle groups of the lower limbs, lacking osteoarticular impact and high energy expenditure, which makes it interesting to generate a non-pharmacological strategy.
Objective: To assess body composition and lipid profile in overweight women after twelve weeks of low-calorie diet and indoor cycling training.
Methods: We randomly assigned 40 women (23.90 ± 3.10 years), divided into four groups: control (C), indoor cycling
(CI), indoor cycling combined with low-calorie diet (CD) and low-calorie diet (D). The variables were: height and body mass, BMI, fat percentage, lean body mass, triglycerides, cholesterol and lipoproteins (HDL, LDL, VLDL). The indoor cycling training consisted of three weekly sessions of 45 minutes each and an energy restriction of about 1,200 kcal. The study lasted 12 weeks. We used descriptive statistics (mean and standard deviation) and inferential statistics (Student’s t test). The level of significance was p < 0.05.
Results: The groups CI, CD and D significantly reduced the mean anthropometric variables after 12 weeks of intervention (body mass, fat percentage and body mass index), and serum levels of total cholesterol and triglycerides. HDL cholesterol increased significantly for groups CI and CD.
Conclusion: According to the results, the indoor cycling and the low-calorie diet helped fight overweight and control
serum lipids. (Arq Bras Cardiol 2010; 95(2): 173-178)
Key words: Overweight; bicycling; lipids; body composition.
body fat percentage (BF%), as well as increased levels of high density lipoprotein (HDL), lean body mass (LBM) and basal metabolic rate6,7. The one that most works on the metabolism
of lipoproteins is the aerobic exercise8.
Indoor cycling9 is an aerobic exercise that employs large
muscle groups of the lower limbs, lacking osteoarticular impact and high energy expenditure, which makes it interesting to generate a non-pharmacological strategy. It applies to all ages and different fitness levels.
In a period of clear consolidation in the fitness industry, indoor cycling is proven to get increasingly alive10,11. Hence, it is
an attractive strategy to achieve an increased cardiorespiratory fitness, reduced body fat and a potential minimization of the risk of cardiovascular diseases.
The purpose of this study is to assess body composition and serum lipid profile of overweight women undergoing 12 weeks of low-calorie diet with or without indoor cycling training.
Methods
After completion of sample size calculation, we randomized (by generating random computer numbers) 40 healthy
Introduction
Dyslipidemia and obesity represent a serious public health problem and should be addressed through prevention programs and education. Treatment includes changes in lifestyle with healthy eating habits, maintenance or acquisition of adequate body mass, regular exercising and, depending on the response, the use of hypolipemiant agents1,2.
Regular exercising has received great reputation in the field of health, not just for its action alone in the prevention and control of cardiovascular diseases3,4 but also because it induces
positive changes to the levels of plasma lipids5.
women, according to the American College of Sports Medicine (ACSM)12, who volunteered to start an indoor cycling program.
These were divided into four groups: indoor cycling group (IC), indoor cycling associated with low-calorie diet (CD), diet group (D), and control group (C). Each group consisted of 10 women. All volunteers were informed orally and in writing on the procedures of this study, and agreed to sign a post-informed consent. This study complied with the standards for research involving human beings13.
Data collection was divided into 4 stages:
Step 1: assessment of body composition
It was measured through anthropometric methods and according to the protocol cited by Lohman et al14. The
following variables were measured: body mass (BM), height, body mass index (BMI), body fat percentage (BF%) and lean body mass (LBM).
Body mass (kg) and height (m) were taken with a scale (Filizola™, Brazil) with 100 g precision and scale of 0 to 150 kg, which a stadiometer attached.
The body mass index (BMI) calculated by dividing these two measures (kg/m2) was used to classify obesity according
to the cutoffs recommended by Ardern et al15.
The fat percentage was recorded according to Jackson and Pollock’s seven skinfolds protocol16, using a skinfold caliper
(Lange™).
Step 2: diagnostic evaluation
It was performed by the laboratory Sérgio Franco Medicina Diagnóstica and the following variables were measured through blood collection: triglycerides (TG), low-density lipoprotein (LDL), very low-density lipoprotein (VLDL), high-density lipoprotein (HDL), and total cholesterol (TC). For the measurements of HDL, CT and TG, we used the enzymatic colorimetric method. VLDL and LDL were calculated by the Friedewald equation, and all values are expressed in mg/dl.
Individuals from all of the four groups (C, CI, GD & D) carried out the procedures for the 1st and 2nd stages, which
occurred in the same week.
Step 3: Intervention
Indoor cycling - It was performed by the groups CI and CD through an interval training model with short periods of active recovery that would allow recovering the exercise performed. The classes were three times a week. Each session consisted of about 45 minutes in a transitional period of 12 weeks. Groups CI and CD took the classes at different times, but following the same protocol.
The intensity was controlled by heart rate, musical bpm to determining the rhythm and perceived exertion (overload).
Heart rate monitoring was done with the help of four employees through a Polar™ frequency meter (Finland), model F1.
The training was conducted at the target zone 55 ± 5% to 85 ± 5% HRMax, using the Inbar
17 equation:
HRMax = 205.8-0.685 x age
To control the rhythm, we used the musical BPM music (number of beats per minute of music). Music plays an important role in encouraging the participants, but it is also a teaching tool to determine the rhythm of the techniques selected, since there is a direct correlation of bpm and rpm11.
Overload control was performed using Borg’s Perceived Exertion Scale through a table attached close to the bikes. The exertion degree was represented by numbers.
Low-calorie diet - The CD and D groups were assisted by the same dietitian using a food recall. During the study period, the individuals participated in biweekly meetings. In all cases, besides the nutritional assessment, the targets effectively achieved were recorded. Then, the participants had the opportunity to express the difficulties they felt in following the instructions given in the previous medical appointment. They were directed on the possible ways to overcome such difficulties.
Energy consumption was approximately 1,200 kcal/day. These were divided into about eight meals (with an interval of at least two hours and a maximum of four hours). The individuals were instructed not to replace the main meals for snacks, always respect the times and quantities and have at least two liters of water per day. The period for this restriction was 12 weeks.
Each individual received, in addition to the diet prescription with a list of possible replacement items (always respecting the quantities), notes and information on the eating routine.
Step 4: reassessment
After 12 weeks of intervention, the experimental groups performed the same procedures and protocols described in steps 1 and 2.
For data analysis we used descriptive statistics18 through
measures of location (mean) and dispersion (standard deviation). The homogeneity of the samples was measured through kurtosis, and normality through the Kolmogorov-Smirnov test. Inferential statistics techniques were used to compare the means through Student’s t test and Anova (analysis of variance) in inter and intra-group analysis. Subsequently, we applied Tukey’s Post Hoc Analysis to identify and determine the group with significant result. We used a significance level of 95% (p < 0.05).
Results
The average age of the 40 women was 23.90 ± 3.10, and there was no difference between the groups. All groups presented a normal and homogeneous distribution for all variables analyzed. We found a high body fat percentage (BF%) for the average age of the groups and a BMI between 25.0 kg/m2 and 30.0 kg/m2 which enabled us to classify them
as overweight (Table 1).
Table 1 - Descriptive results of anthropometric variables of the four g
Age Height (m) BM (kg) BF% BMI (kg/m2) LBM (kg)
GC 24.10 ± 3.51 1.62 ± 0.03 71.85 ± 6.05 31.66 ± 3.15 27.52 ± 1.68 49.17 ± 3.28
KS 1.00 0.71 0.96 0.94 0.97 0.48
GCI 24.00 ± 3.20 1.60 ± 0.05 68.80 ± 7.08 32.92 ± 2.25 26.77 ± 2.01 46.05 ± 3.81
KS 0.98 0.80 0.82 1.00 0.28 0.90
GCD 23.60 ± 3.92 1.59 ± 0.06 74.39 ± 8.30 33.88 ±5.38 29.38 ± 3.48 49.04 ± 5.53
KS 0.62 0.83 0.92 0.84 0.80 0.99
GD 23.50 ± 1.78 1.61 ± 0.03 71.43 ± 4.22 33.09 ± 3.65 27.60 ± 1.54 47.68 ± 1.70
KS 0.77 0.96 0.90 0.99 0.10 0.84
CG - control group; GCI - indoor cycling group, GCD - indoor cycling group combining low-calorie diet, GD – diet group; KS - Kolmogorov-Smirnov; BM - body mass; BF% - body fat percentage, BMI - body mass index ; LBM - lean body mass.
Table 2 - Descriptive results of serum lipid of the four groups
TG CT LDL HDL VLDL
GC 98.10 ± 6.52 173.30 ± 10.89 114.80 ± 10.72 41.20 ± 2.57 17.30 ± 3.50
KS 0.98 0.62 0.32 0.94 0.64
GCI 102.10 ± 11.84 179.90 ± 11.11 123.40 ± 12.70 40.80 ±2.82 18.30 ± 4.19
KS 0.94 0.83 0.99 0.89 0.99
GCD 100.40 ± 18.38 172.40 ± 28.20 112.70 ± 27.70 41.30 ± 3.92 18.40 ± 5.93
KS 0.74 0.94 0.89 0.93 0.68
GD 102.60 ± 6.72 172.90 ± 10.91 111.70 ± 11.04 42.20 ± 2.10 19.00 ± 2.26
KS 0.93 0.80 0.89 0.99 0.33
TG - triglycerides; CT - cholesterol, LDL - low-density lipoprotein, HDL - high-density lipoprotein, VLDL - very low-density lipoprotein; KS - Kolmogorov-Smirnov.
analyzed. Comparing the average results produced with the reference values of plasma lipids recommended by the 3rd
Brazilian Guidelines for the Prevention of Atherosclerosis of the Department of Atherosclerosis of Brazilian Society of Cardiology1, the four groups were found to be within
desirable limits.
Table 3 shows the results of the mean anthropometric variables of the four groups before and after 12 weeks of intervention. Groups CI, CD and D presented a significant reduction in BM, BMI and body fat percentage. There was a significant reduction in LBM only in group D. The inter-group analysis found no difference in BF% between groups C and CD.
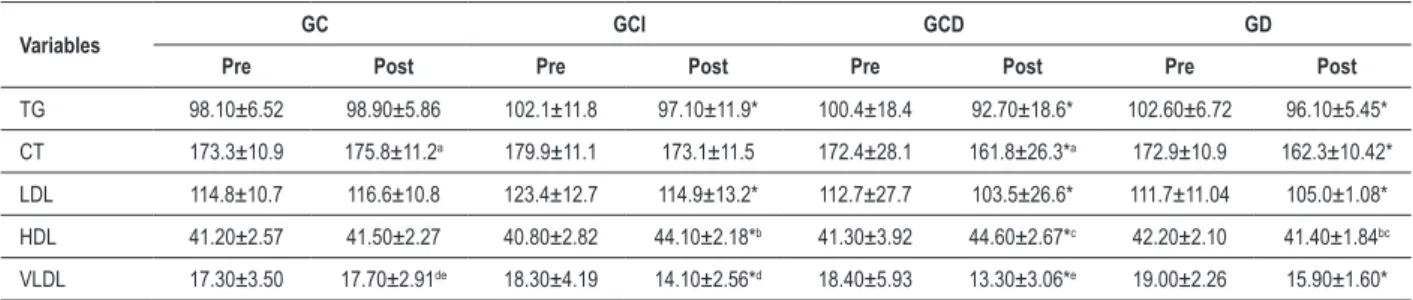
The study found that the mean serum lipid of groups CI, CD and D before and after 12 weeks of intervention revealed positive changes in TG, LDL and VLDL. As to the TC, reductions were observed only in groups CD and D. By analyzing the HDL, groups CI and CD presented significant increases. Groups CI, CD and D achieved an optimal classification for the variables TG, TC, HDL and VLDL. Even though LDL was significantly reduced, it remained in the desirable category (Table 4).
The intergroup analysis revealed positive differences in HDL between groups C and CD (p = 0.02), CI and D (p = 0.05) and CD and D (p = 0.016); and VLDL between groups C and CI (p = 0.03) and C and CD (p = 0.00).
Discussion
By analyzing the results presented by the groups CI, CD and D, after 12 weeks of intervention, we find reduced average values for the variables BM, BF% and BMI. Scientific evidence suggests that the combination of dietary changes associated with exercising is the most effective behavior for weight loss19,20.
Groups CI and CD had no changes in LBM, which is something that did not occur with group D, which had a reduction of about 2 kg. Several studies claim that the diet alone can lead to a reduction in BM and that the inclusion of an exercise program can maintain such reduction21-23.
Based on these findings, we can say that indoor cycling has contributed to the maintenance of LBM.
Based on the positive changes on the anthropometric variables presented by the groups CI and CD, we can say that the reduction in BM by both is related to the reduction in the body fat percentage, considering that the LBM was maintained.
Monteiro et al24 observed the effect of a mixed nutritional
Table 3 - Comparison of anthropometric averages of the four groups
Variables GC GCI GCD GD
Pre Post Pre Post Pre Post Pre Post
BM (kg) 71.85±6.05 72.64±6.28* 68.80±7.08 64.86±6.58* 74.39±8.30 67.05±8.85* 71.43±4.22 65.39±4.35* BF% 31.66±3.15 32.09±3.08*a 32.92±2.25 28.50±2.34* 33.88±5.38 26.68±5.99*a 33.09±3.65 30.33±3.51*
BMI (kg/m2) 27.52±1.68 27.77±1.56 26.77±2.01 25.19±2.00* 29.38±3.48 26.46±3.49* 27.60±1.54 25.26±1.59*
LBM (kg) 49.17±3.28 49.31±3.21 46.05±3.81 46.27±3.63 49.04±5.53 48.84±4.88 47.68±1.70 45.44±1.64*
BM - body mass; BF% - body fat percentage, BMI - body mass index; LBM - lean bodymass; * p < 0.05, p = 0.021 in the intergroup analysis.
Table 4 - Comparison of the mean level of serum lipids of the four groups
Variables GC GCI GCD GD
Pre Post Pre Post Pre Post Pre Post
TG 98.10±6.52 98.90±5.86 102.1±11.8 97.10±11.9* 100.4±18.4 92.70±18.6* 102.60±6.72 96.10±5.45* CT 173.3±10.9 175.8±11.2a 179.9±11.1 173.1±11.5 172.4±28.1 161.8±26.3*a 172.9±10.9 162.3±10.42*
LDL 114.8±10.7 116.6±10.8 123.4±12.7 114.9±13.2* 112.7±27.7 103.5±26.6* 111.7±11.04 105.0±1.08* HDL 41.20±2.57 41.50±2.27 40.80±2.82 44.10±2.18*b 41.30±3.92 44.60±2.67*c 42.20±2.10 41.40±1.84bc
VLDL 17.30±3.50 17.70±2.91de 18.30±4.19 14.10±2.56*d 18.40±5.93 13.30±3.06*e 19.00±2.26 15.90±1.60*
Mean values ± SD; TG - triglycerides; CT - cholesterol, LDL - low-density lipoprotein; HDL - high-density lipoprotein; VLDL - very low-density lipoprotein, * p < 0.05.a p = 0.02; bp = 0.05; cp = 0.016; dp = 0.02; ep = 0.00; in the intergroup analysis.
kg for the exercise + diet group). These findings, together with those found in this research confirm the importance of combining dietary modifications and exercising in order to achieve a body mass reduction19,25.
It is known that obesity is related to impairments in lipid metabolism26. A research work by Coelho et al27 in 153
medicine students (18 to 31 years old) revealed high levels of CT and TG only in obese individuals.
The mechanisms linking high levels of body fat with dyslipidemia are not fully understood. However, it is suggested that the exacerbated increase in the lipolysis rate results in high concentrations of nonesterified fatty acids, contributing to increased hepatic synthesis of VLDL. Besides, it inhibits glucose uptake stimulated by insulin, in a dose-dependent way, resulting in insulin resistance28.
Although the individuals of this study were overweight and had a desirable lipid profile, we can observe a reduction in the anthropometric variables and consequently in the serum lipid profile.
Groups CI and CD, which conducted indoor cycling training, presented a increase in the variable HDL. A meta-analysis29 of 51 studies, including 28 randomized controlled
trials with more than 12 weeks of training with aerobic exercising, from moderate to high intensity, some of which were combined with dietary intervention, showed great variability of lipid profile responses, in which the increase in HDL was the most striking finding (47% of studies) and, less frequently, the reduction of TG, CT and LDL.
The sedentary lifestyle is a behavior clearly identified with an unfavorable lipid profile30,31. Kelley et al32 recommend
aerobic exercising to improve the level of serum lipids. The clarification for these changes probably lies in promoting better enzymatic processes involved in lipid metabolism. Increased enzymatic activity of lipoprotein lipase is a major finding supported by evidence, which may occur from one session of exercise and over training.
Durstine and Moore33 reported that total exercising seems
to be more important than intensity to induce beneficial effects on lipoproteins, especially TG and HDL. However, it is necessary to achieve a weekly energy expenditure of about 1,200 to 2,200 calories.
On the other hand, a low-calorie diet is critical in the treatment of dyslipidemia34. Groups CI, D and CD presented
reduced TG, LDL and VLDL levels. However, only the groups D and CD decreased CT. Thus, we can observe that diet was important to achieve such reduction.
Stefanick et al35 found reduced concentrations of LDL and
CT in the group that combined diet and exercising. In a similar study, Nieman et al36 observed a reduction of CT and TG in
the groups on diet and reduced levels of LDL in the group that combined diet and exercising.
Conclusion
individual will have more opportunities of choosing their preferred exercise and engaging in exercising programs.
Recommendations
It is suggested that future studies investigate other populations, such as male overweight individuals, for example. It is also recommended to increase the sample in order to provide greater consistency to the widespread application of the results in this specific population; and perform the following measurements: waist circumference and waist-hip ratio, since these are directly linked with risk of dyslipidemia.
Potential Conflict of Interest
No potential conflict of interest relevant to this article was reported.
Sources of Funding
There were no external funding sources for this study.
Study Association
This article is part of the thesis of master submitted by Valéria Sales do Valle, from Universidade Castelo Branco.
References
1. Santos RD, Giannini SD, Maranhão RC, Luz PL, Lima JC, Salgado Fº W, et al. Sociedade Brasileira de Cardiologia. III Diretrizes brasileiras sobre dislipidemias e diretriz de prevenção da aterosclerose do departamento de aterosclerose. Arq Bras Cardiol. 2001; 77 (supl. 3): 1-48.
2. Araújo F, Yamada AT, Araújo MVM, Latorre MRDO, Mansur AJ. Perfil lipídico de indivíduos sem cardiopatia com sobrepeso e obesidade. Arq Bras Cardiol. 2005; 84 (5): 405-9.
3. Church TS, Cheng CP, Earnest CE, Barlow LW, Gibbons EL, Blair SN. Exercise capacity and body composition as predictors of mortality among men with diabetes. Diabetes Care. 2004; 27 (1): 83-8.
4. Wessel TR, Arant CB, Olson MB, Johnson BD, Reis SE, Sharaf BL, et al. Relationship of physical fitness vs body mass index with coronary artery disease and cardiovascular events in woman. JAMA. 2004; 292 (10): 1179-87.
5. Miller YD, Dunstan DW. The effectiveness of physical activity interventions for the treatment of overweight and obesity and type 2 diabetes. J Sci Med Sport. 2004; 7 (Suppl. 1): 52-9.
6. Amorim PR, Gomes TNP. Gasto energético na atividade física. Rio de Janeiro: Editora Shape; 2003.
7. Sharma AM. Effects of exercise on plasma lipoproteins. N Engl J Med. 2003; 348 (15): 1494-6.
8. Rique ABR, Soares EA, Meirelles CM. Nutrição e exercício na prevenção e controle das doenças cardiovasculares. Rev Bras Med Esporte. 2002; 8 (6): 244-54.
9. Villalba CB, Gil DB. Manual: ciclo indoor avanzado. Madrid: Paitotribo; 2006. (Aerobic/Fitness).
10. Kang J, Chaloupka EC, Mastrangelo M, Hoffman JR, Ratamess NA, O’connor E. Metabolic and perceptual responses during spinning® cycle exercise. Med Sci Sports Exerc. 2005; 37 (5): 853-9.
11. Mello DB. Ciclismo indoor. Rio de Janeiro: Ed. Sprint; 2004.
12. American College of Sports Medicine - ACSM. Diretrizes do ACMS para os testes de esforço e sua prescrição. 6ª ed. Rio de Janeiro: Guanabara Koogan; 2003.
13. Brasil. Resolução CNS 196/96. Diretrizes e normas regulamentadoras de pesquisas envolvendo seres humanos. Brasília: CNS, 1996.
14. Lohman TG, Roche AF, Martorell R. In. Anthropometric standardization reference manual. Champaign: Human Kinetics Books; 1988.
15. Ardern CI, Janssen I, Ross R, Katzmarzyk P. Development of health-related waist circumference threshold within BMI categories. Obes Res. 2004; 12 (7): 1094-103.
16. Pollock ML, Wilmore JH. Exercícios na saúde e na doença: avaliação e prescrição para prevenção e reabilitação. 2ª ed. Filadélfia: MEDSI; 1993.
17. Inbar O, Oren A, Scheinowitz M, Rotstein A, Dlin R, Casaburi R. Normal
cardiopulmonary responses during incremental exercise in 20- to 70- yr-old men. Med Sci Sports Exerc. 1994; 26 (5): 538-46.
18. Triola MF. Introdução à estatística. 7ª ed. Rio de Janeiro: Livros Técnicos e Científicos Editora; 1999.
19. Barnes JT, Elder CL, Craig L, Pujol TJ. Overweight and obese adults: pathology and treatment. Strength and Conditioning Journal. 2004; 26 (3): 10-76.
20. Jakicie JM, Gallgher KI. Exercise consideration for the sedentary overweight. Exercise Sports Science Revision. 2003; 31 (2): 91-5.
21. Slents CA, Duscha BD, Johnson JL, Ketchum K, Aiken LB, Samsa GP, et al. Effects of the amount of exercise on body weight, body composition, and measures of central obesity: STRRIDE--a randomized controlled study. Arch Intern Med. 2004; 164 (1): 31-9.
22. Stiegler P, Cunliffe A. The role of diet and exercise for the maintenance of fat-free mass and resting metabolic rate during weight loss. Sports Med. 2006; 36 (3): 239-62.
23. American College Of Sports Medicine position stand. Appropriate intervention strategies for weight loss and prevention of weight regain for adults. Med Sci Sports Exerc. 2001; 33 (12): 2145-56.
24. Monteiro RCA, Riether PTA, Burini RC. Efeito de um programa misto de intervenção nutricional e exercício físico sobre a composição corporal e os hábitos alimentares de mulheres obesas em climatério. Rev Nutr. 2004; 17 (4): 479-89.
25. Kraemer WJ, Volek JS, Clark KL, Gordon SE, Incledon T, Puhl SM, et al. Physiological adaptations to a weight-loss dietary regimen and exercise programs in women. J Appl Physiol. 1997; 83 (1): 270-9.
26. Wilborn C, Beckham J, Campbell B, Harvey T, Galbreath M, La Bounty P, et al. Obesity: prevalence, theories, medical consequences, management, and research directions. J Int Soc Sports Nutr. 2005; 2 (2): 4-31.
27. Coelho VG, Caetano IF, Liberatore RDR Jr, Cordeiro JA, Souza DRS. Perfil lipídico e fatores de risco para doenças cardiovasculares em estudantes de medicina. Arq Bras Cardiol. 2005; 85 (1): 57-62.
28. Hardman AE. Physical activity, obesity and blood lipids. Int J Obes. 1999; 23 (3): 64-71.
29. Leon AS, Sanchez OA. Response of blood lipids to exercise training alone or combined with dietary intervention. Med Sci Sports Exerc. 2001; 33 (6): S502- S515.
30. Katzmarzyk PT, Church TS, Blair SN. Cardiorespiratory fitness attenuates the effects of the metabolic syndrome on all-cause and cardiovascular disease mortality in men. Arch Intern Med. 2004; 164: 1092-7.
31. Bassuk SS, Manson JE. Physical activity and cardiovascular disease prevention in women: how much is good enough? Exerc Sport Sci Rev. 2003; 31 (4): 176-81.
33. Durstine JL, Moore GE. ACSM’s exercise management for persons with chronic diseases and disabilities. 2nd ed. Champaign, IL: Human Kinetics; 2003. p. 142-8.
34. Wood RJ, Volek JS, Liu Y, Shachter NS, Contois JH, Fernandez ML. Carbohydrate restriction alters lipoprotein metabolism by modifying VLDL, LDL, and HDL subfraction distribution and size in overweight men. J Nutr. 2006; 136 (2): 384-9.
35. Stefanick ML, Mackey S, Sheehan M, Ellsworth N, Askell WL, Wood P. Effects of diet and exercise in men and postmenopausal women with low levels of HDL cholesterol and high levels of LDL cholesterol. N Engl J Med. 1998; 339 (1): 12-20.