DOI: 10.4025/jphyseduc.v29i1.2935
Original Article
NUTRITIONAL STATUS AND CARDIOMETABOLIC RISK IN WOMEN: RELATIONSHIP WITH USUAL AND NON-USUAL COMPONENTS OF BODY
COMPOSITION
ESTADO NUTRICIONAL E RISCO CARDIOMETABÓLICO EM MULHERES: RELAÇÃO COM COMPONENTES USUAIS E NÃO USUAIS DA COMPOSIÇÃO CORPORAL
Rafaela Pilegi Dada1, Braulio Henrique Magnani Branco2,Caio Machado de Oliveira Terra1,3, Samara
Pereira Brito Lazarin1,2, Luzia Jeager Hintze1,4and Nelson Nardo Junior1
1Universidade Estadual de Maringá, Maringá-PR, Brasil.
²Centro Universitário de Maringá, Maringá-PR, Brasil.
3Universidade Federal de São Paulo-BS, Santos-SP, Brasil. 4School of Human Kinetics, University of Ottawa, Ontario, Canada.
RESUMO
Os componentes da composição corporal usuais: massa magra (MM) e massa gorda (MG) e não-usuais: relação gordura-massa magra (RGM), índice de gordura-massa magra (IMM), índice de gordura-massa gorda (IMG) são preditores de alterações em parâmetros da síndrome metabólica (SM) de acordo com o estado nutricional. Nesse aspecto, o objetivo do presente estudo foi investigar e discriminar a sensibilidade dos componentes não usuais como indicadores de risco para SM em mulheres adultas de acordo com o estado nutricional. O estudo incluiu 338 mulheres de 25 a 74 anos de idade. Avaliou-se a MM, MG relativa e absoluta, IMM, o IMG e a RGM, circunferência de cintura (CC), pressão arterial sistólica (PAS), pressão arterial diastólica (PAD). Constataram-se diferenças significativas entre os componentes usuais e não usuais da composição corporal para a CC, PAD e glicemia em jejum nos diferentes grupos: eutrófico, sobrepeso, obeso I, II e III; detectaram-se correlações entre os componentes da composição corporal quando comparados aos triglicerídeos e lipoproteínas de alta densidade (p<0,05). Além disso, a análise de curva ROC indicou que o IMM e o IMG podem discriminar os componentes relacionados à SM de maneira semelhante ao IMC. Conclui-se, que tanto os componentes usuais e não usuais da composição corporal podem detectar riscos associados ao sobrepeso e obesidade das mulheres analisadas nessa pesquisa.
Palavras-chave: Obesidade. Síndrome metabólica. Composição corporal. Mulher.
Introduction
Obesity has grown exponentially in Brazil, the United States of America and several countries in the world, becoming a serious public health issue worldwide (pandemic)1. In this sense, a very widespread indicator of nutritional status is body mass index (BMI), which is used worldwide to stratify people’s nutritional status, as well as to identify risks associated with obesity1,2.
ABSTRACT
The usual parameters of body composition such as lean body mass (LM) and fat mass (FM) and the non-usual fat mass-lean ratio (FLMR), lean mass index (LMI), fat mass index (FMI) can potentially identify metabolic syndrome (MS) according to nutritional status. Accordingly, the present study aims to evaluate and discriminate LM, FM, FLMR, LMI, FMI and MS variables in women according to their nutritional status. A total of 338 women aged between 25 and 74 years were included in the study. LM, relative and absolute FM, FMI, LMI and FLMR, waist circumference (WC), systolic blood pressure (SBP), diastolic blood pressure (DBP) were measured. Results have shown differences in the usual and non-usual body composition components for the WC, SBP and fasting glycemia among the different groups: eutrophic, overweight, obese I, II and III. In addition, correlations were noted between the components of body composition when compared to triglycerides and high-density lipoproteins (p <0.05). The ROC curve analysis demonstrated that LMI and FMI are able to detect MS in women in a similar way that IMC does. In conclusion, non-usual components of body composition might be an alternative way to detect MS in women, suggesting that they should be included as potential risks to develop MS. Finally, it is suggested the adoption of the non-usual components in addition with the traditional parameters in oder to diagnose the risk for MS in women.
Dada et al. Page 2 of 12
Approximately 54% of the world population has excessive body mass3. In addition, Ng et al1 report that the 10 countries with the highest prevalence of obesity are: the US, China, India, Russia, Brazil, Mexico, Egypt, Germany, Pakistan and Indonesia. Thus, more than 50% of the 671 million people assessed were classified as obese, and Brazilian women over 20 years old presented a prevalence of overweight of 58%, and 21% for obesity, respectively, at different levels of classification.
Among the consequences of obesity, the following dysfunctions can be listed: changes in systolic and diastolic blood pressure (SBP and DBP), increased risk of developing type 2 diabetes, changes in serum levels of triacylglycerols (TG) and lipoproteins (biochemical markers associated with increased cardiovascular risk), which may also cause states associated with metabolic syndrome2,4.
Another effect of excessive body mass is the accumulation of body fat. Studies in general have used absolute values of fat body mass (FBM), body fat percentage (F%), and lean body mass (LBM) to verify the distribution of such components5,6. In this sense, Vanitallie et al.7 proposed a potentially useful indicator to complement the assessment of nutritional status, which consists of adjusting LBM and FBM for height, since people with similar body mass and height values may have different body compositions. Additionally, the aforementioned research verified that fat mass index (FMI), calculated from FBM adjusted by height, is inversely related to resting metabolic rate (RMR), and the higher the FMI the lower the RMR.
On the other hand, Schutz et al.8 used the indicators proposed by Vanitallie7 and elaborated percentage cutoff points for men and women between 18 and 98 years of age, apparently healthy. In this aspect, it was verified that the aging process influences the increment of FMI. On the other hand, Prado et al.9 point out the importance of maintaining body homeostasis between LBM, understood as a capacity indicator, and FBM, a load indicator. In addition, the same authors suggest that the ratio between load and capacity (FBM/LBM) can provide values indicative of the magnitude of cardiometabolic risks.
In this way, considering the aspects listed, it was observed that studies involving women over 25 years of age are still scarce in the national and international scientific literature regarding the “new parameters for measuring body composition”, as well as for possible correlations with cardiometabolic risk. Therefore, the objective of the present article was to investigate and discriminate the sensitivity of lean-to-fat ratio (LFR), LMI and FMI as indicators of cardiometabolic risk for MS in adult women, according to nutritional status.
Methods
This study is characterized as a descriptive research with ex post facto design and quantitative approach. The descriptive research was conducted based on a past event, using descriptive methods in which variables were explored10.
All participants signed a free and informed consent form that was approved by the local ethics committee of the State University of Maringá (UEM) under legal opinion 412/2008, in accordance with the Helsinki declaration.
Participants
Nutritional Status and Cardiometabolic Risk in Women: Correlations with Usual and Unusual Components... Page 3 of 12
inclusion criteria, women aged ≥ 18 years old were accepted. To standardize measurements, the participants were instructed not to perform moderate or intense physical activity in the 24 hours preceding the assessments, neither ingest alcohol or caffeine-containing substances during this period. As for the exclusion criteria, no pregnant women and patients with pacemakers or prostheses were included.
Collection Procedures
The below figure displays the study’s methodological design.
Figure 1. Study design Source: The authors
Anthropometric and Clinical Assessment
The tests were conducted from 7:00 a.m. to 10:00 a.m. Body mass, height, waist circumference (WC) and blood pressure (BP) were measured. Height was measured by means of a stadiometer (Sanny®, São Paulo, Brazil), with a precision of 0.1 cm, attached to a wall. BMI was calculated dividing body mass in kilograms by height squared in meters. WC was measured using a measuring tape (WISO®, Santa Catarina, Brazil), with a measuring capacity of 2 meters and precision of 0.1 cm. BP was verified by means of a manual sphygmomanometer (Sanny®, São Paulo, Brazil), after 10 minutes of total rest, using the assessed participant’s right arm, as per the V Brazilian Guideline on Hypertension¹¹. All measurements were performed in controlled environment with temperature between 22º and 24ºC.
Body Composition
Body composition measurements were carried out using the bioimpedanciometry method, with the aid of an octapolar multi-frequency analyzer (InBody®, model 520 Body Composition Analyzers, South Korea), following recommendations proposed by Heyward12. The variables used were LBM and FBM. Based on these variables, the following body composition parameters were calculated: LMI, FMI and LFR. LMI [LBM (kg) / height (m)²] and FMI [FBM (kg) / height (m)²] were calculated according to recommendations proposed by Vanitallie et al7, and LFR [FBM (kg) / LBM kg)] was calculated in accordance with Prado’s study9.
Parameters Referring to Metabolic Syndrome
NCEP-ATP III4 classification parameters were used for central obesity (abdominal circumference > 88 cm), hypertriglyceridemia (TG ≥ 150 mg/dL), low values for HDL-c (< 50 mg/dL), high blood pressure (systolic blood pressure [SBP] ≥ 130 mmHg and/or diastolic blood pressure (DBP ≥85 mmHg and/or treatment for hypertension), hyperglycemia (fasting glycemia ≥ 110 mg/dL and/or treatment for type II diabetes).
Blood Analysis
Dada et al. Page 4 of 12
stored in Vacutainer®-type tubes containing sodium fluoride, with analysis by means of fluorinated plasma), triglycerides (TG) and high-density lipoproteins (HDL-c)], using Vacutainer®-type tubes with stacking gel, with serum-based analyses. The samples were centrifuged at 3,600 rpm for 11 minutes at room temperature and analyzed by Siemens Advika 1800 Chemistry Analyzer®. For blood analyses, Siemens® kits (Frimley, Camberley, Great Britain) were used. All analyses were performed by biochemists from a private laboratory, with ISO 9002 (International Organization for Standardization) certification.
Statistical Analyses
Data are presented by means and (±) standard deviation. Data normality was tested using the Kolmogorov-Smirnov test, and the Levene test was used to verify data homogeneity. Subsequently, a covariance analysis (ANCOVA) was performed using age as a one-way covariate, and when there was difference between the five experimental groups (eutrophic, overweight, obese I, obese II and obese III), the Bonferroni test was used as post-hoc. Sphericity was tested by Mauchly’s test, while the Greenhouse-Geisser correction was applied when necessary. In addition, to assess the magnitude of the differences observed, effect size was calculated by means of the eta squared, η2, and interpreted according to the classification proposed by Cohen13 < 0.2 [small], > 0.2 to < 0.8 [moderate] and > 0.8 [large]. Subsequently, Pearson’s correlation was applied between usual and unusual body composition components, as well as for cardiovascular risk indicators of MS. Correlations were interpreted as per to the classification by Hopkins et al.14: < 0.1 [trivial], > 0.1 to < 0.3 [small], 0.3 to 0.5 [moderate], 0.5 to 0.7 [high], 0.7 to 0.9 [very high] and 0.9 to 1.0 [near-perfect]. In addition, the Receiver Operating Characteristic (ROC) curve analysis was performed to assess the diagnostic capacity of the metabolic syndrome (under different aspects), by usual and unusual body composition components. The area under the ROC curve was used to assess and compare the performance of measures to discriminate the participants in two groups, with and without MS. In this circumstance, a measure perfectly discriminates women if the area under the curve is equal to 1. On the other hand, when an area under the curve is equal to 0.5, the measure does not allow group discrimination. Statistical analyses were done using SPSS®, version 20.0, and Statistica, version 12.0®. In addition, for ROC curve analyses, the statistical program R (R Development Core Team), version 3.3.1, was employed. A significance of 5% was set for all analyses conducted in the present study.
Results
Nutritional Status and Cardiometabolic Risk in Women: Correlations with Usual and Unusual Components... Page 5 of 12
Table 1. Body composition, anthropometry, biochemical and hemodynamic measures according to nutritional status in women
Body Composition (n=338) Eutrophic (n=73) Overweight (n=113) Obese I (n=86) Obese II (n=46) Obese III (n=20) Age (years)
Height (m)
43.52±11.62 1.6 ± 0.07
46.12±11.51 1.6 ± 0.06
47.72±11.03 1.6 ± 0.05
50.87±9.74 1.6 ± 0.05
48.20±8.04 1.6 ± 0.06 Body Mass (kg)* 58.4 ± 6.7 69.4 ± 6.1 82.1 ± 6.3 93.8 ± 6.5 108.3 ± 10.3
Body Mass Index (kg/m²)* 22.6 ± 1.6 27.4 ± 1.40 32.4 ± 1.5 37.3 ± 1.4 42.5 ± 2.0
Lean Body Mass (kg)@ 39.0 ± 4.6 41.3 ± 5.4 44.0 ± 4.3 45.5 ± 4.4 50.0 ± 4.7
Fat Body Mass (kg) * 17.3 ± 4.2 25.2 ± 4.3 35.5 ± 4.2 44.9 ± 5.5 55.3 ± 6.8
Body Fat Percentage (%)# 29.3 ± 5.0 36.1 ± 5.0 43.2 ± 3.8 48.1 ± 3.4 51.0 ± 2.8
Lean Mass Index (kg/m²)* 15.1 ± 1.2 16.3 ± 1.6 17.3 ± 1.0 18.1 ± 1.0 19.6 ± 1.1
Fat Mass Index (kg/m²)* 6.7 ± 1.5 9.9 ± 1.7 14.0 ± 1.6 17.9 ± 20.0 21.7 ± 1.9
Lean-to-Fat Ratio (kg/kg)* 0.4 ± 0.1 0.6 ± 0.1 0.8 ± 0.1 1.0 ± 0.1 1.1 ± 0.1
Metabolic Syndrome Components
(n=197) Eutrophic (n=35) Overweight (n=67) Obese I (n=46) Obese II (n=31) Obese III (n=18) Age (years)
Waist Circumference (cm)*
49.51±11.04 75.6 ± 7.5
47.37±11.36 82.2 ± 6.1
49.85±11.82 91.3 ± 6.1
53.6±8.07 102.6 ± 8.0
49.67±8.18 109.3 ± 12.9 Systolic Blood Pressure (mmHg) 121.4 ± 21.2 124.5 ± 17.0 130.3 ± 22.8 128.1 ± 15.7 135.9±16.0
Diastolic Blood Pressure
(mmHg)** 74.2 ± 11.07 76.9 ± 11.6 80.3 ± 11.7 77.0 ± 22.2 85.4 ± 11.3
Fasting Glycemia (mm/dL)º 89.0 ± 7.2 93.6 ± 16.0 98.8 ± 23.9 104.9 ± 36.0 117.2 ± 46.8
HDL-c (mm/dL)‡ 69.2 ± 12.1 65.6 ± 15.5 58.9 ± 14.9 62.0 ± 12.1 61.3 ± 15.3
Triglycerides (mm/dL) † 79.9 ± 28.0 85.3 ± 31.1 104.9 ± 60.2 117.0 ± 83.6 114.5 ± 39.6
MS Prevalence (%) - 3.0 6.5 22.6 33.3
Note: data presented by means and standard deviation. P<0.05. * = difference between all groups; # = difference between all groups, except for obese II and obese III groups; @ = difference between groups, except for obese I and obese II; º = difference between obese III and eutrophic and overweight groups; ‡ = difference between eutrophic group and obese
group I; † = difference between obese II group and eutrophic and overweight groups.
Dada et al. Page 6 of 12
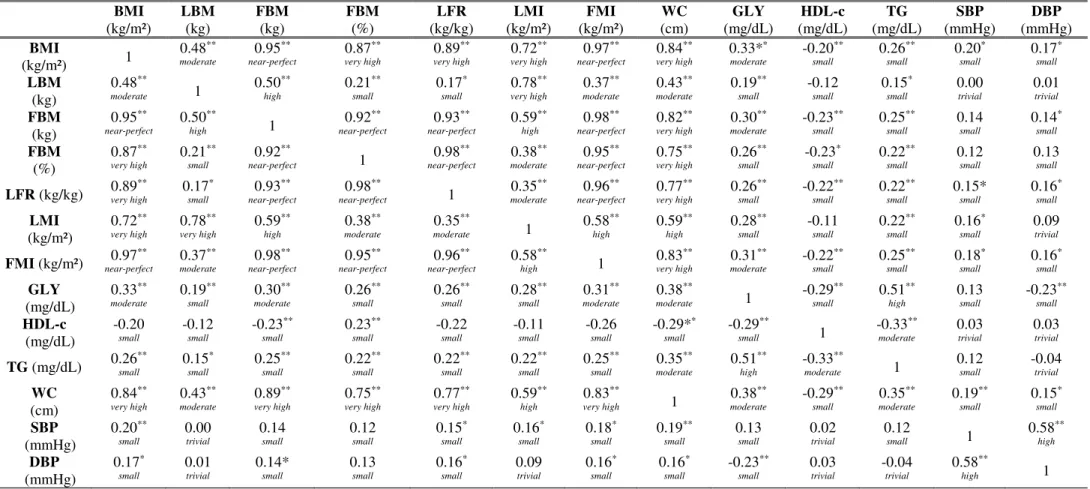
Table 2. Correlation between usual components (BMI, LBM, FBM – absolute and relative), unusual components (LFR, LMI and FMI) and MS components in adult women
BMI (kg/m²) LBM (kg) FBM (kg) FBM (%) LFR (kg/kg) LMI (kg/m²) FMI (kg/m²) WC (cm) GLY (mg/dL) HDL-c (mg/dL) TG (mg/dL) SBP (mmHg) DBP (mmHg) BMI
(kg/m²) 1
0.48** moderate 0.95** near-perfect 0.87** very high 0.89** very high 0.72** very high 0.97** near-perfect 0.84** very high 0.33** moderate -0.20** small 0.26** small 0.20* small 0.17* small LBM (kg) 0.48** moderate 1 0.50** high 0.21** small 0.17* small 0.78** very high 0.37** moderate 0.43** moderate 0.19** small -0.12 small 0.15* small 0.00 trivial 0.01 trivial FBM (kg) 0.95** near-perfect 0.50** high 1 0.92** near-perfect 0.93** near-perfect 0.59** high 0.98** near-perfect 0.82** very high 0.30** moderate -0.23** small 0.25** small 0.14 small 0.14* small FBM (%) 0.87** very high 0.21** small 0.92**
near-perfect 1
0.98** near-perfect 0.38** moderate 0.95** near-perfect 0.75** very high 0.26** small -0.23* small 0.22** small 0.12 small 0.13 small
LFR (kg/kg) 0.89
** very high 0.17* small 0.93** near-perfect 0.98** near-perfect 1 0.35** moderate 0.96** near-perfect 0.77** very high 0.26** small -0.22** small 0.22** small 0.15* small 0.16* small LMI (kg/m²) 0.72** very high 0.78** very high 0.59** high 0.38** moderate 0.35** moderate 1 0.58** high 0.59** high 0.28** small -0.11 small 0.22** small 0.16* small 0.09 trivial
FMI (kg/m²) 0.97
** near-perfect 0.37** moderate 0.98** near-perfect 0.95** near-perfect 0.96** near-perfect 0.58** high 1 0.83** very high 0.31** moderate -0.22** small 0.25** small 0.18* small 0.16* small GLY (mg/dL) 0.33** moderate 0.19** small 0.30** moderate 0.26** small 0.26** small 0.28** small 0.31** moderate 0.38** moderate 1 -0.29** small 0.51** high 0.13 small -0.23** small HDL-c (mg/dL) -0.20 small -0.12 small -0.23** small 0.23** small -0.22 small -0.11 small -0.26 small -0.29** small -0.29** small 1 -0.33** moderate 0.03 trivial 0.03 trivial
TG (mg/dL) 0.26
** small 0.15* small 0.25** small 0.22** small 0.22** small 0.22** small 0.25** small 0.35** moderate 0.51** high -0.33** moderate 1 0.12 small -0.04 trivial WC (cm) 0.84** very high 0.43** moderate 0.89** very high 0.75** very high 0.77** very high 0.59** high 0.83**
very high 1
0.38** moderate -0.29** small 0.35** moderate 0.19** small 0.15* small SBP (mmHg) 0.20** small 0.00 trivial 0.14 small 0.12 small 0.15* small 0.16* small 0.18* small 0.19** small 0.13 small 0.02 trivial 0.12 small 1 0.58** high DBP (mmHg) 0.17* small 0.01 trivial 0.14* small 0.13 small 0.16* small 0.09 trivial 0.16* small 0.16* small -0.23** small 0.03 trivial -0.04 trivial 0.58** high 1
Note: BMI = body mass index; LBM = lean body mass; FBM = fat body mass; LFR = lean-to-fat ratio; LMI = lean mass index; FMI = fat mass index; GLY = fasting glycemia; HDL-c = high-density lipoproteins; TG = triglycerides; WC = Waist Circumference = SBP = Systolic Blood Pressure; DBP = Diastolic Blood Pressure; ** = P < 0.01.
Estado nutricional e risco cardiometabólico em mulheres: relação com componentes usuais e não usuais... Página 7 de 12
Figure 2 shows the relationship between sensitivity and specificity for different cutoff points of body composition measures for diagnosis of different metabolic syndrome components, presented in the ROC curves. It is noted that, for systolic and diastolic blood pressure, and HDL-c, regardless of the composition measure assessed, the ROC curves are close to the bisector, indicating that such measures have a low discrimination capacity for these components. Also, it is verified that, in general, lean body mass shows a lower capacity of discrimination, presenting low values of sensitivity and specificity.
Figure 2. ROC curves to assess the diagnosis of different metabolic syndrome components by body composition parameters
Source: The authors
Dada et al. Página 8 de 12
Table 3. Area under the ROC curve for assessment of the diagnosis of different metabolic syndrome components by body composition parameters
WC (cm)
SBP (mmHg)
DBP (mmHg)
GLY (mm/dL)
HDL-c (mm/dL)
TG
(mm/dL) MS Body Mass Index (kg/m²) 0.92 0.69 0.62 0.78 0.63 0.77 0.81
Lean body mass (kg) 0.70 0.53 0.53 0.64 0.61 0.69 0.70 Fat body mass (kg) 0.92 0.65 0.62 0.76 0.63 0.76 0.80 Body mass percentage (%) 0.89 0.65 0.63 0.74 0.59 0.73 0.76 Lean mass index (kg/m²) 0.82 0.67 0.58 0.76 0.66 0.76 0.81 Fat mass index (kg/m²) 0.92 0.67 0.62 0.77 0.62 0.76 0.80 Lean-to-fat ratio (kg /kg) 0.88 0.66 0.62 0.74 0.59 0.72 0.76 Note: WC=Waist Circumference; SBP: Systolic Blood Pressure; DBP: Diastolic Blood Pressure; GLY: fasting glycemia; HDL-c=TG = triglycerides; MS=metabolic syndrome
Source: The authors
Finally, Table 4 displays the cutoff values of body composition parameters that maximize the sum of sensitivity and specificity, and, consequently, minimize the discrimination error between different metabolic syndrome components.
Table 4. Optimum cutoff points for diagnosis of different metabolic syndrome components by body composition parameters
WC (cm)
SBP (mmHg)
DBP (mmHg)
GLY (mm/dL)
HDL-c (mm/dL)
TG
(mm/dL) MS Body Mass Index (kg/m²) 28.00 29.00 29.00 33.00 28.00 33.00 34.00
Lean body mass (kg) 45.00 39.00 49.00 47.00 47.00 44.00 43.00 Fat body mass (kg) 29.00 26.00 28.00 37.00 26.00 37.00 37.00 Body fat percentage (%) 38.00 41.00 43.00 46.00 35.00 40.00 46.00 Lean mass index (kg/m²) 17.02 16.62 16.94 18.33 16.71 18.33 18.33 Fat mass index (kg/m²) 11.92 10.22 12.70 13.06 10.11 14.48 14.48 Lean-to-fat ratio (kg/kg) 0.65 0.73 0.85 0.94 0.58 0.73 1.05 Note: WC = waist circumference; SBP = systolic blood pressure; PAD = diastolic blood pressure; GLY = fasting glycemia; HDL-c = TG = triglycerides; MS = metabolic syndrome.
Source: The authors
Discussion
The objective of the present study was to assess and discriminate LFR, LMI and FMI with MS components in adult women according to nutritional status. In this aspect, the findings indicate that an increased nutritional status (overweight degree) promotes changes in usual and unusual body composition parameters, as well as in MS components.
The body mass variable differed between the five groups. In this sense, a difference in the BMI classification was detected between groups and can be considered as a worldwide-known predictor for excessive body mass, being used to identify nutritional status in population studies15. This study indicates that, as the nutritional status increases, changes in anthropometric, hemodynamic, body composition values, as well as biochemical markers are observed.
According to researches16,17, WC has been proved to be an indicator of mortality in the general population. From this perspective, these changes can harm one’s health, that is, cause non-communicable chronic diseases that are responsible for raising morbimortalities all around the world.
Estado nutricional e risco cardiometabólico em mulheres: relação com componentes usuais e não usuais... Página 9 de 12
information about body compartments, regardless of height, while LFR is a predictor for sarcopenic obesity and increased cardiometabolic risk, which are present when individuals have excessive body fat combined with loss of LBM9,18.
In addition, it is worth highlighting that, as body mass increases, there is also an increase in FBM, but in a greater proportion than LBM. This correlation results from diet composition and physical inactivity, which overload the metabolism and raises cardiometabolic risks9. In this aspect, as observed in the findings of the present study, as the nutritional status changes (eutrophic, overweight, obesity I, II and III), there is an increase in LFR (kg/kg) (eutrophic: 0.42, overweight: 0.62; obese I: 0.88; obese II: 1.0; and obese III: 1.1, respectively). Despite this, there is evidence that the association is not so direct, as shown by the phenomenon known as “obesity paradox”, which presents reduced risk for some diseases/conditions, according to study by Aparicio et al19.
Other researchers20 also verified that FMI increases when BMI is high, and that said index can quantify deficiency or excess of FBM. FMI is related to body fat mass in the obese population, which corroborates with the results of the present study. In addition, another study21 identified similar results in women subdivided by nutritional status. Thus, it is suggested that as BMI values decrease, unusual indexes also regress, and, therefore, they sustain that FMI is a complementary measure for obesity7. In addition, our study found a near-perfect correlation between BMI x FMI (r=0.97). Such evidence reinforces the relevance of BMI to identify the nutritional status of people20.
Parallel to the studies cited, LFR and FMI are components that have been studied in women with polycystic ovary syndrome (PCOS)22. In this way, Ezeh22 evidenced associations with increased fat-to-lean ratio (FLR), presenting itself independently associated with differences in fasting insulin, HOMA-IR and β-HOMA% values between PCOS and control.
Of all MS components, changes in WC and SBP were the most prevalent, reaching 46.7% and 42.6% of the sample, respectively. In addition, hemodynamic parameters increase with senescence and changes in the nutritional status of people (underweight, eutrophic, overweight and obesity)23. From this perspective, Lavie et al16 report that obesity has negative effects on SBP and DBP, more specifically on venous return and artery calibration. Besides, it is noteworthy that recent studies have reported significant differences for anthropometric and hemodynamic variables, factors that exponentially increase the health risk of the population24,25.
For biochemical measurements, the prevalence of changes in fasting glycemia (10.7%), TG (8.6%) and HDL-c (13.7%) was identified in the obese groups, that is, values above reference levels (NCEP-ATP III)4. In this aspect, the data presented reinforce the raise of these markers being greater in obese individuals24,25. Such responses suggest that increased body fat, especially at the abdominal level, tends to cause changes in serum lipid variables and hypertriglyceridemia, which increase BP and decrease HDL-c26 concentrations.
Thus, the present study verified a growing curve for presence of MS according to nutritional status, being: 3.0% for overweight people, 6.5% for people with grade I obesity, 22.6% for people with grade II obesity, and 33.3% for people with grade III obesity, according to previous studies26-28.
Dada et al. Página 10 de 12
factors periodically, as well as the implementation of multi-professional programs to combat excessive body mass and reduce changes in cardiometabolic risk parameters24.
Finally, it is identified in the literature that fat percentage (low, normal and high) can identify changes in the values that compose MS and cardiovascular risk even in people with adequate BMI20,21. Therefore, the LMI and FMI equation calls for more in-depth studies, considering that this is a potential epidemiological and clinical tool to define and monitor obesity-related aspects. Moreover, despite the contributions, the present study has limitations as well: a) the sample was recruited by convenience, including participants that had availability and interest in participating in the research; b) the age group was relatively broad; c) the sample was composed of women only.
Conclusions
With these results, it was possible to verify that, according to nutritional status, changes in usual and unusual body composition components are observed in the study population and also in MS components. The analysis of the discriminatory power of usual and unusual body composition components through the ROC curve allows indicating them as moderate predictors of MS components.
Based on the results presented, other studies should assess the usefulness of these (unusual) components together with traditional parameters, aiming at the verification of their predictive value.
References
1. Ng M, Fleming T, Robinson M, Thomson B, Graetz N, Margono C, et al. Global, regional, and national prevalence of overweight and obesity in children and adults during 1980-2013: a systematic analysis for the Global Burden of Disease Study 2013. Lancet 2014;384(9945):766-781. doi: 10.1016/S0140-6736(14)60460-8. doi: 10.1016/S0140-10.1016/S0140-6736(14)60460-8.
2. World Health Organization. [Internet]. Media Centre of Obesity and overweight. Geneva, 2018. [acesso em 15 abril 2018]. Disponível em: http://www.who.int/mediacentre/factsheets/fs311/en/
3. Yatsuya H, Li Y, Hilawe EH, Ota A, Wang C, Chiang C, et al. Global trend in overweight and obesity and its association with cardiovascular disease incidence. Circ J 2014;78(12):2807-2818.
4. Diretriz Brasileira de Diagnóstico e Tratamento da Síndrome Metabólica I. Arq. Bras. Cardiol 2005;suppl 1(84):8-26. http://dx.doi.org/10.1590/S0066-782X2005000700001.
5. Pagan BGM. Influência da cirurgia bariátrica sobre a composição corporal de indivíduos adultos. [Dissertação de Mestrado em Educação Física]. Maringá: Universidade Estadual de Maringá. Programa de Pós-Graduação Associado em Educação Física UEM/UEL; 2012.
6. Hintze LJ. Influência do nível de atividade física na composição corporal e gasto energético em pacientes submetidos à cirurgia bariátrica. Maringá. [Dissertação de Mestrado em Educação Física] Maringá: Universidade Estadual de Maringá. Programa de Pós-Graduação Associado em Educação Física UEM/UEL; 2012.
7. Vanitallie TB, Yang MU, Heymsfield SB, Funk RC, Boileau RA. Height-normalized indices of the body's fat-free mass and fat mass: potentially useful indicators of nutritional status. Am J Clin Nutr 1990;52(6):953-959.
8. Schutz Y, Kyle UUG, Pichard C. Fat-free mass index and fat mass index percentiles in Caucasians aged 18-98 y. Int J Obes Relat Metab Disord 2002;26(7):953-60.
9. Prado CM, Wells JC, Smith SR, Stephan BC, Siervo M. Sarcopenic obesity: A Critical appraisal of the current evidence. Clin Nutr 2012;31(5):583-601. doi: 10.1016/j.clnu.2012.06.010.
10. Thomson JR, Nelson JK, Silverman SJ. Research methods in physical activity. Champaing – IL: Human Kinetics, 2005.
11. V Diretrizes Brasileiras de Hipertensão Arterial. Arq Bras Cardiol 2007;89(3):e24-e78.
Estado nutricional e risco cardiometabólico em mulheres: relação com componentes usuais e não usuais... Página 11 de 12
14. Hopkins, W, Marshall SW, Batterham AM, Hanin J. Progressive statistics for studies in sports medicine and exercise science. Med Sci Sports Exerc 2009;41(1):3-13. doi: 10.1249/MSS.0b013e31818cb278.
15. Brasil. Ministério da Saúde. Plano de ações estratégicas para o enfrentamento das doenças crônicas não transmissíveis (DCNT) no Brasil, 2011-2022. Brasília: Ministério da Saúde 2011. [acesso em 20 abril 2015]. Disponível em: http://bvsms.saude.gov.br/bvs/publicacoes/plano_acoes_enfrent_dcnt_2011.pdf
16. Lavie CJ, de Schutter A, Parto P, Jahangir E, Kokkinos P, Ortega FB, et al. Obesity and Prevalence of Cardiovascular Diseases and Prognosis-The Obesity Paradox Updated. Prog Cardiovasc Dis 2016;58(5):537-547. doi: 10.1016/j.pcad.2016.01.008.
17. Devers MC, Campbell S, Simmons D. Influence of age on the prevalence and components of the metabolic syndrome and the association with cardiovascular disease. BMJ Open Diabetes Res Care 2016;4(1): e000195. doi: 10.1136/bmjdrc-2016-000195.
18. Li Z, Heber D. Sarcopenic obesity in the elderly and strategies for weight management. Nutr Rev 2012;70(1):57-64. doi: 10.1111/j.1753-4887.2011.00453.x. 1.
19. Aparicio HJ, Himali JJ, Beiser AS, Davis‐Plourde KL, Vasan RS, Kase, et al. Overweight, Obesity, and Survival After Stroke in the Framingham Heart Study. J Am Heart Assoc 2017;6(6):e004721. doi: 10.1161/JAHA.116.004721
20. Frankenfield DC, Rowe WA, Cooney RN, Smith JS, Becker D. Limits of body mass index to detect obesity and predict body composition. Nutrition 2001;17(1):26-30.
21. Kyle UG, Schutz Y, Dupertuis YM, Pichard C. Body composition interpretation. Contributions of the fat-free mass index and the body fat mass index. Nutrition 2003;19(7):597-604.
22. Ezeh U, Pall M, Mathur R, Azziz R. Association of fat to lean mass ratio with metabolic dysfunction in women with polycystic ovary syndrome. Hum Reprod 2014;29(7):1508-1517.
23. Sperling LS, Mechanick JI, Neeland IJ, Herrick CJ, Després JP, Ndumele CE, et al. The Cardio Metabolic Health Alliance: Working Toward a New Care Model for the Metabolic Syndrome. J Am Coll Cardiol 2015;66(9):1050-1067. doi: 10.1016/j.jacc.2015.06.1328.
24. Wall-Medrano A, Ramos-Jiménez A, Hernandez-Torres RP, Villalobos-Molina R, Tapia-Pancardo DC, Jiménez-Flores JR, et al. Cardiometabolic risk in young adults from northern Mexico: Revisiting body mass index and waist-circumference as predictors. BMC public health 2016;(16):236 doi: 10.1186/s12889-016-2896-1.
25. Teixeira AC, Oliveira CDL, de Paiva MJN, dos Santos MESM, Rodrigues MAH, Petri-Nahas E, et al. Prevalência de síndrome metabólica em mulheres acima de 40 anos de Divinópolis-MG. R Enferm Cent O Min 2015;3(4):1349-1358. http://dx.doi.org/10.19175/recom.v0i0.469
26. Carvalho EV, Costa VVL, de Souza Araújo M, Martens IBG, Sá NNB, da Silva RA. Correlação entre o estado nutricional e o risco coronariano de adultos atendidos em uma Ação educativa em Belém Pará. RBONE 2016;10(55):40-49.
27. Ezeh U, Pall M, Mathur R, Dey D, Berman D, Chen IY, et al. Effects of endogenous androgens and abdominal fat distribution on the interrelationship between insulin and non-insulin-mediated glucose uptake in females. J Clin Endocrinol Metab 2013;98(4):1541-1548. doi: 10.1210/jc.2012-2937.
28. Kopelman PG. Obesity as a medical problem. Nature 2000;404(6778):635-643. doi:10.1038/35007508 29. Martins JC, Alvarez B R, Binatti MM, Mazon J. Prevalência de síndrome metabólica na população adulta
cadastrada a partir de 2010 em três comunidades da cidade de Araranguá/SC. Revista do Programa de Residência Multiprofissional em Atenção Básica/Saúde da Família 2014;2(1):s/p.
30. Romero-Corral A, Somers VK, Sierra-Johnson J, Korenfeld Y, Boarin S, Korinek J, et al. Normal weight obesity: a risk factor for cardiometabolic dysregulation and cardiovascular mortality. Eur Heart J 2009;31(6):737-746. doi: 10.1093/eurheartj/ehp487.
Acknowledgements: To the Multi-Professional Center for Studies on Obesity (NEMO), Health Ministry/FINEP and Cesumar Institute of Science, Technology and Innovation (ICETI).
Received on Mar, 17, 2017. Reviewed on May, 21, 2017. Accepted on Aug, 06, 2017.