NATÁLIA KRISH DE PAIVA SOUZA
EVALUATION OF METHODS FOR ANALYSES OF AMMONIA NITROGEN IN RUMEN FLUID AND CHROMIUM IN CATTLE FECES
VIÇOSA
MINAS GERAIS – BRASIL 2012
Ficha catalográfica preparada pela Seção de Catalogação e Classificação da Biblioteca Central da UFV
T
Souza, Natália Krish de Paiva, 1987-
S729e Evaluation of methods for analyses of ammonia nitrogen in 2012 rumen fluid and chromium in cattle feces / Natália Krish de
Paiva Souza. – Viçosa, MG, 2012. ix, 34f. : il. ; 29cm.
Orientador: Edenio Detmann.
Dissertação (mestrado) - Universidade Federal de Viçosa. Inclui bibliografia.
1. Ruminante - Nutrição. 2. Alimentos - Análise. 3. Rúmen - Fermentação. 4. Digestibilidade. 5. Espectrofotometria.
6. Colorimetria. 7. Nitrogênio na nutrição animal. I. Universidade Federal de Viçosa. II. Título.
NATÁLIA KRISH DE PAIVA SOUZA
EVALUATION OF METHODS FOR ANALYSES OF AMMONIA NITROGEN IN RUMEN FLUID AND CHROMIUM IN CATTLE FECES
APROVADA: 15 de fevereiro de 2012.
________________________________ _______________________________
Augusto César de Queiroz Cristina Mattos Veloso (Coorientador)
________________________________
Kelly da Silva Coutinho Detmann
_______________________________
Edenio Detmann (Orientador)
ii Dedico à Deus, que me permitiu chegar até aqui...
Aos meus pais, Fernando e Elena, por todo amor, dedicação e apoio...
Aos meus irmãos Leo e Nanda, pelos cuidados, amor fraterno e amizade...
Aos meus sobrinhos Bryan, Gabriel e Sara, que são sempre sinônimos de alegria em minha vida...
iii AGRADECIMENTOS
À Deus e Nossa Senhora, por representarem apoio e esperança em minha vida. À Universidade Federal de Viçosa e ao Departamento de Zootecnia, por tornarem possível a conquista e realização desse projeto.
Ao Conselho Nacional de Desenvolvimento Científico e Tecnológico (CNPq), pelo apoio financeiro e pela concessão da bolsa de estudos.
Ao INCT-Ciência Animal e à FAPEMIG (Programa Pesquisador Mineiro), pelo apoio financeiro para realização deste trabalho.
À minha família querida, meus pais, irmãos, sobrinhos e marido, que são em minha vida: felicidade, apoio e amor.
Às minhas amigas e irmãs de república Carolina (Cheron), Daiany (Day), Anelisa (Isa) e Márcia (Marceleta), que foram a melhor família que eu poderia ter encontrado em Viçosa.
À Jéssika, pela amizade e por me acolher em sua casa quando minha república se desfez.
A todos os meus queridos amigos da turma de Zootecnia/2006, pessoas maravilhosas que compartilharam comigo momentos de alegrias, tristezas, estudos e festas, amigos que guardarei sempre em minhas lembranças.
A todos os colegas da pós-graduação que estiveram junto comigo durante o mestrado, em especial ao Luiz Fernando (Quick), Felipe P, Tati, Camila, Jéssika, Erick, Luana, Timão, Erika, Rosana, Amanda, Pedro, Marcus e Marjorrie.
À Carol e Day, que, mesmo à distância, nunca deixaram de ser grandes amigas. Ao Zé Augusto, que foi a primeira pessoa a me incentivar na pesquisa.
Ao professor Edenio pela orientação e ensinamentos.
À Viviane e à Cláudia, por terem cedido as amostras para a realização desse trabalho.
Aos funcionários do Laboratório de Nutrição Animal do DZO, em especial ao Fernando e ao Wellington, por toda ajuda,
Aos meus tios Tarcísio, Luiz, Marly e Leda, por todo apoio e carinho.
iv BIOGRAFIA
NATÁLIA KRISH DE PAIVA SOUZA, filha de Fernando Fernandes e Elena Queiroz de Assis Fernandes, nasceu em Conselheiro Lafaiete, Minas Gerais, em 10 de fevereiro de 1987.
Em maio de 2006, ingressou na Universidade Federal de Viçosa, no curso de Zootecnia, graduando-se em julho de 2010.
v SUMÁRIO
RESUMO vi
ABSTRACT viii
INTRODUCTION 1
REFERENCES 4
Evaluation of the ammonia concentration in rumen fluid using different analytical methods Abstract 5
Introduction 6
Material and Methods 7
Results 10
Discussion 11
Conclusions 16
References 17
Evaluation of chromium concentration in cattle feces using different techniques of acid digestion and spectrophotometric quantification Abstract 18
Introduction 19
Material and Methods 20
Results 25
Discussion 30
Conclusions 33
vi RESUMO
SOUZA, Natália Krish de Paiva, M.Sc., Universidade Federal de Viçosa, fevereiro de 2012. Avaliação de métodos para análise de nitrogênio amoniacal em fluido ruminal e de óxido crômico em amostras de fezes de bovinos. Orientador: Edenio Detmann. Coorientadores: Augusto César de Queiroz e Sebastião de Campos Valadares Filho.
Esta dissertação foi preparada com base em dois experimentos. No primeiro experimento objetivou-se avaliar a acurácia de dois métodos utilizados na quantificação da concentração de nitrogênio amoniacal (N-NH3) em fluido ruminal: reação
colorimétrica catalizada por indofenol (RCI) e destilação de Kjeldahl (DK). Cinco soluções-padrão contendo ácidos graxos voláteis, proteína verdadeira e concentrações conhecidas de amônia (0, 3, 6, 12, e 24 mg/dL de N-NH3) foram utilizadas para simular
o fluido ruminal. Diferentes razões (10:1; 7,5: 1; 5:1; 2,5:1; 1:1; 1:2,5; 1:5; 1:7,5 e 1:10) entre a solução de hidróxido de potássio (KOH, 2 mol/L) e as soluções-padrão foram avaliadas pela DK. A acurácia de cada método foi avaliada através do ajustamento de modelo de regressão linear simples das concentrações estimadas de N-NH3 sobre as
concentrações de N-NH3 nas soluções-padrão. Observou-se no método de DK que
houve liberação de N-NH3 em função da deaminação de proteína verdadeira do meio
(P<0,05), além de incompleta recuperação de N-NH3 (P<0,05), exceto para as razões de
7,5:1 e 5:1 de solução de KOH e soluções-padrão (P>0,05). As estimativas da concentração de N-NH3 obtidas pelo método de RCI foram acuradas (P>0.05). Após a
avaliação da acurácia, noventa e três amostras de fluido ruminal foram avaliadas pelos métodos de RCI e DK (utilizando-se a razão 5:1 de solução de KOH e amostra de fluido ruminal), assumindo-se que as estimativas obtidas pelo método de RCI seriam acuradas. Observou-se que as concentrações de N-NH3 obtidas pelos dois métodos foram
diferentes (P<0,05), mas fortemente correlacionadas (r = 0,9701). Assim, concluiu-se que as estimativas obtidas pela destilação de Kjeldahl utilizando-se a razão de 5:1 de solução de KOH e amostra de fluido ruminal podem ser ajustadas para que os vieses sejam evitados. Modelo para ajustar as concentrações de N-NH3 foi sugerido neste
viii ABSTRACT
SOUZA, Natália Krish de Paiva, M.Sc., Universidade Federal de Viçosa, February, 2012. Evaluation of methods for analyses of ammonia nitrogen in rumen fluid and chromium in cattle feces. Adviser: Edenio Detmann. Co-advisers: Augusto César de Queiroz and Sebastião de Campos Valadares Filho.
This dissertation was based on two different experiments. The first one was conducted to evaluate the accuracy of two different methods in measuring the ammonia nitrogen (N-NH3) concentration in rumen fluid: a catalyzed indophenol colorimetric reaction
(CICR) and the Kjeldahl distillation (KD). Five buffered standard solutions containing volatile fatty acids, true protein, and known ammonia concentrations (0, 3, 6, 12, and 24 N-NH3 mg/dL) were used to simulate rumen fluid. Different ratios (10:1, 7.5:1, 5:1,
2.5:1, 1:1, 1:2.5, 1:5, 1:7.5, and 1:10) of a potassium hydroxide solution (KOH, 2 mol/L) to standard solutions were evaluated by the KD method. The accuracy of each method was evaluated by adjusting a simple linear regression model of the estimated N-NH3 concentrations on the N-NH3 concentrations in the standard solutions. When the
KD method was used, N-NH3 was observed to be released from the deamination of true
protein (P<0.05), and an incomplete recovery of N-NH3 was observed (P<0.05), except
for 7.5:1 and 5:1 ratios of KOH solution to standard solutions (P>0.05). The estimates of the N-NH3 concentration obtained by the CICR method were found to be accurate
(P>0.05). After the accuracy evaluation, ninety-three samples of rumen fluid were evaluated by the CICR and KD methods (using the 5:1 ratio of KOH solution to rumen fluid sample), assuming that the CICR estimates would be accurate. The N-NH3
concentrations obtained by the two methods were different (P<0.05) but strongly correlated (r = 0.9701). Thus, it was conclude that the estimates obtained by the Kjeldahl distillation using a 5:1 ratio of KOH solution to rumen fluid sample can be adjusted to avoid biases. Furthermore, a model to adjust the N-NH3 concentrations is
1 Introduction
Several parameters have been suggested for evaluating the availability of the dietary nitrogenous compounds in the rumen. To date, the concentration of the ammonia nitrogen (N-NH3) has been used as a qualitative reference to understand the adequacy of
the rumen environment according to the microbial activity on fibrous carbohydrates (Detmann et al., 2009). This strategy is possibly associated with the fact that N-NH3 is
the preferred nitrogen source for the growth of fibrolytic microorganisms (Russell, 2002).
Thus, considering the relevance of N-NH3 in ruminant nutrition, the methods
used to evaluate its concentration in the ruminal fluid ought to provide accurate estimates.
Chaney & Marbach (1962) have proposed a method for N-NH3 evaluation in
biological fluids that is based on a catalyzed indophenol colorimetric reaction (CICR), and this method is intensely used in microbiological assays (e.g., Thomas & Russell, 2004). Alternatively, Fenner (1965) has established the theoretical basis for N-NH3
evaluation in rumen fluid by steam distillation in the presence of a potassium hydroxide solution. This basis has been adapted for use in the Kjeldahl distillation (KD) procedure, which has been used in several ruminant nutrition assays (e.g., Detmann et al., 2009; Souza et al., 2010). Nonetheless, no study has compared the accuracy of these methods in the estimation of N-NH3 contents in rumen fluid.
2 excretion of feedlot or grazing cattle. Such peculiarity is mainly based on facts that chromic oxide is easily added to the diet, and presents soft working and low cost evaluation methods (Detmann et al., 2004).
Among the ideal characteristics of a marker, it can be emphasized the capacity of marker to be completely recovered in feces (Owens & Hanson, 1992) or any segment of the digestive tract (Valente et al., 2011). The lack of this characteristic can result in biased estimates of digesta flow or fecal excretion. Although the recovery capacity is theoretically inherent to the marker (Detmann et al., 2007), indirect influences of the methods applied to estimate its concentration might result in apparent deviations of recovery (Valente et al., 2011).
Several methods to evaluate the chromium content in fecal samples can be found in the literature. Generally, such methods are based on the combination of two different techniques. The first one is used to eliminate the organic matter of the sample and let the chromium in a chemical form enable to be quantified by the second technique, which is based on the utilization of spectrophotometric quantification.
The first technique is carried out using acid digestion, which can or cannot be preceded by ashing at high temperatures. The acid digestion of samples changes the chromium valence from +3 (sesquioxide) to +6 (dichromate). From this, the element becomes easy to be quantified. In the digestion procedure several acids or acid combinations can be employed, being highlighted the digestions in a mixture of nitric and perchloric acids (Kimura & Miller, 1957), in a phosphoric acid solution (Willians et al., 1962), and in a mixture of sulfuric and perchloric acids (Fenton & Fenton, 1979).
3 such as silicon, aluminum and iron. Considering that type of chemical interference, it would become necessary the use of releasing agents to ensure the accuracy in the quantification procedures (Willians et al., 1962).
However, the accuracy of the procedure to estimate fecal chromium contents depends on the individual accuracy of both acid digestion and spectrophotometric quantification techniques. Therefore, studies involving the simultaneous evaluation of both techniques types are demanded.
Thus, the objectives of this dissertation were to evaluate the accuracy of N-NH3
4 References
CHANEY, A.L.; MARBACH, E.P. Modified reagents for determination of urea and ammonia. Clinical Chemistry, v.8, p.130-132, 1962.
DETMANN, E; VALADARES FILHO, S.C.; PAULINO, M.F. et al. Avaliação da técnica dos indicadores na estimação do consumo por ruminantes em pastejo. Cadernos Técnicos de Veterinária e Zootecnia, v.46, p.40-57, 2004.
DETMANN, E.; SOUZA, A.L.; GARCIA, R. et al. Avaliação do vício de “tempo
longo” de indicadores internos em ensaio de digestão com ruminantes. Arquivo Brasileiro de Medicina Veterinária e Zootecnia, v.59, p.182-188, 2007.
DETMANN, E., PAULINO, M.F.; MANTOVANI, H.C. et al. Parameterization of ruminal fibre degradation in low-quality tropical forage using Michaelis-Menten kinetics. Livestock Science,v.126, p.136-146, 2009.
FENNER, H. Method for determining total volatile bases in rumen fluid by steam distillation. Journal of Dairy Science,v.48, p.249-251, 1965.
FENTON, T.W.; FENTON, M. An improved procedure for the determination of chromic oxide in feed and feces. Canadian Journal of Animal Science, v.59, p.631-634, 1979.
KIMURA, F.T.; MILLER, V.L. Improved determination of chromic oxide in cow feed and feces. Journal of Agricultural and Food Chemistry, v.5, p. 216-216, 1957. OWENS, F.N.; HANSON, C.F. External and internal markers for appraising site and
extent of digestion in ruminants. Journal of Dairy Science, v.75, p.2605-2617, 1992.
RUSSELL, J.B. Rumen microbiology and its role in ruminant nutrition. Ithaca: James B. Russell, 2002. 119p.
SOUZA, M.A.; DETMANN, E.; PAULINO, M.F. et al. Intake, digestibility and rumen dynamics of neutral detergent fiber in cattle fed low-quality tropical forage and supplemented with nitrogen and/or starch.Tropical Animal Health and Production, v.42, p.1299-1310, 2010.
THOMAS, S.; RUSSELL, J.B. The effect of cellobiose, glucose, and cellulose on the survival of Fibrobacter succinogenes A3C cultures grown under ammonia limitation. Current Microbiology,v.48, p.219-223, 2004.
VALENTE, T.N.P.; DETMANN, E.; VALADARES FILHO, S.C. et al. In situ estimation of indigestible compounds contents in cattle feed and feces using bags made from different textiles. Revista Brasileira de Zootecnia, v.40, p.666-675, 2011.
5 Evaluation of the ammonia concentration in rumen fluid using different analytical
methods
ABSTRACT – It was evaluated the accuracy of two different methods in measuring the ammonia nitrogen (N-NH3) concentration in rumen fluid: a catalyzed indophenol
colorimetric reaction (CICR) and the Kjeldahl distillation (KD). Five buffered standard solutions containing volatile fatty acids, true protein, and known ammonia concentrations (0, 3, 6, 12, and 24 N-NH3 mg/dL) were used to simulate rumen fluid.
Different ratios (10:1, 7.5:1, 5:1, 2.5:1, 1:1, 1:2.5, 1:5, 1:7.5, and 1:10) of a potassium hydroxide solution (KOH, 2 mol/L) to standard solutions were evaluated by the KD method. The accuracy of each method was evaluated by adjusting a simple linear regression model of the estimated N-NH3 concentrations on the N-NH3 concentrations
in the standard solutions. When the KD method was used, N-NH3 was observed to be
released from the deamination of true protein (P<0.05), and an incomplete recovery of N-NH3 was observed (P<0.05), except for 7.5:1 and 5:1 ratios of KOH solution to
standard solutions (P>0.05). The estimates of the N-NH3 concentration obtained by the
CICR method were found to be accurate (P>0.05). After the accuracy evaluation, ninety-three samples of rumen fluid were evaluated by the CICR and KD methods (using the 5:1 ratio of KOH solution to rumen fluid sample), assuming that the CICR estimates would be accurate. The N-NH3 concentrations obtained by the two methods
were different (P<0.05) but strongly correlated (r = 0.9701). Thus, it was conclude that the estimates obtained by the Kjeldahl distillation using a 5:1 ratio of KOH solution to rumen fluid sample can be adjusted to avoid biases. Furthermore, a model to adjust the N-NH3 concentrations is suggested.
6 Introduction
Several parameters have been suggested for evaluating the availability of dietary nitrogenous compounds in the rumen. To date, the concentration of the ammonia nitrogen (N-NH3) has been used as a qualitative reference to understand the adequacy of
the rumen environment according to the microbial activity on fibrous carbohydrates (Detmann et al., 2009). This strategy is possibly associated with the fact that N-NH3 is
the preferred nitrogen source for the growth of fibrolytic microorganisms (Russell, 2002).
Thus, considering the relevance of N-NH3 in ruminant nutrition, the methods
used to evaluate its concentration in the ruminal fluid ought to provide accurate estimates.
Chaney & Marbach (1962) have proposed a method for N-NH3 evaluation in
biological fluids that is based on a catalyzed indophenol colorimetric reaction (CICR), and this method has been intensely used in microbiological assays (e.g., Thomas & Russell, 2004). Alternatively, Fenner (1965) has established the theoretical basis for N-NH3 evaluation in rumen fluid by steam distillation in the presence of a potassium
hydroxide solution. This basis was adapted for use in the Kjeldahl distillation (KD) procedure, which has been used in several ruminant nutrition assays (e.g., Detmann et al., 2009; Souza et al., 2010; Costa et al., 2011). Nonetheless, no study has compared the accuracy of these methods in the estimation of N-NH3 contents.
Therefore, the objective of this work was to evaluate the accuracy of N-NH3
7 Material and Methods
The experiment was conducted at the Animal Nutrition Laboratory of the Animal Science Department at the Universidade Federal de Viçosa in Viçosa, Brazil.
To evaluate the accuracy of the methods, five standard solutions containing different N-NH3 concentrations were used to evaluate the accuracy of the estimates
obtained from the two methods. Those five solutions were produced to simulate rumen fluid characteristics.
The basal solution was constituted by a buffer solution whose pH had previously been adjusted to 6.8 by flushing with CO2 (McDougall, 1949). Acetic acid
(Sigma-Aldrich 320099; 60 mmol/L), propionic acid (Sigma-(Sigma-Aldrich 402907; 30 mmol/L) and butyric acid (Sigma Aldrich B103500; 10 mmol/L) were added to the solution to represent the volatile fatty acids (VFA) present in the rumen fluid. Additionally, casein hydrolysate (Fluka 2209; 3 g/L) was added to simulate the true protein content of the rumen fluid, and thimerosal (Sigma 8784; 50 mg/L) was used to prevent microbial growth. The solution was divided into five aliquots, and known quantities of ammonium chloride (NH4Cl, PA, ACS, Vetec 113) were added to provide 0, 3, 6, 12, and 24 mg
N-NH3/dL.
The evaluation of the N-NH3 concentration by the CICR method was performed
8 To evaluate the N-NH3 concentration according the KD method, 5-mL aliquots
of standard solutions were poured into glass tubes that were coupled in a Kjeldahl distillator (Tecnal® TE 036/1). Potassium hydroxide solution (KOH, 2 mol/L; Fenner, 1965) was then added, and the material was distilled in a boric acid solution (40 g/L). The solution obtained from the distillation (approximately 100 mL) was titrated with hydrochloric acid (HCl; 0.005 N). Methyl red and bromocresol green were added to the boric acid solution and used as indicators. Different ratios of the KOH solution to the standard solutions were evaluated (10:1, 7.5:1, 5:1, 2.5:1, 1:1, 1:2.5, 1:5, 1:7.5, and 1:10)
The N-NH3 concentration was estimated as follows:
A f V
NH
N 3 0.005 14 100
(1),
where N-NH3 = the ammonia nitrogen concentration (mg/dL), V = the volume of
hydrochloric acid (mL), = the factor for the correction of the hydrochloric acid concentration obtained with a Na2CO3 solution (0.005 N), 14 = the atomic weight of
nitrogen, and A = the aliquot volume (mL).
Five replicates for each standard solution were evaluated by both the CICR method and KD method at different KOH:standard solution ratios.
After accuracy evaluation, a laboratorial assay was performed to compare the estimates obtained by the methods in rumen fluid samples.
Ninety-three rumen fluid samples were obtained from cattle under grazing conditions, receiving concentrate supplementation during 2008. Those samples were taken at different times during the day and filtered through three layers of cheesecloth. For each sample, a 100-mL aliquot was then separated, fixed with 2.5 mL H2SO4 (1:1)
9 After thawing, a 50-mL aliquot of each sample was poured into a centrifuge tube, 0.5 mL of a trichloroacetic acid solution (100 g/L) was added, and the sample was slowly stirred. The material was allowed to settle at room temperature for 30 minutes after which, the material was centrifuged at 1,000 g for 10 minutes. The supernatant
was analyzed in duplicate by the CICR method and KD method using the KOH:rumen fluid ratios of 5:1 and 1:10.
The accuracy of the N-NH3 concentrations obtained by the CICR and KD
methods was evaluated by adjusting a simple linear regression equation of estimated values (dependent variable) on the N-NH3 content in standard solutions (independent
variable); the statistical analysis was conducted under the null hypotheses below: 0
: 0
0
H (2a),
1 : 1
0
H (2b). The N-NH3 contents were considered to be accurate when both of the null
hypotheses were not rejected.
Additionally, the N-NH3 contents in the rumen fluid samples were compared by
adjusting a simple linear regression equation of the values estimated by the KD method (dependent variable) on the values estimated by the CICR method (independent variable). The statistical analysis was conducted under the null hypotheses expressed by equations (2a) and (2b). The estimates were considered to be similar if both of the null hypotheses were not rejected.
10 Results
With the KD method, the intercept estimates were observed to be different from zero (P<0.05) for all of the ratios of KOH solution to standard solutions (Table 1). Additionally, as the KOH proportion decreased, the estimates of the N-NH3
concentrations in the blank standard solution (0 mg N-NH3/dL) and the intercept
estimates also decreased (Table 2 and Figure 1).
For the results obtained using the KD method, the slopes were found to be different from one (P<0.05), except for at the 5:1 and 7.5:1 ratios of KOH solution to the standard solutions (Table 1 and Figure 1).
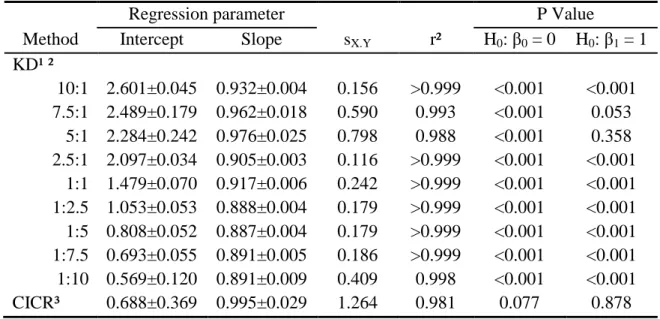
Table 1 - Estimates of the linear regression parameters for the relationship between the N-NH3 concentrations obtained by two methods and the N-NH3 concentrations
in the standard solutions
Regression parameter P Value
Method Intercept Slope sX.Y r² H0: β0 = 0 H0: β1 = 1
KD¹ ²
10:1 2.601±0.045 0.932±0.004 0.156 >0.999 <0.001 <0.001 7.5:1 2.489±0.179 0.962±0.018 0.590 0.993 <0.001 0.053
5:1 2.284±0.242 0.976±0.025 0.798 0.988 <0.001 0.358 2.5:1 2.097±0.034 0.905±0.003 0.116 >0.999 <0.001 <0.001
1:1 1.479±0.070 0.917±0.006 0.242 >0.999 <0.001 <0.001 1:2.5 1.053±0.053 0.888±0.004 0.179 >0.999 <0.001 <0.001 1:5 0.808±0.052 0.887±0.004 0.179 >0.999 <0.001 <0.001 1:7.5 0.693±0.055 0.891±0.005 0.186 >0.999 <0.001 <0.001 1:10 0.569±0.120 0.891±0.009 0.409 0.998 <0.001 <0.001 CICR³ 0.688±0.369 0.995±0.029 1.264 0.981 0.077 0.878
¹ Kjeldahl distillation. ² Using different ratios of the KOH solution to the standard solutions (mL/mL). ³ Catalyzed indophenol colorimetric reaction.
The estimates of the N-NH3 concentration obtained by the CICR method were
found to be accurate (P>0.05; Table 1).
When rumen fluid samples were evaluated using the KD method, N-NH3 was
11 The relationship between the N-NH3 concentrations obtained by the CICR and
KD (5:1 ratio) methods presented intercept that was different from zero and slope different from one (P<0.05). Therefore, the results obtained with these methods differed from each other (Figure 2).
Discussion
The quantity of the KOH solution used in the KD method must be sufficient to neutralize even extremely high concentrations of VFA; yet, the solution should remain weak enough to prevent the deamination of major amino acids (Fenner, 1965). The neutralization of VFA is assumed to be necessary to release the volatile bases. In other words, it is necessary to convert NH4+ (that presents low volatility) into NH3, the
volatile form of ammonia that can be easily steam-carried to the boric acid solution. In contrast, an excessive quantity of KOH can cause the hydrolysis of peptide bonds and the deamination of true protein, which would artificially increase the N-NH3
concentration.
The pattern of intercept estimates in the KD method (Table 1) indicates that KOH promoted the release of ammonia nitrogen from amino acids, and the deamination intensity seems to be directly associated with the proportion of KOH in the distilled solution (Figure 1).
When evaluating the standard solutions, the slope of the adjusted functions can be interpreted as the recovery of N-NH3 from the medium (Equation 2b). Except for the
5:1 and 7.5:1 ratios, an incomplete N-NH3 recovery (P<0.05) was found with the KD
12 an incomplete recovery (Table 1 and Figure 1), which could not be the result of a lack of VFA neutralization. The 10:1 ratio of the KOH solution to the standards caused the highest level of deamination, which was supported by the highest intercept estimate (Table 1). During the function adjustment, a high intercept could force down the slope, which would explain the slope lower than one and the incomplete N-NH3 recovery.
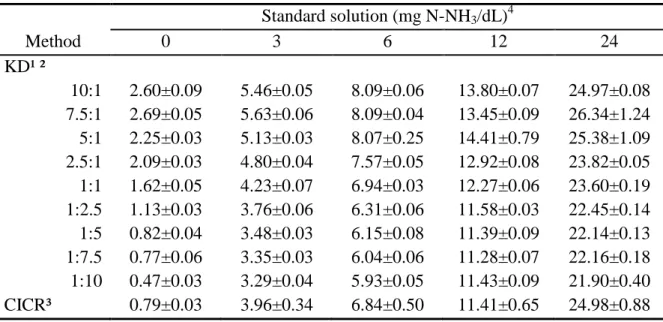
Table 2 - Average contents of ammonia nitrogen (N-NH3, mg/dL) in the standard
solutions obtained using the two analytical methods Standard solution (mg N-NH3/dL)4
Method 0 3 6 12 24
KD¹ ²
10:1 2.60±0.09 5.46±0.05 8.09±0.06 13.80±0.07 24.97±0.08 7.5:1 2.69±0.05 5.63±0.06 8.09±0.04 13.45±0.09 26.34±1.24 5:1 2.25±0.03 5.13±0.03 8.07±0.25 14.41±0.79 25.38±1.09 2.5:1 2.09±0.03 4.80±0.04 7.57±0.05 12.92±0.08 23.82±0.05 1:1 1.62±0.05 4.23±0.07 6.94±0.03 12.27±0.06 23.60±0.19 1:2.5 1.13±0.03 3.76±0.06 6.31±0.06 11.58±0.03 22.45±0.14 1:5 0.82±0.04 3.48±0.03 6.15±0.08 11.39±0.09 22.14±0.13 1:7.5 0.77±0.06 3.35±0.03 6.04±0.06 11.28±0.07 22.16±0.18 1:10 0.47±0.03 3.29±0.04 5.93±0.05 11.43±0.09 21.90±0.40 CICR³ 0.79±0.03 3.96±0.34 6.84±0.50 11.41±0.65 24.98±0.88
¹ Kjeldahl distillation. ² Using different ratios of the KOH solution to the standard solutions (mL/mL). ³ Catalyzed indophenol colorimetric reaction. 4 Mean ± standard error.
The colorimetric evaluation of the N-NH3 concentration in biological fluids
13 Figure 1 - Estimates of the intercept and slope for the adjusted linear functions of the
ammonia nitrogen concentrations obtained by the Kjeldahl distillation of standard solutions using different ratios of potassium hydroxide solution to standard solutions.
The comparative evaluation of the methods was performed under the assumption that the CICR method is accurate, which was supported by the results obtained with the standard solutions (Table 1). To evaluate the KD method, the 5:1 ratio of the KOH solution to the rumen fluid samples was adopted because it presented the highest estimate of N-NH3 recovery between the ratios that produced a complete recovery with
the standard solutions (Table 1 and Figure 1). In addition, the 1:10 ratio was evaluated because this ratio was recommended in the original method based on steam distillation (Fenner, 1965).
In spite of the results obtained with the standard solutions (Table 2), the N-NH3
in the ruminal samples was not detected using the 1:10 ratio of KOH solution to rumen fluid, which seems to indicate deficiency with regard to acid neutralization.
0.86 0.88 0.90 0.92 0.94 0.96 0.98 1.00 0.0 0.5 1.0 1.5 2.0 2.5 3.0
10:1 7.5:1 5:1 2.5:1 1:1 1:2.5 1:5 1:7.5 1:10
14 The KD method (5:1 ratio) estimated the N-NH3 concentrations with higher
precision than the CICR method; however, those values were, on average, higher than the values obtained using the CICR method (Table 3).
The intercept for the relationship between the KD (5:1) and CICR methods (Figure 2) for the rumen fluid samples was similar to that obtained when standard solutions were evaluated by the KD method (5:1 ratio; Table 2), which corroborates the deamination of true protein. However, unlike the observations with the standard solutions, the KD did not allow the complete recovery of N-NH3 in the rumen fluid
samples (P<0.05; Figure 2). Such pattern seems to be plausible because rumen fluid samples are more complex than the standard solutions; the former comprises varied concentrations and proportions of VFA and presents compounds that were not included in the standard solutions (e.g., lactic acid and branched-chain volatile fatty acids).
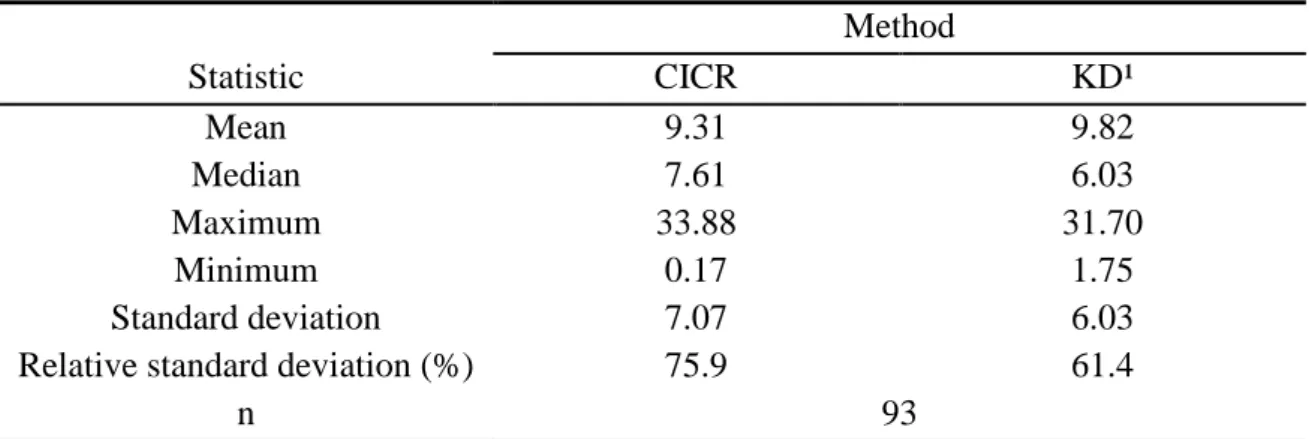
Table 3 - Descriptive statistics for the ammonia nitrogen concentration (mg/dL) in the rumen fluid samples estimated by the catalyzed indophenol colorimetric reaction (CICR) and Kjeldahl distillation (KD) methods
Method
Statistic CICR KD¹
Mean 9.31 9.82
Median 7.61 6.03
Maximum 33.88 31.70
Minimum 0.17 1.75
Standard deviation 7.07 6.03
Relative standard deviation (%) 75.9 61.4
n 93
¹ Using a 5:1 ratio of the KOH solution to the rumen fluid sample.
Despite the differences, the N-NH3 concentrations estimated by the two methods
15 method could be converted into values that are equivalent to those obtained by the CICR method (Figure 2). Such a conversion could be performed as follows:
83 . 0 11 . 2 )] ( [ )] ( [ )] ( [ )
( 3 3 3
3
N NH K
RR d NH N K NH N a NH
N (3),
where N-NH3(a) = the adjusted N-NH3 concentration in rumen fluid (mg/dL);
N-NH3(K) = the N-NH3 concentration in rumen fluid estimated by the KD method using a
5:1 ratio of KOH solution to the rumen fluid sample (mg/dL); N-NH3(d) = the N-NH3
arising from the deamination of true protein (mg/dL); and RR = the recovery rate of N-NH3 in the medium.
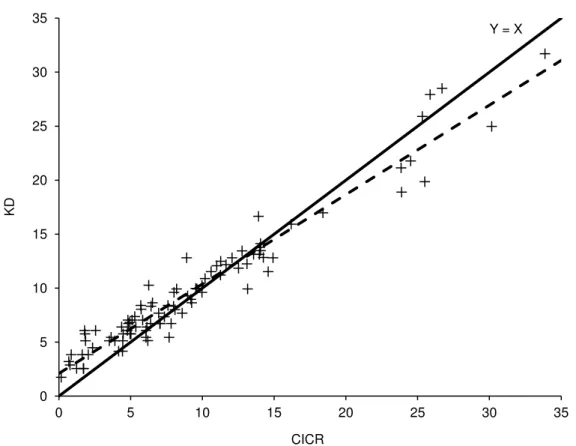
Figure 2 - Relationship between the ammonia nitrogen concentrations (mg/dL) in rumen fluid samples estimated by the catalyzed indophenol colorimetric reaction (CICR) and Kjeldahl distillation (KD; 5:1) methods [Ŷ = 2.109(±0.254) + 0.828(±0.022) X; sXY = 1.47; r² = 0.9410; the dashed line represents the
least squares straight line].
Y = X
0 5 10 15 20 25 30 35
0 5 10 15 20 25 30 35
KD
16 Conclusions
17 References
BOLLETER, W.T.; BUSHMAN, C.J.; TIDWELL, P.W. Spectrophotometric determination of ammonia as indophenol. Analytical Chemistry, v.33, p.592-594, 1961.
CHANEY, A.L.; MARBACH, E.P. Modified reagents for determination of urea and ammonia. Clinical Chemistry, v.8, p.130-132, 1962.
COSTA, V.A.C.; DETMANN, E.; PAULINO, M.F. et al. Digestibilidade total e parcial e balanço nitrogenado em bovinos em pastejo no período das águas recebendo suplementos com nitrogênio não-proteico e/ou proteína verdadeira. Revista Brasileira de Zootecnia, v.40, p.2815-2826, 2011.
DETMANN, E.; PAULINO, M.F.; MANTOVANI, H.C. et al. Parameterization of ruminal fibre degradation in low-quality tropical forage using Michaelis-Menten kinetics. Livestock Science, v.126, p.136-146, 2009.
FENNER, H. Method for determining total volatile bases in rumen fluid by steam distillation. Journal of Dairy Science, v.48, p.249-251, 1965.
McDOUGALL, E.I. Studies on ruminal saliva. 1. The composition and output of
sheep’s saliva. Journal of Biochemistry, v.43, p.99-109, 1949.
RUSSELL, J.B. Rumen microbiology and its role in ruminant nutrition. Ithaca: James B. Russell, 2002. 119p.
SOUZA, M.A.; DETMANN, E.; PAULINO, M.F. et al. Intake, digestibility and rumen dynamics of neutral detergent fiber in cattle fed low-quality tropical forage and supplemented with nitrogen and/or starch. Tropical Animal Health and Production, v.42, p.1299-1310, 2010.
18 Evaluation of chromium concentration in cattle feces using different techniques of
acid digestion and spectrophotometric quantification
ABSTRACT – The objective of this work was to evaluate combinations between acid digestion techniques and spectrophotometric quantification to measure chromium concentration in cattle feces. It was evaluated digestion techniques based on the use of nitric and perchloric acids, sulfuric and perchloric acids, and phosphoric acid. The chromium quantification in the solutions was performed by colorimetry and by atomic absorption spectrophotometry (AAS). When AAS was used, it was also evaluated the addition of calcium chloride to the solutions as releasing agent. Several standard samples containing known chromium contents were produced (0, 2, 4, 6, 8 and 10 g of chromium per kg of feces) using cattle feces obtained from three different animals to evaluate the accuracy of the different combinations of techniques. The accuracy was evaluated by adjusting a simple linear regression model of the estimated values on the actual values of chromium content in the standard samples. Independently on digestion technique, the estimates of chromium contents in the standards samples obtained by colorimetry were not accurate (P<0.05). Considering the AAS quantification, the digestion techniques based on nitric and perchloric acids and based on sulfuric and perchloric acids provided complete chromium recovery (P>0.05). The use of digestion technique in phosphoric acid provided incomplete recovery of the fecal chromium (P<0.05). Subsequently, the digestion techniques in nitric and perchloric acids and digestion in sulfuric and perchloric acids, both evaluated by AAS, were compared using 84 cattle feces samples. The results indicate that these techniques provide similar contents (P>0.05) of fecal chromium.
19 Introduction
Several chemical elements, either in salt and oxide form, can be used as external markers in digestion assays with ruminant animals. Among these, it can be highlighted: ytterbium, erbium, europium, cobalt, cadmium, lanthanum, gold, cerium, and chromium. That latter element, noticeably in the chromic oxide form (Cr2O3), is the
most widely used external marker applied for the quantification of fecal excretion of feedlot or grazing cattle. Such peculiarity is mainly based on facts that chromic oxide is easily added to the diet, and presents soft working and low cost evaluation methods (Detmann et al., 2004).
Among the ideal characteristics of a marker, it can be emphasized the capacity of marker to be completely recovered in feces (Owens & Hanson, 1992) or any segment of the digestive tract (Valente et al., 2011). The lack of this characteristic can result in biased estimates of digesta flow or fecal excretion. Although the recovery capacity is theoretically inherent to the marker (Detmann et al., 2007), indirect influences of the methods applied to estimate its concentration may result in apparent deviations of recovery (Valente et al., 2011).
Several methods to evaluate the chromium content in fecal samples can be found in the literature. Generally, such methods are based on the combination of two different techniques. The first one is used to eliminate the organic matter of the sample and let the chromium in a chemical form enable to be quantified by the second technique, which is based on the utilization of spectrophotometric quantification.
20 combinations can be employed, being highlighted the digestions in a mixture of nitric and perchloric acids (Kimura & Miller, 1957), in a phosphoric acid solution (Willians et al., 1962), and in a mixture of sulfuric and perchloric acids (Fenton & Fenton, 1979).
The chromium quantification may be performed by using atomic absorption spectrophotometry (AAS) or by colorimetry. Nevertheless, some authors reported that AAS quantification of chromium could present interferences caused by some elements such as silicon, aluminum, and iron. Considering that type of chemical interference, it would become necessary the use of releasing agents to ensure the accuracy in the quantification procedures (Williams et al., 1962).
However, the accuracy of the procedures to estimate fecal chromium contents depends on the individual accuracy of both acid digestion and spectrophotometric quantification techniques. Therefore, studies involving the simultaneous evaluation of both techniques types are demanded.
The objective of this study was to evaluate the combinations of different acid digestion and spectrophotometric quantification techniques on the accuracy of chromium contents estimates in cattle feces samples.
Material and Methods
The experiment was conducted at the Animal Nutrition Laboratory of the Animal Science Department at the Universidade Federal de Viçosa in Viçosa, Brazil.
21 (CaCl2) as releasing agent in the solutions (Williams et al., 1962) was also
accomplished.
Several standard samples containing known chromium contents were produced using cattle feces (organic matrix) obtained from three different animals (one growing heifer, one non-lactating dairy cow and one lactating dairy cow) to evaluate the accuracy of the different techniques. The animals were fed with corn silage based diets containing different concentrate levels and none of those had received chromium in diet or as external marker. The fecal samples were collected in a same day, oven-dried (60°C) and processed in a knife mill (1-mm). From each organic matrix, six different standards were produced containing 0, 2, 4, 6, 8 and 10 g of chromium per kg of feces, totalizing 18 standard samples. The standards concentrations were produced as-is basis to avoid the accumulation of error from the estimation of the total dry matter content (Mertens, 2003). Pure chromic oxide (Cr2O3; 99.9% trace metals basis; Sigma-Aldrich
203068) was employed to produce the standards.
All standards (combinations between organic matrix and chromium concentrations) were evaluated in duplicate using every combination of acid digestion and spectrophotometric quantification techniques.
22 transfer was carried out using ash-free quantitative filter paper (Whatman #41). The volume of the solutions was made up to 50 mL using de-ionized water. Aliquot of the solutions were transferred to polyethylene flasks and kept cooled (4°C).
Two digestion sets were performed according to descriptions above. The first one was performed just as previously described. In the second digestion set, 6.25 mL of a calcium chloride solution (CaCl2.2 H2O P.A.; 4 g of calcium per liter; Williams et al.,
1962) were previously added to the volumetric flasks before the transference. The solutions containing calcium chloride were evaluated by AAS. On the other hand, the solutions produced without adding calcium chloride were evaluated by both AAS and colorimetry.
To perform the colorimetry evaluations a stock solution containing 1000 ppm of chromium was produced using potassium dichromate (K2Cr2O7; purity 99%; Vetec
270). The stock solution was then diluted to obtain solutions containing 0, 50, 100, 150, and 200 ppm of chromium. Those standard solutions were used to generate the standard curve. The colorimetric evaluations were carried out at 440 nm in a spectrophotometer UV/Visible BEL Photonics 2000 UV.
In the AAS, standards solutions containing 0, 2, 4, 6, 8, and 10 ppm of chromium were used. Those solutions were produced from a stock solution containing 1000 ppm of chromium (Merk 1.09948 Tritisol®). The samples were evaluated in spectrophotometer GBC Avanta Σ, using a hollow-cathode lamp (357.9 nm) and a nitrous oxide-acetylene flame.
23 were added. That solution also contained 20 g/L of sodium molybdate. The erlenmeyer flasks were covered with watch-glasses and kept on a sand-bath at 300°C until developing a yellowish or reddish color. After cooling at room temperature, it was preceded to the quantitative transfer to 100-mL volumetric flasks. The transfer was performed using ash-free quantitative filter paper (Whatman #41). The volume of the solutions was made up to 100 mL with de-ionized water. Aliquots from the solutions were poured into polyethylene flasks and kept cooled (4°C).
The calcium chloride addition to the samples and the colorimetric and AAS procedures were performed such as previously described.
To perform the digestion of standard samples in phosphoric acid, approximately 1 g of each standard sample was poured into 25-mL erlenmeyer flasks and ashed at 600°C for 4 hours. After cooling at room temperature, 3 mL of the digestion solution were added [phosphoric acid 85% (1 L) plus a manganese sulphate solution (30 mL of a 100 g/L solution of MnSO4.4 H2O) and 4 mL of potassium bromate solution (KBrO3; 45
g/L)]. The erlenmeyer flasks were then covered with watch-glasses and digested on a sand-bath at 300°C until developing a purple color. Then, the samples were cooled at room temperature and quantitatively transferred and stored as described before.
The addition of calcium chloride to the samples was carried out as described above. All standards samples, with or without inclusion of calcium chloride, were evaluated only by AAS as previously described.
24 0
: 0
0
H
vs. Ha:0 0 (1), 1
: 1
0
H
vs. Ha :1 1 (2). The slope of the adjusted function must be interpreted as the recovery of chromium added in the standard samples. Additionally, the intercept should represent some kind of interference in the medium which could be originated from chemical interference, reagents impurity, as well as incomplete digestion. Accordingly, the estimated concentrations of chromium were considered to be accurate when both null hypotheses were not rejected.
The combination between acid digestion and spectrophotometric quantification that were found accurate were then used to evaluate the chromium concentration in 84 feces samples obtained from feedlot cattle fed with diets based on corn silage, elephant grass silage, or signal grass hay, and containing 0 or 200 g of concentrate per kg of dry matter. During the digestibility assay the animals received 10 g of Cr2O3 per day to
evaluate the daily fecal excretion (Sampaio et al., 2011).
The feces samples were oven-dried at 60°C and processed in a knife mill (1-mm). After that, all samples were evaluated in duplicate with regard chromium content. The estimates of chromium contents obtained by accurate combinations were compared each other by adjusting a simple linear regression equation, considering both null hypotheses previously presented. The techniques were considered to be similar when both null hypotheses were not rejected.
25 Results
Independently on digestion technique, the estimates of chromium contents in the standards samples obtained by colorimetry were lower than the actual chromium contents (Table 1). There were no interferences in the medium for any techniques combination. It can be affirmed because none of the intercept estimates was found to be different from zero (P>0.05; Table 2). On the other hand, the chromium recovery was found incomplete when colorimetric quantification was used (P<0.05; Table 2; Figures 1 and 2).
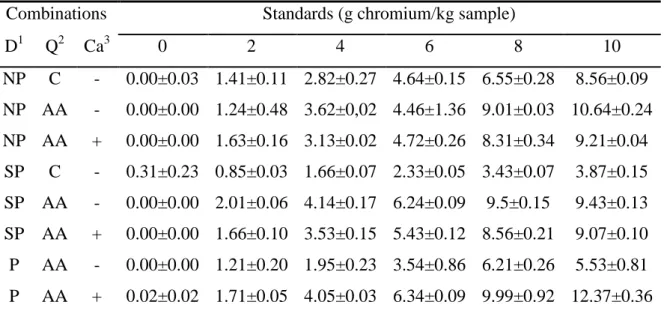
Table 1- Average of chromium contents in the standards samples obtained by different combinations of techniques
Combinations Standards (g chromium/kg sample)
D1 Q2 Ca3 0 2 4 6 8 10
NP C - 0.00±0.03 1.41±0.11 2.82±0.27 4.64±0.15 6.55±0.28 8.56±0.09 NP AA - 0.00±0.00 1.24±0.48 3.62±0,02 4.46±1.36 9.01±0.03 10.64±0.24 NP AA + 0.00±0.00 1.63±0.16 3.13±0.02 4.72±0.26 8.31±0.34 9.21±0.04
SP C - 0.31±0.23 0.85±0.03 1.66±0.07 2.33±0.05 3.43±0.07 3.87±0.15 SP AA - 0.00±0.00 2.01±0.06 4.14±0.17 6.24±0.09 9.5±0.15 9.43±0.13 SP AA + 0.00±0.00 1.66±0.10 3.53±0.15 5.43±0.12 8.56±0.21 9.07±0.10 P AA - 0.00±0.00 1.21±0.20 1.95±0.23 3.54±0.86 6.21±0.26 5.53±0.81 P AA + 0.02±0.02 1.71±0.05 4.05±0.03 6.34±0.09 9.99±0.92 12.37±0.36 1D, acid digestion technique: NP, nitric and perchloric acids; SP, sulfuric and perchloric acids and P,
phosphoric acid. 2Q, spectrophotometric quantification: C, colorimetry; and AA, atomic absorption. 3Ca,
using of calcium chloride as releasing agent.
26 Table 2 – Estimates of linear regression parameters for the chromium concentration in
the standards obtained by different techniques combinations
Combinations Regression Parameter P-Value
D1 Q2 Ca3 Intercept Slope sXY r² H0: β0 = 0 H0: β1 = 1
NP C - -0.278±0.156 0.853±0.026 0.37 0.986 0.093 <0.001 NP AA - -0.692±0.511 1.103±0.084 1.22 0.914 0.195 0.241 NP AA + -0.318±0.265 0.966±0.044 0.63 0.968 0.248 0.444 SP C - 0.203±0.096 0.374±0.016 0.23 0.972 0.051 <0.001 SP AA - 0.091±0.284 1.025±0.047 0.68 0.968 0.754 0.598 SP AA + -0.141±0.219 0.970±0.036 0.53 0.978 0.529 0.427 P AA - -0.089±0.419 0.633±0.069 1.00 0.839 0.835 <0.001 P AA + -0.603±0.329 1.269±0.054 0.79 0.971 0.086 0.001
1
D, acid digestion technique; NP, nitric and perchloric acids; SP, sulfuric and perchloric acids and P,
phosphoric acid.2Q, spectrophotometric quantification; C, colorimetry; and AA, atomic absorption.3Ca,
using of calcium chloride as release agent.
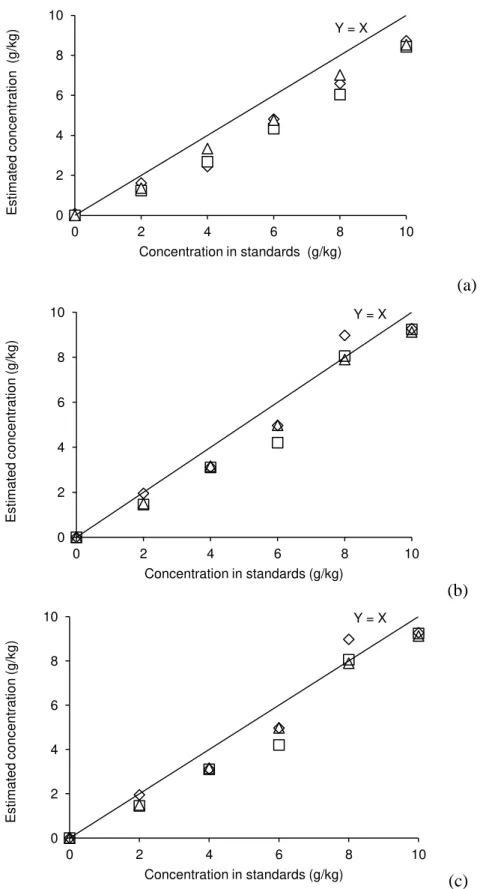
27 (a)
(b)
(c)
Figure 1- Relationship between chromium concentrations estimated using digestion technique in nitric and perchloric acids and the actual concentrations of chromium in standards (a, colorimetry; b, AAS without calcium chloride; c, AAS with calcium chloride; , animal 1; , animal 2; , animal 3).
Y = X
0 2 4 6 8 10
0 2 4 6 8 10
Es ti m a te d c o n c e n tra ti o n (g /k g )
Concentration in standards (g/kg)
Y = X
0 2 4 6 8 10
0 2 4 6 8 10
Es ti m a te d c o n c e n tra ti o n (g /k g )
Concentration in standards (g/kg)
Y = X
0 2 4 6 8 10
0 2 4 6 8 10
Es ti m a te d c o n c e n tra ti o n (g /k g )
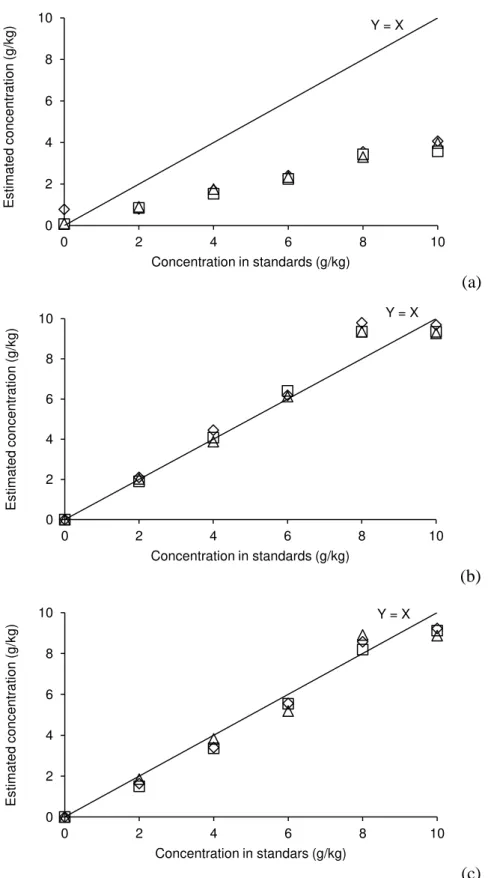
28 (a)
(b)
(c)
Figure 2 – Relationship between chromium concentrations estimated using digestion technique in sulfuric and perchloric acids and the actual concentrations of chromium in standards (a, colorimetry; b, AAS without calcium chloride; c, AAS with calcium chloride; , animal 1; , animal 2; , animal 3).
Y = X
0 2 4 6 8 10
0 2 4 6 8 10
Es ti m a te d c o n c e n tra ti o n (g /k g )
Concentration in standards (g/kg)
Y = X
0 2 4 6 8 10
0 2 4 6 8 10
Es ti m a te d c o n c e n tra ti o n (g /k g )
Concentration in standards (g/kg)
Y = X
0 2 4 6 8 10
0 2 4 6 8 10
Es ti m a te d c o n c e n tra ti o n (g /k g )
29 From these results, the fecal samples obtained from the digestion trial were evaluated using the digestion techniques based on nitric and perchloric acids and based on sulfuric and perchloric acids, both considering the quantification by AAS (Table 2). The calcium chloride was not used because it did not improve the accuracy of the results (Table 2) and its omission makes the analytical procedures simpler. Considering this, it was verified that both techniques combinations provided similar results (P>0.05) and were strongly correlated (r = 0.970; P<0.05; Figure 4).
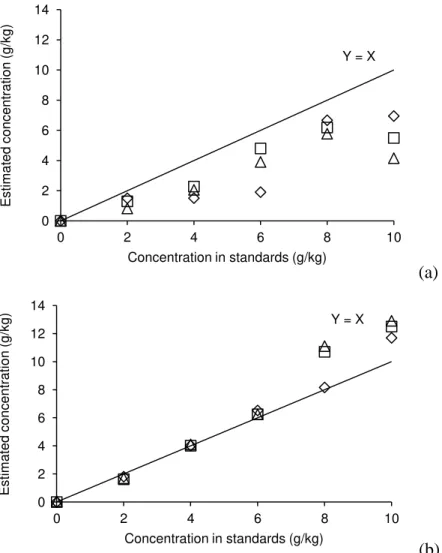
(a)
(b)
Figure 3 – Relationship between the chromium concentration estimated using digestion technique in phosphoric acid and the real concentrations of chromium in standards (a, AAS without calcium chloride; b, AAS with calcium chloride; , animal 1; , animal 2; , animal 3).
Y = X
0 2 4 6 8 10 12 14
0 2 4 6 8 10
Es ti m a te d c o n c e n tra ti o n (g /k g )
Concentration in standards (g/kg)
Y = X
0 2 4 6 8 10 12 14
0 2 4 6 8 10
Es ti m a te d c o n c e n tra ti o n (g /k g )
30 Figure 4 – Relationship between the fecal chromium concentrations obtained by
digestion technique in nitric and perchloric acids and in sulfuric and perchloric acids, both associated with AAS without calcium addition (Ŷ = -0.1673 + 0.9602 X; r2
= 0.941; n = 84).
Discussion
The lack of accuracy of the chromium contents quantified by colorimetry seems to be due to the lack of sensibility of technique to detect the compounds containing chromium in the medium (Table 2; Figures 1 and 2).
Conversely, Rodrigues et al. (2010) evaluated the chromium contents in feces of sheep using colorimetry quantification and obtained accurate results. Those authors used the method suggested by Graner (1972), who indicated the use of the 1,5-diphenylcarbazide which reacts with the chromium oxide and produces a red/purple compound that presents high absorptivity. Such modification can increase the sensibility of chromium detection by colorimetry.
Y = X
0 2 4 6 8 10 12
0 2 4 6 8 10 12
Dig e s ti o n in n itri c a n d p e rc h lo ri c a c id s (g /k g )
31 Bremer Neto et al. (2005) redefined the Graner (1972) method, specifically for fecal chromium evaluation. Those authors did not verify differences between the chromium content estimated by colorimetry using the 1,5-diphenylcarbazide and the chromium content estimated by AAS.
In this study, the 1,5-diphenylcarbazide was not used because the original colorimetric methods here evaluated (Kimura & Miller, 1957; Fenton & Fenton, 1979) do not recommend the use of this substance in the chromium content evaluation.
The calcium addition as releasing agent in AAS quantification was suggested by Williams et al. (1962), who used the phosphoric acid digestion. According to these authors, several compounds or elements, as silicates, iron, aluminum, and others, can form refractory compounds with chromium during the burning of the solution in the spectrophotometer. Such compounds would be not readily dissociated at the flame temperatures, which could decrease the accuracy of the chromium quantification. These interferences could be suppressed by the calcium chloride addition to the test solutions. The calcium would bind with the interfering ions and these ions could not form refractory compounds with the chromium, leaving it free to be quantified.
The digestion techniques based on nitric and perchloric acids and based on sulfuric and perchloric acids provided accurate results independently of calcium chloride addition in the solutions. In other words, under these digestion conditions the addition of calcium was not able to improve the accuracy of chromium contents using ASS which indicates that, in the presence of these acids, there are no chemical interferences, such as cited above (Table 2; Figures 1 and 2).
32 improvement caused by calcium is that interference in the chromium reading by AAS can be due to the acid type used in the samples digestion and not by the presence of specific ions such as silicates. After the acid digestion, some anions as phosphates (originated form phosphoric acid) can be present in solutions and they could cause interferences in the nitrous oxide-acetylene flame, and this could affect the chromium concentration obtained by AAS (Sahuquillo et al., 1995). The main interferences in the nitrous oxide-acetylene flame described in the literature are referred to the acid matrix and cations (Rubio et al., 1991).
Therefore, the lack of accuracy obtained with digestion in phosphoric acid could be attributed to the interferences of this acid upon the formation of elemental chromium in the nitrous oxide-acetylene flame, whereas the other techniques evaluated by AAS, using nitric and perchloric acids and sulfuric and perchloric acids, presents accurate results, independent on calcium addition to the solutions.
33 bias could occur only in some samples (and not in all samples) and the overall results of the experiment would be distorted.
The digestion procedures based on nitric and perchloric acids and on sulfuric and perchloric acids, both associated with AAS quantification, presented accurate results (Table 2) and were found similar each other (Figura 4). Considering this, the choice of a particular method should be based on secondary characteristics, such as analytical costs and labor. The digestion based on sulfuric and perchloric acids is more time and labor consuming compared to digestion using nitric and perchloric acids because it demands an ashing step (Fenton & Fenton, 1979). So, considering the secondary characteristics, the digestion procedure based on nitric and percloric acids and using AAS seems to be a more realistic method to quantify chromium contents in cattle feces.
Conclusions
34 References
BREMER NETO, H.; GRANER, C.A.F.; PEZZATO, L.E. et al. Determinação de rotina do crômio em fezes, como marcador biológico, pelo método espectrofotométrico ajustado da 1,5-difenilcarbazida. Ciência Rural, v.35, p.691-697, 2005.
DETMANN, E; VALADARES FILHO, S.C.; PAULINO, M.F. et al. Avaliação da técnica dos indicadores na estimação do consumo por ruminantes em pastejo. Cadernos Técnicos de Veterinária e Zootecnia, v.46, p.40-57, 2004.
DETMANN, E.; SOUZA, A.L.; GARCIA, R. et al. Avaliação do vício de “tempo
longo” de indicadores internos em ensaio de digestão com ruminantes. Arquivo Brasileiro de Medicina Veterinária e Zootecnia, v.59, p.182-188, 2007.
FENTON, T.W.; FENTON, M. An improved procedure for the determination of chromic oxide in feed and feces. Canadian Journal of Animal Science, v. 59, p.631-634, 1979.
GRANER, C.A.F. Determinação do crômio pelo método colorimétrico da s-difenilcarbazida. 1972. 112 f. Tese (Doutorado) – Faculdade de Ciências Médicas e Biológicas/Universidade Estadual Paulista, Botucatu.
KIMURA, F.T.; MILLER, V.L. Improved determination of chromic oxide in cow feed and feces. Journal of Agricultural and Food Chemistry, v.5, p.216-216, 1957. MERTENS, D.R. Challenges in measuring insoluble dietary fiber. Journal of Animal
Science, v.81, p.3233-3249, 2003
OWENS, F.N.; HANSON, C.F. External and internal markers for appraising site and extent of digestion in ruminants. Journal of Dairy Science, v.75, p.2605-2617, 1992.
RODRIGUES, P.H.M.; GOMES, R.C.; SIQUEIRA, R.F. et al. Acurácia, precisão e robustez das estimativas da digestibilidade aparente da matéria seca determinada com o uso de indicadores em ovinos. Revista Brasileira de Zootecnia, v.39, p.1118-1126, 2010.
RUBIO, R.; SAHUQUILLO, A.; RAURET, G. Determination of chromium in environmental and biological samples by atomic absorption spectroscopy: a review. Analytical Chemistry, v.47, p.99-128, 1991.
SAMPAIO, C.B.; DETMANN, E.; VALENTE, T.N.P. et al. Evaluation of fecal recovering and long term bias of internal and external markers in a digestion assay with cattle. Revista Brasileira de Zootecnia, v.40, p.174-182, 2011.
SAHUQUILLO, A.; RUBIO, R.; RAURET, G. et al. Determination of total chromium in sediments by FAAS. Analytical Chemistry, v.352, p.572-576, 1995.
VALENTE, T.N.P.; DETMANN, E.; VALADARES FILHO, S.C. et al. In situ estimation of indigestible compounds contents in cattle feed and feces using bags made from different textiles. Revista Brasileira de Zootecnia, v.40, p.666-675, 2011.