Accuracy of the estimates of ammonia concentration in rumen fluid
using different analytical methods
[Exatidão das estimativas de concentração de amônia em fluido ruminal utilizando diferentes métodos analíticos]
N.K.P. Souza1, E. Detmann2*, S.C. Valadares Filho2, V.A.C. Costa3, D.S. Pina1, D.I. Gomes4, A.C. Queiroz2, H.C. Mantovani2
1
Universidade Federal de Mato Grosso Sinop, MT
2
Universidade Federal de Viçosa Viçosa, MG Pesquisador do CNPq
3
Universidade Estadual do Norte Fluminense Campos dos Goytacazes, RJ
4
Universidade Federal Rural da Amazônia Parauapebas, PA
ABSTRACT
The accuracy of two different methods in measuring the ammonia nitrogen (N-NH3) concentration in
rumen fluid were evaluated: a catalyzed indophenol colorimetric reaction (CICR) and the Kjeldahl distillation (KD). Five buffered standard solutions containing volatile fatty acids, true protein, and known ammonia concentrations (0, 3, 6, 12, and 24 N-NH3 mg/dL) were used to simulate rumen fluid. Different
ratios (10:1, 7.5:1, 5:1, 2.5:1, 1:1, 1:2.5, 1:5, 1:7.5, and 1:10) of a potassium hydroxide solution (KOH, 2 mol/L) to standard solutions were evaluated by the KD method. The accuracy of each method was evaluated by adjusting a simple linear regression model of the estimated N-NH3 concentrations on the
N-NH3 concentrations in the standard solutions. When the KD method was used, N-NH3 was observed to be
released from the deamination of true protein (P<0.05), and an incomplete recovery of N-NH3 was
observed (P<0.05), except for 7.5:1 and 5:1 ratios of KOH solution to standard solutions (P>0.05). The estimates of the N-NH3 concentration obtained by the CICR method were found to be accurate (P>0.05).
After the accuracy evaluation, ninety-three samples of rumen fluid were evaluated by the CICR and KD methods (using the 5:1 ratio of KOH solution to rumen fluid sample), assuming that the CICR estimates would be accurate. The N-NH3 concentrations obtained by the two methods were observed to be different
(P<0.05) but strongly correlated (r = 0.9701). Thus, it was concluded that the estimates obtained by the Kjeldahl distillation using a 5:1 ratio of KOH solution to rumen fluid sample can be adjusted to avoid biases. Furthermore, a model to adjust the N-NH3 concentration is suggested.
Keywords: ammonia nitrogen, indophenol colorimetric reaction, Kjeldahl distillation
RESUMO
Avaliou-se a exatidão de dois métodos para mensuração da concentração de nitrogênio amoniacal (N-NH3) em fluido ruminal: reação colorimétrica catalisada por indofenol (RCCI) e destilação de Kjeldahl
(DK). Cinco soluções-tampão contendo ácidos graxos voláteis, proteína verdadeira e concentrações conhecidas de amônia (0, 3, 6, 12 e 24 N-NH3 mg/dL) foram utilizadas para simular o fluido ruminal.
Diferentes relações (10:1; 7,5:1; 5:1; 2,5:1; 1:1; 1:2,5; 1:5; 1:7,5 e 1:10) entre a solução de hidróxido de potássio (KOH, 2 mol/L) e as soluções-padrão foram avaliadas no método DK. A exatidão de cada método foi avaliada por intermédio do ajustamento de um modelo de regressão linear simples das concentrações estimadas de N-NH3 sobre as concentrações reais de N-NH3 nas soluções-padrão. Com a
utilização da DK observou-se que N-NH3 foi liberada a partir da deaminação de proteína verdadeira
(P<0,05). Adicionalmente, a utilização da DK promoveu recuperação incompleta da N-NH3 (P<0,05),
Recebido em 11 de abril de 2012 Aceito em 13 de junho de 2013
Autor para correspondência (corresponding author)
E-mail: detmann@ufv.br
com exceção das razões entre a solução de KOH e as soluções-padrão de de 7,5:1 e de 5:1 (P>0,05). As estimativas de concentração de amônia obtidas por intermédio do método de RCCI foram exatas (P>0,05). Após a avaliação da exatidão, noventa e três amostras de fluido ruminal foram avaliadas por intermédio dos métodos de RCCI e de DK (neste caso usando a razão entre solução de KOH e fluido ruminal de 5:1). Nesta avaliação assumiu-se que as estimativas obtidas com a RCCI seriam exatas. Observou-se que as concentrações de N-NH3 obtidas pelos dois métodos foram diferentes (P<0,05), mas
fortemente correlacionadas (r = 0,9701). Concluiu-se que as estimativas obtidas com a DK utilizando-se razão entre a solução de KOH e a amostra de fluido ruminal de 5:1 poderiam ser ajustadas para correções de vieses Um modelo para realização desse ajustamento foi sugerido.
Palavras-chave: destilação de Kjeldahl, nitrogênio amoniacal, reação colorimétrica de indofenol
INTRODUCTION
Several parameters have been suggested for evaluating the availability of dietary nitrogenous compounds in the rumen. To date, the concentration of the ammonia nitrogen (N-NH3)
has been used as a qualitative reference to understand the adequacy of the rumen environment according to the microbial activity on fibrous carbohydrates (Detmann et al., 2009). This strategy is possibly associated with the fact that N-NH3 is the preferred nitrogen source for
the growth of fibrolytic microorganisms (Russell, 2002).
Thus, considering the relevance of N-NH3 in
ruminant nutrition, the methods used to evaluate its concentration in the ruminal fluid ought to provide accurate estimates.
Chaney and Marbach (1962) have proposed a method for N-NH3 evaluation in biological fluids
that is based on a catalyzed indophenol colorimetric reaction (CICR), and this method is intensely used in microbiological assays (e.g., Thomas and Russell, 2004). Alternatively, Fenner (1965) has established the theoretical basis for N-NH3 evaluation in rumen fluid by
steam distillation in the presence of a potassium hydroxide solution. This basis has been adapted for use in the Kjeldahl distillation (KD) procedure, which has been used in several ruminant nutrition assays (e.g., Detmann et al., 2009; Souza et al., 2010; Costa et al., 2011). Nonetheless, no study has compared the accuracy of these methods in the estimation of N-NH3 contents.
Therefore, the objective of this work was to evaluate the accuracy of N-NH3 concentration
estimates in rumen fluid with the KD and the CICR methods.
MATERIAL AND METHODS
The experiment was conducted at the Animal Nutrition Laboratory of the Animal Science Department at the Universidade Federal de Viçosa in Viçosa, Brazil.
To evaluate de accuracy of the methods, five standard solutions containing different N-NH3
concentrations were used to evaluate the accuracy of the estimates obtained from the two methods. Those five solutions were produced to simulate rumen fluid characteristics.
The basal solution was constituted by a buffer solution whose pH had previously been adjusted to 6.8 by flushing with CO2
(McDougall, 1949). Acetic acid (Sigma-Aldrich 320099; 60mmol/L), propionic acid (Sigma-Aldrich 402907; 30mmol/L) and butyric acid (Sigma Aldrich B103500; 10mmol/L) were added to the solution to represent the volatile fatty acids (VFA) present in the rumen fluid. Additionally, casein hydrolysate (Fluka 2209; 3g/L) was added to simulate the true protein content of the rumen fluid, and thimerosal (Sigma 8784; 50mg/L) was used to prevent microbial growth. The solution was divided into five aliquots, and known quantities of ammonium chloride (NH4Cl, PA, ACS, Vetec
113) were added to provide 0, 3, 6, 12, and 24 mg N-NH3/dL.
The evaluation of the N-NH3 concentration by
were added. The tubes were stirred by vortexing and kept in a water bath at 39ºC for 15 minutes. The absorbance was then read at 630nm in a spectrophotometer UV/Visible BEL Photonics 2000 UV. A standard curve was generated according to Chaney and Marbach (1962).
To evaluate the N-NH3 concentration according
the KD method, 5-mL aliquots of standard solutions were poured into glass tubes that were coupled in a Kjeldahl distillator (Tecnal® TE 036/1). Potassium hydroxide solution (KOH, 2mol/L; Fenner, 1965) was then added, and the material was distilled in a boric acid solution (40g/L). The solution obtained from the distillation (approximately 100mL) was titrated with hydrochloric acid (HCl; 0.005N). Methyl red and bromocresol green were added to the boric acid solution and used as indicators. Different ratios of the KOH solution to the standard solutions were evaluated (10:1, 7.5:1, 5:1, 2.5:1, 1:1, 1:2.5, 1:5, 1:7.5, and 1:10)
The N-NH3 concentration was estimated as
follows:
A
f
V
NH
N
3
0
.
005
14
100
(1),where N-NH3 = the ammonia nitrogen
concentration (mg/dL), V = the volume of hydrochloric acid (mL), = the factor for the correction of the hydrochloric acid concentration obtained with a Na2CO3 solution (0.005 N), 14 =
the atomic weight of nitrogen, and A = the aliquot volume (mL).
Five replicates for each standard solution were evaluated by both the CICR method and KD method at different KOH:standard solution ratios.
After accuracy evaluation, a laboratorial assay was performed to compare the estimates obtained by the methods in rumen fluid samples.
Ninety-three rumen fluid samples were obtained from cattle under grazing conditions, receiving nitrogen supplementation (true protein and/or non-protein nitrogen) during 2008. Those samples were taken at different times during the day and filtered through three layers of cheesecloth. For each sample, a 100-mL aliquot was then separated, fixed with 2.5mL H2SO4
(1:1) and frozen at -20ºC (Costa et al., 2011).
After thawing, a 50-mL aliquot of each sample was poured into a centrifuge tube, 0.5mL of a trichloroacetic acid solution (100g/L) was added, and the sample was slowly stirred. The material was allowed to settle at room temperature for 30 minutes after which, the material was centrifuged at 1,000 g for 10 minutes. The supernatant was analyzed in duplicate by the CICR method and KD method using the KOH:rumen fluid ratios of 5:1 and 1:10.
The accuracy of the N-NH3 concentrations
obtained by the CICR and KD methods was evaluated by adjusting a simple linear regression equation of estimated values (dependent variable) on the N-NH3 content in standard
solutions (independent variable); the statistical analysis was conducted under the null hypotheses below:
0
:
00
H
(2a),1
:
10
H
(2b),where β0= intercept, and β1 = slope.
The N-NH3 contents were considered to be
accurate when both of the null hypotheses were not rejected.
Additionally, the N-NH3 contents in the rumen
fluid samples were compared by adjusting a simple linear regression equation of the values estimated by the KD method (dependent variable) on the values estimated by the CICR method (independent variable). The statistical analysis was conducted under the null hypotheses expressed by equations (2a) and (2b). The estimates were considered to be similar if both of the null hypotheses were not rejected.
All of the statistical procedures were performed using the PROC REG of SAS (Statistical Analysis System, version 9.1) (α = 0.05).
RESULTS
With the KD method, the intercept estimates were observed to be different from zero (P<0.05) for all of the ratios of KOH solution to standard solutions (Table 1). Additionally, as the KOH proportion decreased, the estimates of the N-NH3
concentrations in the blank standard solution (0 mg N-NH3/dL) and the intercept estimates also
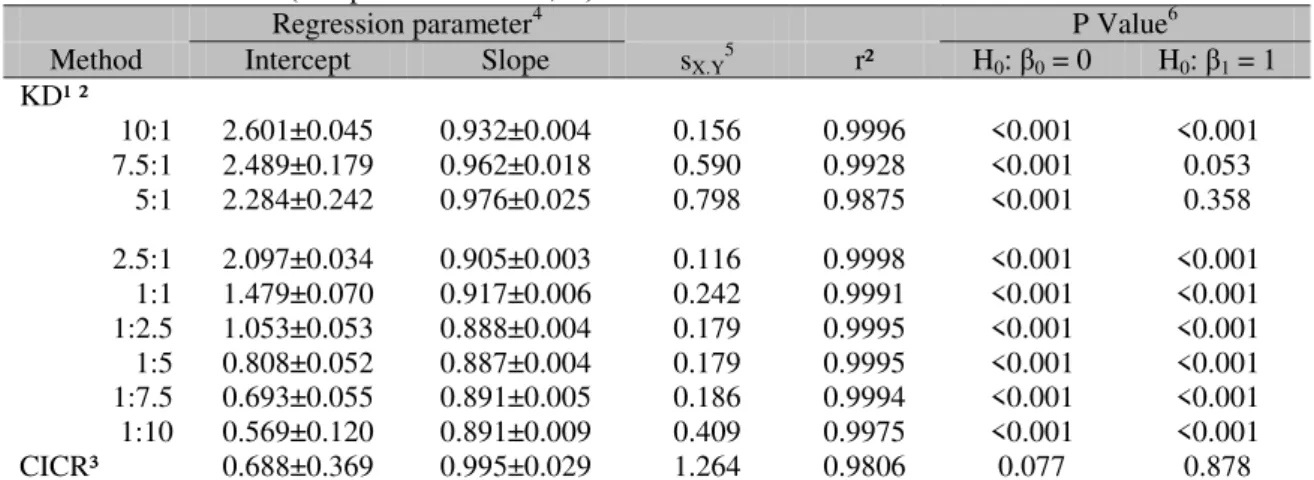
Table 1. Estimates of the linear regression parameters for the relationship between the N-NH3
concentrations obtained by two methods (dependent variable, Y) and the true concentrations of N-NH3 in
the standard solutions (independent variable, X)
Regression parameter4 P Value6
Method Intercept Slope sX.Y5 r² H0: β0 = 0 H0: β1 = 1
KD¹ ²
10:1 2.601±0.045 0.932±0.004 0.156 0.9996 <0.001 <0.001
7.5:1 2.489±0.179 0.962±0.018 0.590 0.9928 <0.001 0.053
5:1 2.284±0.242 0.976±0.025 0.798 0.9875 <0.001 0.358
2.5:1 2.097±0.034 0.905±0.003 0.116 0.9998 <0.001 <0.001
1:1 1.479±0.070 0.917±0.006 0.242 0.9991 <0.001 <0.001
1:2.5 1.053±0.053 0.888±0.004 0.179 0.9995 <0.001 <0.001
1:5 0.808±0.052 0.887±0.004 0.179 0.9995 <0.001 <0.001
1:7.5 0.693±0.055 0.891±0.005 0.186 0.9994 <0.001 <0.001
1:10 0.569±0.120 0.891±0.009 0.409 0.9975 <0.001 <0.001
CICR³ 0.688±0.369 0.995±0.029 1.264 0.9806 0.077 0.878
¹Kjeldahl distillation. ²Using different ratios of the KOH solution to the standard solutions (mL/mL). ³ Catalyzed indophenol colorimetric reaction. 4Estimate±standard error. 5Standard deviation of the relationship between X and Y.
6See more details about the hypotheses’ test in Equation 2.
0.0 0.5 1.0 1.5 2.0 2.5 3.0
10:1 7.5:1 5:1 2.5:1 1:1 1:2.5 1:5 1:7.5 1:10
In
te
rc
e
p
t
(m
g
/d
L
)
0.86 0.88 0.90 0.92 0.94 0.96 0.98 1.00
S
lo
p
e
Intercept
Slope
Figure 1. Estimates of the intercept and slope for the adjusted linear functions of the ammonia nitrogen concentrations obtained by the Kjeldahl distillation of standard solutions using different ratios of potassium hydroxide solution to standard solutions.
For the results obtained using the KD method, the slopes were found to be different from one (P<0.05), except for at the 5:1 and 7.5:1 ratios of KOH solution to the standard solutions (Table 1 and Figure 1).
The estimates of the N-NH3 concentration
obtained by the CICR method were found to be accurate (P>0.05; Table 1).
When rumen fluid samples were evaluated using the KD method, N-NH3 was not detected at the
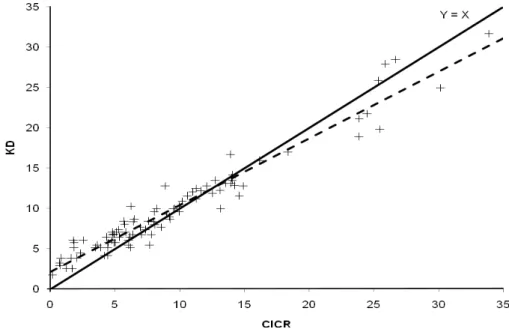
The relationship between the N-NH3
concentrations obtained by the CICR and KD (5:1 ratio) methods presented an interception that was different from zero and slope different from
one (P<0.05). Therefore, the results obtained with these methods differed from each other (Figure 2).
Figure 2. Relationship between the ammonia nitrogen concentrations (mg/dL) in rumen fluid samples estimated by the catalyzed indophenol colorimetric reaction (CICR) and Kjeldahl distillation (KD; 5:1)
methods [Ŷ = 2.109±0.254 + 0.828±0.022 X; sXY = 1.47; r² = 0.9410; the dashed line represents the
least squares straight line].
DISCUSSION
The quantity of the KOH solution used in the KD method must be sufficient to neutralize even extremely high concentrations of VFA; yet, the solution should remain weak enough to prevent the deamination of major amino acids (Fenner, 1965). The neutralization of VFA is assumed to be necessary to release the volatile bases. In other words, it is necessary to convert NH4+ (that
presents low volatility) into NH3, the volatile
form of ammonia that can be easily steam-carried to the boric acid solution. In contrast, an excessive quantity of KOH can cause the hydrolysis of peptide bonds and the deamination of true protein, which would artificially increase the N-NH3 concentration.
The pattern of intercept estimates in the KD method (Table 1) indicates that KOH promoted the release of ammonia nitrogen from amino acids, and the deamination intensity seems to be directly associated with the proportion of KOH in the distilled solution (Figure 1).
When evaluating the standard solutions, the slope of the adjusted functions can be interpreted as the recovery of N-NH3 from the medium
(Equation 2b). Except for the 5:1 and 7.5:1 ratios, an incomplete N-NH3 recovery (P<0.05)
was found with the KD method (Table 1). The utilization of lower proportions of KOH suggested a gradual decrease in the recovery (Figure 1), which seemed to indicate an ineffective neutralization of the acids in the medium. However, the highest ratio (10:1) also caused an incomplete recovery (Table 1 and Figure 1), which could not be the result of a lack of VFA neutralization. The 10:1 ratio of the KOH solution to the standards caused the highest level of deamination, which was supported by the highest intercept estimate (Table 1). During the function adjustment, a high intercept estimate could force down the slope, which would explain the slope lower than one and the incomplete N-NH3 recovery.
The colorimetric evaluation of the N-NH3
specificity and is based on the reaction of ammonia with phenol and sodium hypochlorite to produce indophenol, which is intensely blue in an alkaline medium (Bolleter et al., 1961; Chaney and Marbach, 1962). In particular, the non-significant intercept (Table 1) reinforced the high specificity of the CICR method because the other nitrogenous compounds present in the medium did not directly interfere with the N-NH3 quantification.
The comparative evaluation of the methods was performed under the assumption that the CICR method is accurate, which was supported by the results obtained with the standard solutions (Table 1). To evaluate the KD method, the 5:1
ratio of the KOH solution to the rumen fluid samples was adopted because it presented the highest estimate of N-NH3 recovery between the
ratios that produced a complete recovery with the standard solutions (Table 1 and Figure 1). In addition, the 1:10 ratio was evaluated because this ratio was recommended in the original method based on steam distillation (Fenner, 1965).
In spite of the results obtained with the standard solutions (Table 2), the N-NH3 in the ruminal
samples was not detected using the 1:10 ratio of KOH solution to rumen fluid, which seems to indicate deficiency with regard to acid neutralization.
Table 2. Average contents of ammonia nitrogen (N-NH3, mg/dL) in the standard solutions obtained using
the two analytical methods
Standard solution (mg N-NH3/dL)4
Method 0 3 6 12 24
KD¹ ²
10:1 2.60±0.09 5.46±0.05 8.09±0.06 13.80±0.07 24.97±0.08
7.5:1 2.69±0.05 5.63±0.06 8.09±0.04 13.45±0.09 26.34±1.24
5:1 2.25±0.03 5.13±0.03 8.07±0.25 14.41±0.79 25.38±1.09
2.5:1 2.09±0.03 4.80±0.04 7.57±0.05 12.92±0.08 23.82±0.05
1:1 1.62±0.05 4.23±0.07 6.94±0.03 12.27±0.06 23.60±0.19
1:2.5 1.13±0.03 3.76±0.06 6.31±0.06 11.58±0.03 22.45±0.14
1:5 0.82±0.04 3.48±0.03 6.15±0.08 11.39±0.09 22.14±0.13
1:7.5 0.77±0.06 3.35±0.03 6.04±0.06 11.28±0.07 22.16±0.18
1:10 0.47±0.03 3.29±0.04 5.93±0.05 11.43±0.09 21.90±0.40
CICR³ 0.79±0.03 3.96±0.34 6.84±0.50 11.41±0.65 24.98±0.88
¹Kjeldahl distillation. ² Using different ratios of the KOH solution to the standard solutions (mL/mL). ³ Catalyzed indophenol colorimetric reaction. 4 Mean ± standard error.
The KD method (5:1 ratio) estimated the N-NH3
concentrations with higher precision than the CICR method; however, those values were, on average, higher than the values obtained using the CICR method (Table 3).
The intercept for the relationship between the KD (5:1) and CICR methods (Figure 2) for the rumen fluid samples was similar to that obtained when standard solutions were evaluated by the KD method (5:1 ratio; Table 2), which emphasizes the occurrence of deamination of true protein. However, unlike the observations with the standard solutions, the KD did not allow the complete recovery of N-NH3 in the rumen
fluid samples (P<0.05; Figure 2). Such a pattern seems to be plausible because rumen fluid
samples are more complex than the standard solutions; the former comprises varied concentrations and proportions of VFA and presents compounds that were not included in the standard solutions (e.g., lactic acid and branched-chain volatile fatty acids).
Despite the differences, N-NH3 concentrations
estimated by the two methods were strongly correlated (r = 0.9701; Figure 2). Considering that there are situations where only the KD method could be used, N-NH3 concentrations
83
.
0
11
.
2
)]
(
[
)]
(
[
)]
(
[
)
(
3 3 33
N
NH
K
RR
d
NH
N
K
NH
N
a
NH
N
(3),where N-NH3(a) = the adjusted N-NH3 concentration in rumen fluid (mg/dL); N-NH3(K) = the N-NH3
concentration in rumen fluid estimated by the KD method using a 5:1 ratio of KOH solution to the rumen fluid sample (mg/dL); N-NH3(d) = the N-NH3 arising from the deamination of true protein (mg/dL); and
RR = the recovery rate of N-NH3 in the medium.
Table 3. Descriptive statistics for the ammonia nitrogen concentration (mg/dL) in the rumen fluid samples estimated by the catalyzed indophenol colorimetric reaction (CICR) and Kjeldahl distillation (KD) methods
Statistic Method
CICR KD¹
Mean 9.31 9.82
Median 7.61 6.03
Maximum 33.88 31.70
Minimum 0.17 1.75
Standard deviation
7.07 6.03
Relative standard deviation (%)
75.9 61.4
n 93
¹ Using a 5:1 ratio of the KOH solution to the rumen fluid sample.
CONCLUSIONS
The method based on a catalyzed indophenol colorimetric reaction produces accurate estimates of ammonia concentrations in rumen fluid. Conversely, the method based on the Kjeldahl distillation produces biased estimates due to the deamination of true protein and the incomplete recovery of ammonia nitrogen. However, these methods were observed to be strongly correlated. Therefore, the estimates obtained by the Kjeldahl distillation using a 5:1 ratio of potassium hydroxide solution (2mol/L) to the rumen fluid sample could be adjusted to avoid such biases. A model to adjust the ammonia concentration obtained by the Kjeldahl distillation is presented in this work.
REFERENCES
BOLLETER, W.T.; BUSHMAN, C.J.; TIDWELL, P.W. Spectrophotometric determination of ammonia as indophenol. Anal. Chem., v.33, p.592-594, 1961.
CHANEY, A.L.; MARBACH, E.P. Modified reagents for determination of urea and ammonia. Clin. Chem., v.8, p.130-132, 1962.
COSTA, V.A.C.; DETMANN, E.; PAULINO, M.F. et al. Digestibilidade e balanço nitrogenado em bovinos em pastejo no período das águas suplementados com nitrogênio não-protéico e/ou proteína verdadeira. Rev. Bras. Zootec., v.40, p.2815-2826, 2011.
DETMANN, E.; PAULINO, M.F.; MANTOVANI, H.C. et al. Parameterization of ruminal fibre degradation in low-quality tropical forage using Michaelis-Menten kinetics. Liv. Sci., v.126, p.136-146, 2009.
FENNER, H. Method for determining total volatile bases in rumen fluid by steam distillation. J. Dairy Sci., v.48, p.249-251, 1965.
McDOUGALL, E.I. Studies on ruminal saliva. 1.
The composition and output of sheep’s saliva. J. Biochem., v.43, p.99-109, 1949.
RUSSELL, J.B. Rumen microbiology and its role in ruminant nutrition. Ithaca: James B. Russell, 2002. 119p.
SOUZA, M.A.; DETMANN, E.; PAULINO, M.F. et al. Intake, digestibility and rumen dynamics of neutral detergent fiber in cattle fed low-quality tropical forage and supplemented with nitrogen and/or starch. Trop. Anim. Health Prod., v.42, p.1299-1310, 2010.