PRODUCTIVE RESTRUCTURING: EFFECTS ON BRAZILIAN
REGIONAL DEVELOPMENT DISTRIBUTION
Anita Kon*
Paper to be presented at the XVth ISA World Congress of Sociology, Brisbane, sponsored by International Sociological Association, Brisbane, Australia, July 7-13, 2002.
Abstract
This paper aims to evaluate the dynamics of Brazilian regional development during the
1985-95 period. First, regional inequalities indexes were calculated for the whole
country’s economy based on the per capita regional income (Williamson Inequality Index), in order to test the convergence or divergence. After this, the analysis aimed to
verify the sector and regional dynamics in a more detailed exam, and for this purpose
Dispersion Quotients and Dispersion Intensity Coefficients were calculated based on
two variables, the Regional Gross Domestic Product and the Working Population. The
results of the analysis confirm the existence of considerable regional disparities and it
was verified that the sector and regional redistribution of the GDP indicate that, in a
general way, no remarkable changes occurred in the regional productive structures in
the period. It is also inferred that the economic policy at that period, in spite of resulting
in a global regional convergence process of the per capita product, did not avoid the continuation of the concentration of greater economic dynamism in the most advanced
regions, nor did it diminish in any considerable way the difference in the degree of
development of the Northeast region.
*
1.
Introduction
The impacts of the recent economic globalization on the Brazilian economy
have revealed a diversified tendency when the regional economic indexes are observed;
this is due to the specificities of each region, as regards their sector structure, the
availability of human resources and the degree of technological innovation undertaken
by local enterprises. From a situation of regional inequalities verified in the social and
economic levels of development at the beginning of the eighties (Kon, 1995; Oliveira e
Mattoso, 1996), the dynamics of the Brazilian regional evolution has presented different
speeds and intensities in the several spaces.
Productive and occupational structures in Brazil are marked by significant
regional differences, as stressed by many researchers involved in analyzing spatial
aspects of economic development and income distribution (Kon 1995; IPEA, 1996a e
1996b). Some Brazilian states, such as São Paulo, Rio de Janeiro, Rio Grande do Sul,
Amazonas, Distrito Federal and Santa Catarina, in 1985 presented a per capita income superior to the national average, while the others presented incomes which were lower
than half the Brazilian average index. Nevertheless, it should be noted that this situation
indicates advancements in relation to the previous period, starting in the fifties, when
the income differences between the most advanced and most backward states were even
higher. In the 1950-85 period, some important transformations occurred in the
productive and occupational structures of the various spaces, in such a way that some
regions approached the country average GNP, either in the positive sense (that is
through a higher relative growth rate) or negative (due to an inferior relative growth).
Regional dynamics is impelled by a sequence of factors, which act to accelerate, retard
or diminish the specific growth rates. On the one hand, there is the influence of
politic and cultural conditions (Kon, 1995). On the other hand, there is the influence of
conjuncture situations, which also have repercussions in the various social and
economic realities, with different results and intensities. The macro and microeconomic
policies aiming at economic stabilization or at stimulating specific sectors have
differentiated effects in each region, according to the structural and conjuncture
possibilities of answering to these stimuli.
Previous studies focussed on the interstate or interregional income or salary
distribution analysis in Brazil for the 1950-85 period1. As a complementary research,
this study aims to evaluate the dynamics of Brazilian regional development after 1985,
detailing the sector analysis and the spatial product per worker differences in the more
recent period of 1985-95.
2.
Methodological Considerations
The period analyzed (1985-95), was selected with the aim of continuing and
complementing the previous analyses about the dynamics of Brazilian regional
development. As to the empirical evaluation, the analysis aimed to verify, in greater
detail, the sector and regional dynamics and for that, Differentiation Quotients (QDij)
and Dispersion Intensity Coefficients (CIij) were elaborated. These indexes, which are
defined below, were calculated based on two variables, the Gross Domestic Product and
the Working Population, estimated respectively by IPEA and IBGE2.
Williamson Inequality Index
___________________
√
∑
i (yi - yNac)2 fj / nVW = ____________________
yNa
1
A summarized version ot these studies is found in Kon (1997). 2
where: f = population of the region i; n = national population; yi = per capita income of
region i; yNat = national per capita income; N = number of regions.
Dispersion Intensity Coefficient
The CI is a measurement of the intensity of the regional participation differentials of a
variable and is calculated by the expression:
n
CIj =
∑
½ QDj - 1 ½j=1
The CI for different years are compared, and the dispersions which are more distant
from zero are considered more intense, because the null coefficients indicate that all the
regions present the same participation as the national average for that period.
Considering (∆ +) = (QDj - 1) > 1 e (∆ -) = (QDj - 1) < 1, there are regions which
present per capita product differences below or above the national average, in one period. The CI is also used to measure the sector intensity of dispersions, that is:
n
CIij =
∑
½ QDij - 1 ½ j=1Regional Differentiation Quotient of the per capita GDP (QDj)
QDj = Xr /XBR,
where Xr = GDP/capita for region r; XBR = GDP/capita for Brazil
Sector and Regional Differentiation Quotient (QDij)
Xi = working persons (or GDP) in sector i in the country; X = working persons (or
GDP) in the country; Xij = working persons (or GDP) in region j and in sector i; and
Xj = workingpersons (or GDP) in region j. Then,
The QDij measures the spatial differentiation representativity of sector i in region j,
relative to the national average. The interpretation of the QDij is made according to the
following considerations: a) QDij < 1, sector i is less representative in region j, when
compared to the national average representativity; b) QDij > 1, sector i is more
representative in region j if compared to the global national space.
Regional Productivity Index (IPR)
The GDP/working-person relation was used as a proxy variable to evaluate the regional productivity, in view of the lack of more appropriate statistical information.
The IPR was calculated from two different approaches:
a) IPRBR, where each sector productivity in each region is compared to the global
productivity of the country, that is: IPRBR = Pij/PBR, where Pij is the productivity of
sector i in region j and PBR is the global productivity in Brazil;
b) IPRS, where each sector productivity in each region is compared to the global sector
productivity, that is IPRS = Pij/ PS;
3.
Brazilian regional inequalities
The VW and Cij values for the per capita product inequalities of Brazilian
regions are shown on Table 1. It should be observed that the regions’ delimitation
follows the IBGE (Brazilian Geography and Statistic Institute) classification used for
the PNADs (National Research by Domicile Sample), in view of the compatibility with
the information about working persons, which will be used at a later stage. The
calculations done using those data will present a slight difference when based on
information separated according to Brazilian states or aggregated regions, as it was also
present a magnitude which can interfere in the results of the analysis of inequality
differences.
The Williamson indexes show a slow trend towards regional convergence
between the years 1985 and 1990, continuing in the direction revealed by estimates
made by Souza (1993) for a historical series previous to 1985. However, for 1992 to
1995, a change towards a greater divergence is observed in the trend, albeit in a not
Table 1
Regional per capta GDP inequalities indexes - Brazil - 1985-95
Years VW CIj ∑∆ + ∑∆ -
1985 0.44588 1.92907 1.16 0.77
1986 0.44522 1.99933 1.19 0.81
1987 0.44145 1.93631 1.16 0.79
1988 0.43661 1.90450 1.17 0.73
1989 0.42804 1.86087 1.16 0.70
1990 0.42370 1.83784 1.14 0.70
1992 0.43101 1.81166 1.10 0.71
1993 0.43696 1.79234 1.07 0.72
1995 0.43793 1.78601 1.05 0.74
Primary data sources: IPEA. Author’s elaboration.
significant degree. The estimate of the regional dispersion intensities in relation to the
average (CIj) shows a trend of regional convergence in the whole period. The positive
dispersions (
∆
+), as related to the average, are always higher than the negative ones (∆
), that is, the magnitude of the dispersions in the regions which present a per capita
GDP superior to the average, is higher that in the regions which show a GDP inferior to
the national average. However, the
∑∆
+ reveal a constantly decreasing trend from1986 on, while the
∑∆
- tend to decrease until 1990, that is, to converge, and to divergefrom 1992 to 1995. This tendency has been unfavorable to the less developed regions in
the last years. A more detailed analysis of the regional development evolution as
Differentiation Quotients (QDj) presented in Table 2. The regional differences in the
per capita GDP are considerable, as much in the magnitude of dispersions as in the direction of convergence or divergence in the whole period. First, it can be verified that
the regions of Rio de Janeiro, São Paulo and the South present a development indicator
which is constantly superior to the national average3; the regions of Minas
Gerais-Espírito Santo and the Northeast always show negative dispersions, that is, a level of
development which is always inferior to the average in the period, while the
Center-West presents negative dispersions between 1985 and 1989 and in 1995, and positive
from 1990 to 1993.
Secondly, when the trends of development are observed, it can be verified that
from 1985 to 1990 the indexes for Rio de Janeiro and São Paulo show a decreasing
dispersion, approaching the national average, and from that year on, another increase in
the positive dispersion, which was not very significant in São Paulo. In the case of Rio
de Janeiro, specifically, the trend towards divergence was greater and it was more
marked in 1992, and it is possible to infer that the event of the World Meeting ECO-92,
which brought participants from all over the world, contributed to increasing the
dynamics of product generation. In the South, the trend shows positive divergence as
related to the national average, except in the years of 1988 and 1989.The Center-West
region had a different behavior in comparison with the others, because despite having
always been closer to the national average, from 1985 to 1989 it presented negative
divergences, that is, indexes lower than the average (though tending to convergence)
and from 1990 to 1993, positive divergences. The region which encompasses the states
of Minas Gerais and Espírito Santo, despite showing a considerable dynamism (marked
by some economic sector data), presents a development indicative constantly below the
national average, in view of the high concentration of workers which exert informal or
3
by own-account occupations, with low productivity levels. From 1986 to 1989, the QDij
in that space present a trend towards increased divergence, while in the following
period, from 1990 to 1993, the indexes remained constant with a dispersion level not
significantly inferior. As regards the Northeast region, which presents the most marked
negative divergences, the dispersion magnitudes were almost constant in the period,
with a slight trend towards approaching the national average.
An additional observation calls attention to the high level of disparity between
the most developed region of São Paulo and the less developed of the Northeast. The
convergence movements in relation to the average, which were observed in the last
years, did not show a sufficient magnitude to alter the
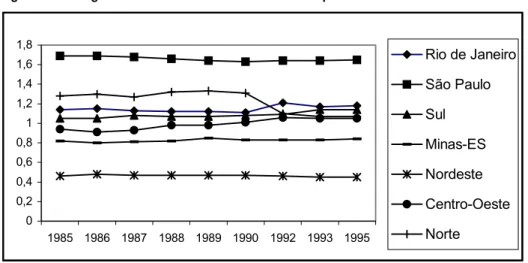
Table 2
Regional differences in the Brazilian GDP/capta evolution - 1985-1995
Years RJ SP Sul MG- NE C-O N
ES QDj
1985 1.14 1.69 1.05 0.82 0.46 0.94 1.28
1986 1.15 1.69 1.05 0.80 0.48 0.91 1.30
1987 1.13 1.68 1.08 0.81 0.47 0.93 1.27
1988 1.12 1.66 1.07 0.82 0.47 0.98 1.32
1989 1.12 1.64 1.07 0.85 0.47 0.98 1.33
1990 1.11 1.63 1.08 0.83 0.47 1.01 1.31
1992 1.21 1.64 1.09 0.83 0.46 1.06 1.10
1993 1.17 1.64 1.14 0.83 0.45 1.05 1.07
1995 1.18 1.65 1.14 0.84 0.45 1.05 1.07
∆+ ou ∆
-1985 +0.14 +0.69 +0.05 -0.18 -0.53 -0.06 +0.28
1986 +0.15 +0.69 +0.05 -0.20 -0.52 -0.09 +0.30
1987 +0.13 +0.68 +0.08 -0.19 -0.53 -0.07 +0.27
1988 +0.12 +0.66 +0.07 -0.18 -0.53 -0.02 +0.32
1989 +0.12 +0.64 +0.07 -0.15 -0.53 -0.02 +0.33
1990 +0.11 +0.63 +0.08 -0.17 -0.53 +0.01 +0.31
1992 +0.21 +0.64 +0.09 -0.17 -0.54 +0.06 +0.10
1993 +0.17 +0.64 +0.14 -0.17 -0.55 +0.05 +0.07
1995 +0.18 +0.65 +0.14 -0.16 -0.55 -0.97 +0.08
Primary data sources: IPEA; IBGE/PNADs. Author’s elaboration.
considerable gap in development between these two regions. Former researches (Kon
1992 and 1995) provide a basis for the formulation of the hypothesis that the productive
structuring and the level of qualification of the labor force, which are regionally
differentiated in Brazil, are determinant factors of the level and speed of spatial
dispersions in development. The analysis of the sector regional product dispersion
indicatives and of the working population, which will be carried out further on, permits
a more detailed observation of the determinants of the differences in regional
development dynamics.
4. Regional dispersion of sector product and labor
As previously analyzed (Kon 1995: Chapter 1), the regional productive
structures present specificities which result from the association of historical and
geographical determinants, together with the human, natural and capital resources base,
and also with the macrosocial base
compounded by cultural, political, participationFigure 1 - Regional differences in the Brazilian GDP/capita evolution - 1985-1995
Primary data sources: IPEA; IBGE. 0
0,2 0,4 0,6 0,8 1 1,2 1,4 1,6 1,8
1985 1986 1987 1988 1989 1990 1992 1993 1995
Rio de Janeiro
São Paulo
Sul
Minas-ES
Nordeste
Centro-Oeste
Norte 0
0,2 0,4 0,6 0,8 1 1,2 1,4 1,6 1,8
1985 1986 1987 1988 1989 1990 1992 1993 1995
Rio de Janeiro
São Paulo
Sul
Minas-ES
Nordeste
Centro-Oeste
and economically differentiated systems
which define diverse spatial specializations.Those differences constitute a mass of factors that are determinant in the variations in
the levels and speed of regional evolution of the per capita GDP. The observation of the Regional Differentiation quotients according to the sectors, shown in Tables 3a and
3b, reveals these considerable differences in the regions’ specializations as regional
inequalities determinants. Those indicatives show the degree of specialization of a
region
Table 3 a
GDP Regional Differentiation Quotients (QDij) and Intensity of Dispersion Coefficients (CIj) - Primary and Secondary Sectors.
Brazil – 1985, 1990, 1995
QDij CIj
______________________________________________________
Sectors RJ SP SUL MG-ES NE C-O N
______________________________________________________________
PRIMARY
1985 0.15 0.46 1.55 1.74 1.49 1.46 1.46 4.08 1990 0.16 0.64 1.40 1.45 1.49 1.20 1.69 3.42 1995 0.16 0.57 1.32 1.53 1.67 1.19 1.69 3.67 SECONDARY
Manufacturing
1985 0.89 1.40 0.94 0.89 0.62 0.25 0.75 2.40 1990 0.65 1.46 1.03 1.03 0.54 0.21 0.68 2.88 1995 0.57 1.53 0.97 1.02 0.49 0.19 0.65 3.19 Construction
1985 1.82 0.23 0.59 0.57 2.45 1.40 2.80 6.07 1990 1.58 0.25 0.58 0.76 2.30 1.89 2.23 5.42 1995 1.41 0.20 1.24 0.59 1.92 2.06 2.14 4.97 Other
1985 0.82 0.94 1.07 1.49 0.99 0.58 0.99 1.25 1990 0.87 0.85 1.20 1.59 0.97 0.57 1.10 1.62 1995 0.67 0.83 1.46 1.51 0.89 0.61 1.10 2.07 Total
1985 1.00 1.22 0.90 0.88 0.87 0.41 1.03 1.19 1990 0.84 1.18 0.95 1.02 0.91 0.56 1.01 0.94 1995 0.75 1.16 1.08 1.00 0.83 0.63 1.01 1.05
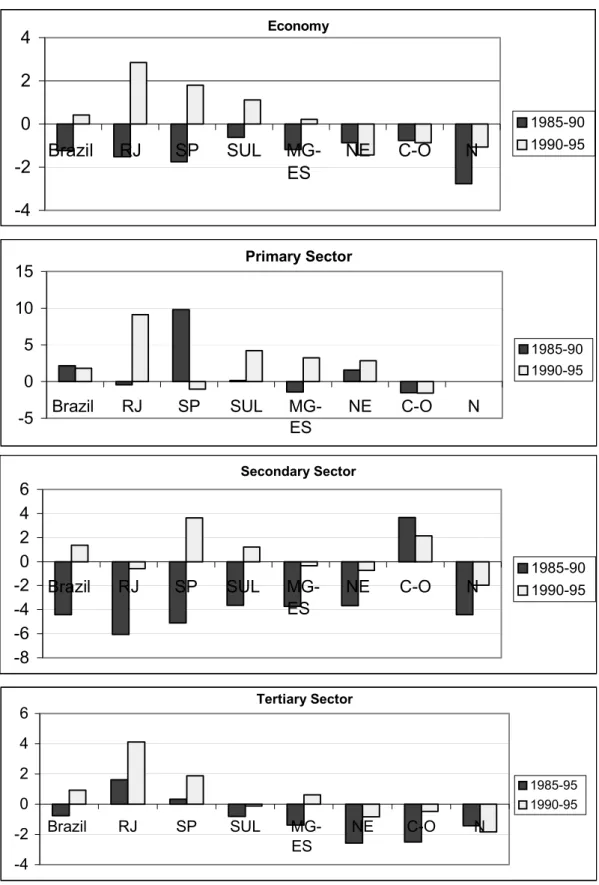
Gráfico1
Brazilian Differentiation Indexes - Workers (W) and GDP - 1985, 1990, 1995
Primary data source: IBGE-PNADs and IPEA. Author's elaboration.
Primary Sector - W
-1 -0,5 0 0,5 1
RJ SP SUL MG-ES NE C-O N R e giõe s 1995 1990 1985
Primary Sector - GDP
-1,00 0,00 1,00 2,00
RJ SP SUL MG-ES NE C-O N Regiões 1995 1990 1985
Secondary Sector - W
-0,5 0 0,5 1
RJ SP SUL MG-ES NE C-O N R e giõe s 1995 1990 1985
Secondary Sector - GDP
-1 -0,5 0 0,5
RJ SP SUL MG-ES NE C-O N Regiões 1995 1990 1985
Tertiary Sector - W
-0,4 -0,2 0 0,2 0,4 0,6 RJ SP SUL MG-ES NE C-O N R e giõe s 1995 1990 1985
Tertiary Sector - GDP
-0,2 0 0,2 0,4 0,6
RJ SP SUL MG-ES NE C-O N Regiões 1995 1990 1985 Primary Sector - W
-1 -0,5 0 0,5 1
RJ SP SUL MG-ES NE C-O N R e giõe s 1995 1990 1985
Primary Sector - GDP
-1,00 0,00 1,00 2,00
RJ SP SUL MG-ES NE C-O N Regiões 1995 1990 1985
Secondary Sector - W
-0,5 0 0,5 1
RJ SP SUL MG-ES NE C-O N R e giõe s 1995 1990 1985
Secondary Sector - GDP
-1 -0,5 0 0,5
RJ SP SUL MG-ES NE C-O N Regiões 1995 1990 1985
Tertiary Sector - W
-0,4 -0,2 0 0,2 0,4 0,6 RJ SP SUL MG-ES NE C-O N R e giõe s 1995 1990 1985
Tertiary Sector - GDP
-0,2 0 0,2 0,4 0,6
in a specific sector, when compared to the country as a whole. On examining first the
results of trends for the sector product Intensity Dispersion Coefficients for the regions
as a whole (CIj), it is inferred that from 1985 to 1995, there was a trend towards
increased inequality, that is, towards a higher concentration in specific sectors, when
compared to the national average, for the regions of Rio de Janeiro, São Paulo, the
South and the Northeast, and a trend towards a higher approximation to the average in
the regions of Minas Gerais and Espírito Santo and in the Center-West. However, the
regions of Rio de Janeiro, the Center-West and the North present the highest CIj
(among 4 and 5,3). Specifically in Rio de Janeiro, the degree of sector inequalities
shows a significant increase from 1985 to 1995, particularly due to the growing
participation in the product generation of the Public Administration sector, as compared
to the other sectors and to the rest of the country in 1995. In the Center-West, the trends
towards positive distance from the national average participation occurred more
significantly in the Construction sector and less significantly in the sector classified as
Other Industrial Activities (which encompass Mineral extraction and public utility
industrial services); in the other sectors, the trend moved towards the decrease of
regional differences in participation. On the other hand, in the North the significant
increase in the positive concentration of the generated product occurred in the Primary
sector, in other industrial activities and in renting product, while a trend towards
convergence was observed in the other sectors (Table 3 a)
When each sector is analyzed separately as to the differences in relation to the
average participation, the regions of Rio de Janeiro and São Paulo, which present the
highest level of development, show - proportionally - the lowest product participation
in the Primary sector, in relation to the average participation of this sector in the other
Table 3b
GDP Regional Differentiation Quotients (QDij) and Intensity of Dispersion Coefficients (CIj e CIi) - Tertiary Sector.
Brazil and regions- 1985, 1990, 1995.
QDij CIj
_________________________________________________
Sectors RJ SP SUL MG-ES NE C-O N
_____________________________________________________________________ TERTIARY
Commerce
1985 0.87 0.90 1.10 1.00 1.22 0.97 1.16 0.74 1990 0.76 0.86 1.41 0.96 1.18 0.91 0.95 1.16 1995 0.81 0.92 1.22 0.96 1.23 0.85 0.93 0.97 Transports
1985 0.96 0.98 1.30 1.32 0.66 0.82 0.60 1.60 1990 0.86 1.01 1.39 1.32 0.68 0.70 0.60 1.90 1995 0.83 1.11 1.30 1.31 0.61 0.60 0.37 2.32 Communications
1985 1.27 1.10 0.78 0.84 0.90 1.16 0.88 1.12 1990 1.29 1.02 1.00 0.89 0.88 1.05 0.66 0.93 1995 1.32 1.05 0.93 0.89 0.86 1.02 0.77 0.94 Finance Activities
1985 0.98 1.00 1.02 0.92 0.89 1.83 0.44 1.62 1990 1.70 1.06 0.82 0.69 0.78 1.49 0.21 2.75 1995 0.78 1.28 0.87 0.70 0.77 1.51 0.30 2.37 Public Administration
1985 1.50 0.68 0.80 0.78 1.26 2.24 1.31 3.05 1990 1.29 0.77 0.76 0.84 1.20 1.83 1.51 2.46 1995 2.92 0.41 0.66 0.83 1.20 1.79 1.25 4.27 Rents
1985 1.64 0.94 0.78 0.91 0.93 1.06 1.08 1.21 1990 1.19 1.01 0.80 1.07 0.89 1.03 1.24 0.85 1995 1.12 1.17 0.68 0.88 0.82 0.93 1.52 1.49 Other
1985 1.46 0.99 0.84 0.87 0.92 1.21 0.82 1.23 1990 1.31 0.99 0.94 0.94 0.94 1.05 0.79 0.76 1995 1.35 1.06 0.83 0.88 0.96 1.01 0.80 0.94 Total
1985 1.20 0.93 0.96 0.93 1.00 1.43 0.86 0.95 1990 1.28 0.95 0.96 0.90 0.97 1.27 0.86 0.92 1995 1.35 1.00 0.88 0.87 0.94 1.19 0.83 1.02 ____________________________________________________________________ CIj – Economy
1985 4.01 2.38 2.63 2.77 3.51 4.75 4.32 -
1990 4.08 2.20 2.98 2.38 3.49 4.15 4.87 -
1995 5.29 3.28 3.11 2.63 3.62 4.40 4.88 -
degrees, which are significantly superior to the whole Secondary and Tertiary sectors,
and there is a convergent behavior from 1985 to 1990. However, in the next period a
slight increase in the inequalities was noticed, particularly due to the Northeast and to
the region that encompasses Minas Gerais and Espírito Santo (Table 3b).
The Construction sector presented the highest degree in dispersion intensity in
the period (CIj between 5 and 6), tending, however, to a gradual deviation in 1995 in
relation to 1985. It is observed that the pole region of São Paulo, which traditionally
concentrates economic activities, shows in that period the greatest absorption of the
impacts of the uncertainty period and of the downfall of the economic activity, since
the participation of this dynamic sector was considerably below the national average.
Also in the Secondary activities, the Manufacturing Industry also presented a positive
concentration, with a trend towards increased divergence in São Paulo. While in Minas
Gerais and Espírito Santo the participation remained similar to the national average, in
Rio de Janeiro, which traditionally presents a productive structure specialized in this
industry, the negative distance was very significant. In the Tertiary sector the highest
differences in the intensity of dispersion were found in Public Administration (CIj
between 3 and 4), with a global trend towards a positive distance to the national
average
particularly due to Rio de Janeiro, as already seen. As a consequence, the Center-West
region, which is specialized in this sector
in view of the influence of the FederalDistrict
presented a proportional decrease in concentration. On the other hand, thegreater approach to the average and lower participation was verified in São Paulo.
In the service activities, the Financial Activities presented a higher level of positive
participation in the Center-West region, also as a result of the governmental activities,
nevertheless revealing a trend towards convergence to the average. As to the other more
and in 1990. Nevertheless, in 1995, it already presented the highest positive
concentration as a result of the greater product growth rates in the last two years. In the
other regions, a trend towards a considerable negative divergence of the national
average, that is a lower relative share, is noticed.
Still in the Tertiary sector, other considerable divergences were verified in Rio
de Janeiro in the activities called “Other”, which encompass personal, household and
other non specified services (compounded particularly by own-account workers and low
productivity), and in the Communications sector, which shows a considerably distance
from the national average and a positive divergence in this period.
The analysis or the QDij, CIj and CIi indexes based on the working population, showed
in Tables 4a and 4b, reveal several trends of labor division, when compared to the
product generation. Analyzing the Cij first, in all regions, from 1985 to 1990, a dynamic
of convergence and a following divergence direction in 1995 is noticed. Secondly, a
higher degree of intensity of dispersion for Rio de Janeiro (only in 1985) and São Paulo
(in the whole period), when compared to the Product Generation indexes, showing that
the dynamics of worker concentration surpassed the product generation indexes. The
Intensity of Dispersion Coefficients (CIi) show more considerable differences. In the
Primary sector, the total intensity of dispersion of workers’ absorption is significantly
lower than in the case of the generated product; nevertheless, while in the Northeast the
dispersion quotients (QDij) are higher for the product in this sector, in the South and
Minas Gerais-Espírito Santos regions, its magnitude is lower, though it presents a
Table 4a
Occupied Population Regional Differentiation Quotients (QDij) and Intensity of Dispersion Coefficients (CIj) Primary and Secondary Sectors.
Brazil - 1985, 1990, 1995.
QDij Cij * Sectors RJ SP SUL MG-ES NE C-O N*
_______________________________________________________________________ PRIMARY
1985 0.17 0.33 1.34 1.23 1.62 0.94 … 2.76 1990 0.19 0.30 1.34 1.20 1.66 0.99 … 2.73 1995 0.16 0.33 1.16 1.17 1.63 1.10 … 2.58 SECONDARY
Manufacturing
1985 1.09 1.84 0.94 0.69 0.57 0.49 0.86 3.15 1990 1.01 1.77 0.95 0.81 0.60 0.48 0.84 2.83 1995 1.03 1.66 1.23 0.85 0.54 0.57 0.96 2.43
Construction
1985 1.31 1.08 0.79 1.07 0.86 1.17 1.23 1.20 1990 1.07 1.08 0.91 1.10 0.88 1.07 1.09 0.63 1995 1.33 1.12 0.90 1.16 0.78 1.02 1.14 1.09 Others
1985 1.11 0.75 0.83 1.09 0.99 1.69 1.82 2.13 1990 1.08 0.71 0.90 1.21 0.94 1.81 1.35 1.91 1995 1.36 0.75 0.85 1.25 0.99 1.06 1.48 1.55 Total
1985 1.15 1.56 0.89 0.82 0.68 0.75 1.03 1.59 1990 1.03 1.52 0.94 0.92 0.70 0.72 0.94 1.35 1995 1.14 1.44 1.11 0.97 0.64 0.74 1.05 1.37
Table 4b
Regional Differentiation Quotients (QDij) and Intensity of Dispersion Coefficients (CIj and CIi) for the Occupied Population - Tertiary Sector.
Brazil - 1985, 1990, 1995.
QDij Cij * ___________________________________________________
Sector RJ SP SUL MG-ES NE C-O N*
TERTIARY Commerce
1985 1.16 1.15 0.89 0.86 0.89 1.03 1.68 1.38 1990 1.14 1.08 0.94 0.88 0.91 1.03 1.55 1.07 1995 1.13 1.13 0.89 0.86 0.92 0.99 1.66 1.25 Consumer Services
1985 1.50 1.13 0.81 1.09 0.75 1.13 1.09 1.38 1990 1.37 1.04 0.86 1.06 0.85 1.13 1.11 0.99 1995 1.36 1.17 0.86 0.98 0.82 1.08 1.17 1.12
Auxiliary Services
1985 1.68 1.39 0.99 0.77 0.49 1.14 1.18 2.13 1990 1.39 1.50 0.84 0.91 0.54 1.07 1.11 1.78 1995 1.74 1.55 1.00 0.94 0.45 0.87 0.91 2.12 Transports/Communicatios
1985 1.58 1.12 0.92 0.96 0.71 1.03 1.48 1.62 1990 1.51 1.16 0.91 0.97 0.74 0.95 1.27 1.37 1995 1.48 1.27 0.92 1.01 0.72 0.89 1.07 1.30 Social Activities
1985 1.37 1.07 0.84 0.97 0.87 1.15 1.29 1.20 1990 1.34 1.00 0.84 0.97 0.94 1.10 1.27 0.97 1995 1.40 1.09 0.87 0.96 0.88 1.01 1.26 1.04 Public Administration
1985 1.49 0.88 0.77 0.83 0.88 1.68 2.13 2.94 1990 1.21 0.85 0.86 0.77 1.00 1.59 1.87 2.20 1995 1.25 0.90 0.83 0.84 0.94 1.46 2.02 2.23 Others
1985 1.49 1.46 0.93 0.77 0.57 1.08 1.15 1.91 1990 1.21 1.35 0.92 0.87 0.55 1.04 0.91 1.36 1995 1.25 1.46 1.05 0.69 0.57 0.87 0.91 1.73 Total
1985 1.41 1.14 0.85 0.95 0.78 1.15 1.38 1.50 1990 1.32 1.08 0.88 0.95 0.85 1.12 1.31 1.15 1995 1.35 1.16 0.88 0.93 0.83 1.05 1.34 1.27 __________________________________________________________________________ CIj 1985 4.60 3.27 2.40 1.63 3.04 2.66 4.19 -
1990 3.14 3.13 2.14 1.40 2.73 2.43 2.85 -
1995 4.18 3.47 1.76 1.47 3.02 1.54 3.02 - Primary data source: IBGE - PNADs. Author’s elaboration.
(*) Except North rural zone.
In the Secondary sector as a whole, the intensity of dispersion based on
the national average in that period. The highest dispersion is shown in the
Manufacturing Industry, and the degree of workers’ concentration in the most
developed regions of São Paulo (in the whole period) and the South (in 1995) is even
more significant, revealing that product growth had a lower speed than the workers’
absorption, which led to an inferior growth in productivity, as we will see later on.
Nevertheless, the trend in the whole period was one of convergence towards the
national average for these more dynamic regions and a slight divergence for the less
developed ones.
As regards the Construction sector, the region of São Paulo presented QDijs
around 0.20, that is, considerably below the average for the product, and as to workers’
indicatives it is placed near the average, which means that this sector still has the
function of less qualified labor absorption, mainly in a period of low economic
activity. In these activities, from 1990 to 1995 a strong tendency towards positive
divergence in the Southeast and North regions was noticed, and a greater negative
distance from the average only in the Northeast. In the Tertiary activities sector, the
global intensity of dispersion is also higher when based on labor indicatives
presenting, from 1985 to 1990, a dynamic approach to the national average and, in the
following period, a higher positive distance. It should be noticed that in Rio de Janeiro,
all sectors in the whole period present QDij considerably higher than the average.
Meanwhile, the opposite is observed in relation to the Northeast region, that is, almost
all indicatives are lower that one (except Public Administration in 1990). Observing
each Tertiary sector separately, the highest intensities of dispersions are shown in
Public Administration, tending to convergence, and it is verified higher levels of
positive dispersion in the North, Center-West and Rio de Janeiro are verified. The
other regions present QDij which are inferior to the average, but tending to
5. Differences in sector productivities
The analysis of the sector productivity differences among the regions reveals
the diverse technological progress degrees, which have a considerable impact on the
regional dynamics, towards convergence or divergence. Governmental industrial
development policies for the 1985-90 period were not effectively implanted and the
target of technological and scientific modernization was affected by the stabilization
plan. In spite of demand pressure over production as a result of the Plano Cruzado
political measures in 1986, the investments remained at low levels, around 15% of the
GDP a year. As a consequence, as observed in Table 5, the annual rates of growth of
global and regional productivity in the whole country were negative. It was observed
that in the most industrialized regions of São Paulo, Rio de Janeiro and the North the
fall in productivity rates was more intense, because in this period the productivity in
the Secondary sector had the greatest impact in relation to the other sectors. In these
activities, the Manufacturing Industry was responsible for the significantly negative
rates, since in the Construction and in the Other Industrial Activities sectors, a
considerably positive evolution was observed. As to the tertiary activities, though the
annual product showed a growth higher than 3%, the productivity decreased almost
1%, because workers from secondary activities were greatly incorporated to those
services, mainly in low productivity occupations. Nevertheless, in São Paulo and Rio
de Janeiro the evolution of productivity, though low, was still positive. The Tertiary
sector which received more low qualified workers was Commerce, where in all regions
a very high annual productivity fall (among 7,5% and over 11%, except in the South,
where the fall was lower) was observed. Another significantly affected sector was
Transports and Communications, with negative annual rates over 3,5% for almost all
regions. These activities are distinguished as the core of modernization investments in
in the Brazilian technological progress in relation to the industrialized countries was
intensified. After 1985, the fiscal policy practiced was reflected in an increase of 40%
in the federal government real salary payroll, which resulted in a higher
product/worker index, as seen in Table 5.
Table 5
Brazilian Annual Productivity Growth Rates – 1985-1990 e 1990- 1995
Sectors Brazil RJ SP SUL MG-ES NE C-O N * _________________________________________________________________________
PRIMARY
1985-90 2.15 (0.46) 9.78 0.16 (1.40) 1.59 (1.52) …
1990-95 1.81 9.13 (1.03) 4.23 3.23 2.85 (1.57) ...
SECONDARY Manufacturing
1985-90 (6.57) (11.39) (5.58) (4.55) (6.86) (9.29) (8.46) (9.22)
1990-95 0.29 (0.08) 4.05 (5.57) (1.05) (1.58) (5.47) (3.87)
Construction
1985-90 2.76 3.83 3.22 (0.10) 8.15 1.29 12.49 (0.93)
1990-95 (0.26) (4.76) (3.60) 16.79 (6.41) (3.47) 1.15 (3.92)
Other
1985-90 6.72 7.71 5.15 8.15 5.57 8.60 5.64 13.17
1990-95 14.77 6.88 14.50 20.65 12.91 9.47 28.18 11.33
Total
1985-90 (4.41) (6.06) (5.10) (3.63) (3.71) (3.65) 3.66 (4.40)
1990-95 1.35 (0.57) 3.63 1.21 (0.33) (0.72) 2.13 (1.96)
TERTIARY Commerce
1985-90 (7.68) (10.34) (7.95) (3.47) (9.03) (8.63) (8.01) (11.14)
1990-95 (2.48) 1.60 (0.68) (3.70) (2.38) (3.67) (3.85) (5.87)
Transports/Communications
1985-90 (3.27) (3.70) (4.33) (0.90) (3.75) (3.32) (3.50) (3.42)
1990-95 2.62 5.05 3.97 1.80 1.53 (0.71) 0.46 (0.85)
Public Administration
1985-90 5.20 6.64 8.46 2.90 9.05 2.30 1.69 8.89
1990-95 (2.97) 16.26 (14.3) (4.02) (5.07) (3.63) (3.34) (9.32)
Other
1985-90 (0.13) 3.64 1.45 (0.89) (0.97) (2.51) (3.06) (2.74)
1990-95 3.07 (0.55) 5.14 2.07 2.95 2.01 2.12 4.84
Total
1985-90 (0.77) 1.62 0.33 (0.82) (1.37) (2.58) (2.49) (1.43)
1990-95 0.93 4.13 1.89 (0.13) 0.62 (0.84) (0.47) (1.83)
TOTAL
1985-90 (1.23) (1.51) (1.75) (0.62) (1.18) (0.86) (0.76) (2.76)
Gráfico 2
Brazilian Annual Productivity Growth Rates - 1985-90 and 1990-95
Source: IBGE and IPEA. Author's elaboration.
Primary Sector -5 0 5 10 15
Brazil RJ SP SUL MG-ES
NE C-O N
1985-90 1990-95 Secondary Sector -8 -6 -4 -2 0 2 4 6
Brazil RJ SP SUL MG-ES
NE C-O N
1985-90 1990-95 Tertiary Sector -4 -2 0 2 4 6
Brazil RJ SP SUL MG-ES
NE C-O N
1985-95 1990-95 Economy -4 -2 0 2 4
Brazil RJ SP SUL MG-ES
NE C-O N
1985-90 1990-95 Primary Sector -5 0 5 10 15
Brazil RJ SP SUL MG-ES
NE C-O N
1985-90 1990-95 Secondary Sector -8 -6 -4 -2 0 2 4 6
Brazil RJ SP SUL MG-ES
NE C-O N
1985-90 1990-95 Tertiary Sector -4 -2 0 2 4 6
Brazil RJ SP SUL MG-ES
NE C-O N
1985-95 1990-95 Economy -4 -2 0 2 4
Brazil RJ SP SUL MG-ES
NE C-O N
1985-90
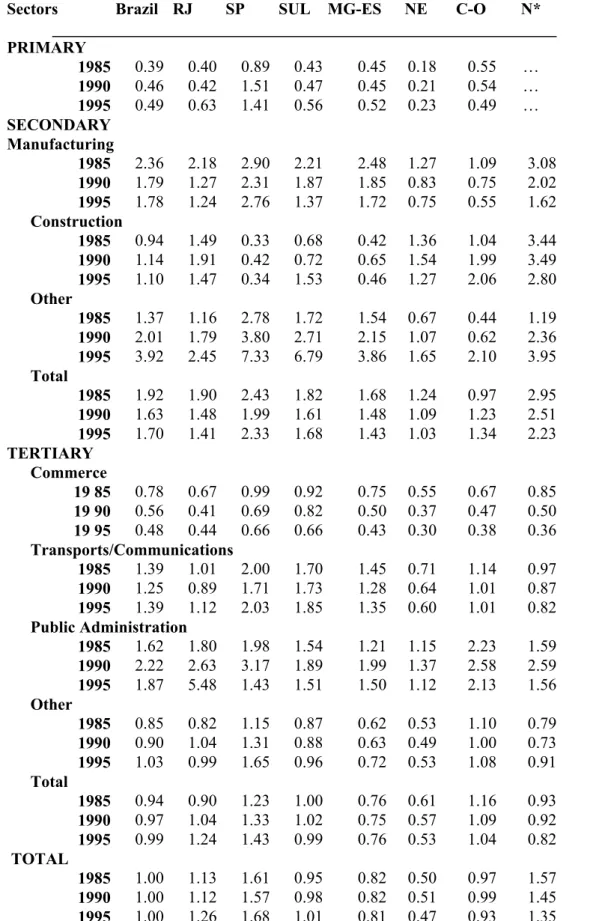
Table 6 - Global Sector Productivity Indexes (IPRBR)
Brazil and regions -1985, 1990, 1995
Sectors Brazil RJ SP SUL MG-ES NE C-O N* _____________________________________________________________ PRIMARY
1985 0.39 0.40 0.89 0.43 0.45 0.18 0.55 …
1990 0.46 0.42 1.51 0.47 0.45 0.21 0.54 …
1995 0.49 0.63 1.41 0.56 0.52 0.23 0.49 …
SECONDARY Manufacturing
1985 2.36 2.18 2.90 2.21 2.48 1.27 1.09 3.08
1990 1.79 1.27 2.31 1.87 1.85 0.83 0.75 2.02
1995 1.78 1.24 2.76 1.37 1.72 0.75 0.55 1.62
Construction
1985 0.94 1.49 0.33 0.68 0.42 1.36 1.04 3.44
1990 1.14 1.91 0.42 0.72 0.65 1.54 1.99 3.49
1995 1.10 1.47 0.34 1.53 0.46 1.27 2.06 2.80
Other
1985 1.37 1.16 2.78 1.72 1.54 0.67 0.44 1.19
1990 2.01 1.79 3.80 2.71 2.15 1.07 0.62 2.36
1995 3.92 2.45 7.33 6.79 3.86 1.65 2.10 3.95
Total
1985 1.92 1.90 2.43 1.82 1.68 1.24 0.97 2.95
1990 1.63 1.48 1.99 1.61 1.48 1.09 1.23 2.51
1995 1.70 1.41 2.33 1.68 1.43 1.03 1.34 2.23
TERTIARY Commerce
19 85 0.78 0.67 0.99 0.92 0.75 0.55 0.67 0.85
19 90 0.56 0.41 0.69 0.82 0.50 0.37 0.47 0.50
19 95 0.48 0.44 0.66 0.66 0.43 0.30 0.38 0.36
Transports/Communications
1985 1.39 1.01 2.00 1.70 1.45 0.71 1.14 0.97
1990 1.25 0.89 1.71 1.73 1.28 0.64 1.01 0.87
1995 1.39 1.12 2.03 1.85 1.35 0.60 1.01 0.82
Public Administration
1985 1.62 1.80 1.98 1.54 1.21 1.15 2.23 1.59
1990 2.22 2.63 3.17 1.89 1.99 1.37 2.58 2.59
1995 1.87 5.48 1.43 1.51 1.50 1.12 2.13 1.56
Other
1985 0.85 0.82 1.15 0.87 0.62 0.53 1.10 0.79
1990 0.90 1.04 1.31 0.88 0.63 0.49 1.00 0.73
1995 1.03 0.99 1.65 0.96 0.72 0.53 1.08 0.91
Total
1985 0.94 0.90 1.23 1.00 0.76 0.61 1.16 0.93
1990 0.97 1.04 1.33 1.02 0.75 0.57 1.09 0.92
1995 0.99 1.24 1.43 0.99 0.76 0.53 1.04 0.82
TOTAL
1985 1.00 1.13 1.61 0.95 0.82 0.50 0.97 1.57
1990 1.00 1.12 1.57 0.98 0.82 0.51 0.99 1.45
In the 1990-95 period, the productivity behavior reflected two different moments
of the Brazilian economic dynamics: the first phase corresponding to the Collor Plan, of
stagnation and annual growth product rate fall, mainly in 1992; after this, a phase of
recovering, when the economy was kept on a restrained growth path, in face of the
stabilization policies after 1993. However, in this period, the productive investment rate
does not suffer great alterations and the country’s Gross Capital Formation was
maintained around 15 to 16%, which was insufficient for considerable technological
development. In this period, the behavior of productivity, which for the whole country
presented some rates around zero, was diverse among regions, since the Northeast, the
Center-West and the North still showed a relative fall, while the other regions already
presented some growth, though not very significant. In the second phase of this period,
the enterprises’ restructuring was more intense, through organizational and productive
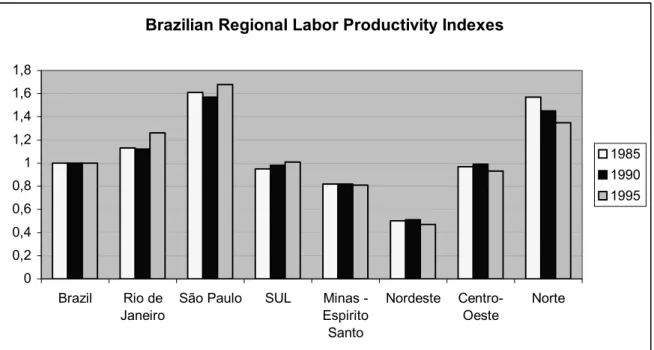
process changes, with the elimination of jobs and the growth of the capital/ work Gráfico 3
Primary data sources: IPEA; IBGE-PNADs. Author’s elaboration. Brazilian Regional Labor Productivity Indexes
0 0,2 0,4 0,6 0,8 1 1,2 1,4 1,6 1,8
Brazil Rio de Janeiro
São Paulo SUL Minas -Espirito Santo Nordeste Centro-Oeste Norte 1985 1990 1995 Brazilian Regional Labor Productivity Indexes
0 0,2 0,4 0,6 0,8 1 1,2 1,4 1,6 1,8
Brazil Rio de Janeiro
relation in many sectors, in search of domestic and international competitivity, spurred
by the opening to imports. Nevertheless, the rhythm of transformation was still slow, as
observed from the growth rates for product/worker. The Manufacturing Industry in São
Paulo showed some recuperation in productivity, but in the other regions negative rates
were still observed. Productivity was also constant in the Construction sector in almost
all regions, except in the South. However, for the Other Industrial Activities, the growth
in productivity was considerably significant, but the participation of these activities in
the global product in each region has little significance (though from 1985 to 1994 this
share had increased from 2 to 5%).
However, it should be observed that the Manufacturing Industry for Brazil as a
whole, which contributed with around 35% to the GDP, constantly and gradually lost
its participation and in 1994 was participating with 21% to product generation (Silva
and other, 1996:89). This loss mainly occurred in the more industrialized regions of
São Paulo, Rio de Janeiro and the South, where the concentration of these activities is
more significant: the share in 1985 was respectively around 49% and 31% in the two
first regions, and in the South it ranked from 41% in the state Santa Catarina to 34%
in the state of Rio Grande do Sul. In 1994, the participation is around, respectively,
33%, 12%, 26% and 23%. So, the trend to convergence in development was largely
due to the loss of product generation in these industries, which presented a
considerable weight in income generation.
On the other hand, the participation of service activities for the whole country
gradually increased from around 47% in 1985 to 54% in 1994, mainly because of the
participation of Other Services, which include personal, household, repair and other
services, where a great increase was observed, respectively, in the autonomous and
non-protected (with legal protection) occupations. This increase was also marked in the most
of the Northeast. Nevertheless, in view of the lower average productivity level of these
activities, the impacts over the trends towards regional differences are also smaller.
As seen in Table 6
which shows the product/worker relation for each sectorand region, and the country’s global average productivity (corresponding to index 1)
the Brazilian Primary sector presented a productivity level which was 61% below the
national one in 1985, though revealing a growth trend, because in 1995 it reached 50%.
In the case of the Secondary sector, the positive dispersion in relation to the average
(92% in 1985) presented a considerable fall until the end of the period (to 70%). This
loss was due to the Manufacturing Industry activities, whose productivity was 136%
above the global national average in 1985 and in 1995 was 78%. In the other secondary
activities a growth in this index was observed in the period, more intense in the Other
Industrial Activities sector, mainly in relation to public utility industries. The reasons
for this growth in these services were related to the shrinkage of the jobs in those
sectors through outsourcing, and new contracts for these services, which were produced
in other sectors by private enterprises or autonomous workers. In the Tertiary activities
sector, the global average productivity was placed not significantly below the global
national average, however the Transport/Communications and Public Administration
activities presented indexes respectively 39% and 87% above the national productivity
in 1995; specifically this last sector revealed a considerable productivity growth since
the beginning of the analyzed period. The sector with the most negative dispersion was
Commerce, where the productivity in 1985 was around 22% below the national average.
This difference increased in the period and in 1995 represented only 52% of the
average. It is clear that in the period a large part of the workers formerly placed in
industry and other more dynamic service sectors, which decreased the job offer, applied
themselves to Commerce activities which revealed low rentability; and this occurred
From the regional point of view, it is noticed that for the Primary sector the
product/worker in São Paulo and Northeast present considerably different indexes as
related to the country’s total for each of these activities. In the first region, the
productivity shows an increasing trend and about 40% above the global average for
Brazil, while in the other region, though also tending to convergence, the index was still
placed about 77% below the average.
The Secondary sector also presented significant regional differences in productivity. In
São Paulo and the North the indexes were about 120 and 130% higher than for the
whole country in 1995, though a movement towards convergence (with decreasing
productivity) between 1985 and 1990 and towards divergence in the last period was
observed. For all the regions, the Manufacturing Industry revealed a tendency towards
convergence to the national average, owing to the relative decrease of these indexes.
However, the activities classified as Other presented the highest index increase in all
regions, but mainly in São Paulo and in the South, in consequence of the modernization
of public utility services. Only in the Northeast was this index below that of these
activities for Brazil as a whole, though it was placed about 65% above the national
average, at the end of the period. In the Services sector also, the most advanced regions
of Rio de Janeiro and São Paulo presented a trend towards an increase in
product/worker. At the end of the period it was placed respectively around 24% and
43% above the global average, while the South and the Center-West regions were
around the average and the other regions significantly below, particularly the Northeast.
From a regional point of view, the sectors which presented productivity indexes higher
than 1 were Transports and Communications (except in the Northeast and the North)
and Public Administration. For the Transport activities, an homogeneous direction of
Table 7 - Sector Productivity Index (IPS) according to the regions -1985, 1990, 1995.
1985 1.00 1.04 2.32 1.13 1.18 0.47 1.43 …
1990 1.00 0.91 3.32 1.02 0.99 0.45 1.19 …
1995 1.00 1.29 2.89 1.15 1.06 0.48 1.00 …
SECONDARY Manufacturing
1985 1.00 0.92 1.23 0.94 1.05 0.54 0.46 1.30
1990 1.00 0.71 1.29 1.04 1.03 0.46 0.42 1.13
1995 1.00 0.70 1.55 0.77 0.97 0.42 0.31 0.91
Construction
1985 1.00 1.59 0.36 0.73 0.44 1.46 1.11 3.67
1990 1.00 1.67 0.36 0.63 0.57 1.35 1.74 3.06
1995 1.00 1.33 0.31 1.39 0.42 1.15 1.87 2.54
Other
1985 1.00 0.85 2.04 1.26 1.13 0.49 0.32 0.87
1990 1.00 0.89 1.89 1.35 1.07 0.53 0.31 1.17
1995 1.00 0.62 1.87 1.73 0.99 0.42 0.54 1.01
Total
1985 1.00 0.99 1.27 0.95 0.88 0.65 0.50 1.54
1990 1.00 0.91 1.22 0.99 0.91 0.67 0.76 1.54
1995 1.00 0.83 1.37 0.98 0.84 0.61 0.78 1.31
TERTIARY Commerce
1985 1.00 0.86 1.27 1.17 0.96 0.70 0.86 1.09
1990 1.00 0.74 1.25 1.47 0.89 0.67 0.85 0.90
1995 1.00 0.91 1.37 1.38 0.90 0.63 0.79 0.76
Transports/Communications
1985 1.00 0.73 1.45 1.23 1.05 0.51 0.82 0.70
1990 1.00 0.72 1.37 1.39 1.02 0.51 0.81 0.70
1995 1.00 0.80 1.46 1.33 0.97 0.43 0.73 0.59
Public Administration
1985 1.00 1.11 1.22 0.95 0.75 0.71 1.37 0.98
1990 1.00 1.19 1.43 0.85 0.90 0.62 1.16 1.17
1995 1.00 2.93 0.77 0.81 0.80 0.60 1.14 0.83
Other
1985 1.00 0.96 1.35 1.02 0.73 0.62 1.28 0.93
1990 1.00 1.16 1.46 0.98 0.70 0.55 1.11 0.81
1995 1.00 0.97 1.61 0.93 0.70 0.52 1.06 0.89
Total
1985 1.00 0.95 1.31 1.06 0.80 0.64 1.23 0.99
1990 1.00 1.07 1.38 1.05 0.78 0.59 1.13 0.95
1995 1.00 1.26 1.45 1.00 0.77 0.54 1.05 0.83
TOTAL
1985 1.00 1.13 1.61 0.95 0.82 0.50 0.97 1.57
1990 1.00 1.12 1.57 0.98 0.82 0.51 0.99 1.45
1995 1.00 1.26 1.68 1.01 0.81 0.47 0.93 1.35
Primary data sources: IPEA and IBGE/PNADs. Author’s elaboration. *Urban zone.
behavior in all regions was not verified in the period, but for Public Administration, in
almost all regions in the period 1985-90, there was a trend towards an increase in the
through the decrease of the index (except in Rio de Janeiro), though it was still
maintained above 1.
The exam of the product/worker indicatives, taking into account the average and
the regional differences in each sector separately, as shown in Table 7, permits the
observation of some relevant differences in the average degree of regional technological
progress in a same group of activities. In that manner, for the Primary sector, there are
clearly observable differences in the technological processes between the most
advanced region of São Paulo
with a productivity in 1995 which was almost 190%above the Brazilian average for these activities
and the less developed of theNortheast, which was 52% below. For the secondary activities sector as a whole, the
North and São Paulo regions revealed indexes about 30% above the global sector
average, though with different tendencies in the period, that is, of increase in the
difference for the latter and of decrease for the former.
While the Northeast and Center-West regions presented indexes about 20% and
40% below, the other were placed around the average. In the Manufacturing Industry
the advantages of São Paulo as to technological development are evident and
increasing, and the product/worker in 1995 reached around 55% of positive difference
in relation to the
sector average. For the other regions, the North and the states of Minas Gerais and
Espírito Santo approached the average (though with negative differences), while the
Northeast and the Center-West presented indexes respectively 58% and 70% below. As
regards the Construction sector the situation is diverse, because the highest productivity
is found in Rio de Janeiro, the Northeast, the Center-West and the North, while in São
Paulo and in Minas Gerais and Espírito Santo regions they are about 60% and 70%
below the sector average. In the Other Activities, São Paulo and the South regions
while Minas Gerais, Espírito Santo and North regions are placed around the average,
the other regions are about 40% to 60% below.
Tertiary activity indexes, as a whole, also show that the most advanced regions
of Rio de Janeiro and São Paulo presented a trend towards positive divergence, and at
the end of the period presented, respectively, indexes about 26% and 45% higher;
nevertheless, the Center-West region also revealed an index above 20% positive in
1985, but with a marked trend towards convergence. Among the other regions, the
Northeast continues to present the most unfavorable situation, with productivity 45%
below the average of the Tertiary sector.
The regional behaviors for the different sectors, show a general trend for the
region of São Paulo to present indexes among 25% to 60% above the respective average
in each sector, except for Public administration in 1995, when a negative difference of
almost 30% is noted. In the other extreme, the Northeast region presented differences
among 30% to 60% below the respective average in each service sector for the whole
examined period. The other regions presented diverse situations: in Commerce, the
Center-West and Rio de Janeiro had productivity levels around 15% to 25% below the
average and the others were placed around the unity. In Transports and
Communications, the South region showed a positive advantage of 30% above, Minas
Gerais and Espírito Santo were situated around the average and the other regions
presented disadvantages between 20% and 40%. Public Administration showed the
highest productivity in Rio de Janeiro and the Center-West (owing to the Federal
Capital) and in the other regions the indexes were about 20% inferior to the sector
average.
Economic policies adopted by the government in the 1980-95 period, aiming
mainly at economic stabilization, had considerable repercussions over the Brazilian
economy as a whole, but interfering with different intensities and speeds over the
dynamics of each social and economic specific space. In this period, Brazilian economy
also faced the need to increase domestic and international competitivity, and to
accompany the acceleration of technological progress and economic globalization,
which had been restricted to a technological and organizational restructuring in
enterprises in most of the countries. Regional dynamics was impelled by many factors,
which act in order to accelerate, to retard or decrease the specific growth rates in the
various economic spaces inside the country. For this behavior, on the one hand there
contributed structural aspects related to material and human resources availability, and
to specific cultural and political conditions in each space (Kon, 1995); on the other
hand, conjuncture situations also had repercussions with different results and intensities
in the diverse social and economic realities. Macro and microeconomic policies aiming
at economic stabilization, or at stimulating specific sectors, had differentiated effects in
each region, according to the possibility of structural and conjuncture answer to these
stimuli.
The Williamson index, which determines the convergence or divergence in the
regional development, based on the per capita GDP, shows a global trend to
convergence for the period 1985-90 towards the national average and in the next period,
to divergence. In the first period, the economic policies aiming at containing the fast
growth of inflation (which veered towards hyperinflation) contributed to the decrease in
the dynamism of the Manufacturing industries, which are concentrated in the most
advanced regions, and made possible a certain degree of product generation
decentralization. The growth of divergence in the next period can be ascribed to the
intense impacts on the pole regions, better supplied with economic substructure and
agglomeration economies. However, the Intensity of Dispersion Coefficient, for the
whole period, shows a directions towards convergence from 1986 on (in the year of the
Plano Cruzado a divergence favoring the most advanced regions was verified) - even in
the 1990-95 period. From the regions with a positive dispersion, that is, above the
national average, São Paulo and North converge more quickly than Rio de Janeiro and
the South (which presented some divergence at the end of the period). From the less
advanced spaces, the Northeast present a per capita income, which is more than 45% inferior to the average.
Former researches (Kon, 1992 and 1995) allow for the formulation of the
hypothesis that the productive structuring and the level of labor qualification, which are
regionally different in Brazil, are determinant factors of the level and speed of the
observed spatial dispersions of development. To qualify in greater detail these
difference in the spatial development tendencies, there were analyzed the differences in
the regional productive structures and their variations in time
that is, the dispersionof the various sectors’ product and labor indexes
and the behavior and sectorregional dispersions of the productivity.
It was concluded that some more dynamic sectors, such as the Manufacturing
industry, in which productivity is considerably superior to the average of the country,
and which contribute with a high weight in product generation in the more advanced
regions, went through a period of considerable loss of dynamism, which contributed to
the regional convergence of the period. These same sectors, when presenting some
recuperation, lead some regions to a greater product and labor concentration and to a
situation of divergence. The Public Administration activities were also responsible by
the greatest product generation and productivity differences, with high gains in the
However, from the activities distinguished as development drivers, the
Transports and Communication sectors show losses of productivity in all the regions in
the first period analyzed, and some more intense gains only in Rio and São Paulo in the
next period. The Finance Activities, also indicative of regional economic advance, show
gains in the positive dispersion only in São Paulo. The sector and regional redistribution
of the product show that, in a global way, no noticeable transformations in the regional
productive structures occurred and the changes observed in the most advanced world
economies as a result of technological and organizational restructuring of enterprises,
are still achieved in a very slow rhythm in Brazil. Only the Construction and Public
Administration sectors, which do not relatively present a high degree of product
generation in the productive structure, show a more intense redistribution among the
regions. It is inferred that the economic policies in the period, though resulting on a
global regional convergence process, did not avoid the continuation of the concentration
of economic dynamism in the most advanced regions, nor did they diminish the gap in
References
• IPEA, A Economia Brasileira em Perspectiva (2 volumes), IPEA, Rio de Janeiro, 1996a, Fundação Konrad Adenauer-Stiftung, São Paulo, 1996b.
• KON, Anita, A Produção Terciária, Nobel, São Paulo, 1992.
• ___________, A Estruturação Ocupacional Brasileira: uma Abordagem
Inter-regional, SESI, Brasília, 1995.
• ___________, A dinâmica regional no Brasil: convergência ou divergência?, Relatório de Pesquisa, NPP-EAESP/FGV, 1997.
• OLIVEIRA, Carlos E. e MATTOSO, Jorge Eduardo L. (org.), Crise e Trabalho no Brasil, Scritta, São Paulo, 1996.
• SANTOS, Milton, "O retorno do território", Santos, Milton, (org.) Território, Globalização e Fragmentação, Hucitec, S.Paulo, 1994.