Precision and Disclosure in Text and Voice
Interviews on Smartphones
Michael F. Schober1☯‡*, Frederick G. Conrad2,3☯‡, Christopher Antoun2, Patrick Ehlen4, Stefanie Fail1, Andrew L. Hupp2, Michael Johnston5, Lucas Vickers6, H. Yanna Yan2, Chan Zhang7
1Department of Psychology, New School for Social Research, The New School, New York, New York, United States of America,2Institute for Social Research, University of Michigan, Ann Arbor, Michigan, United States of America,3Joint Program in Survey Methodology, University of Maryland, College Park, Maryland, United States of America,4Loop AI Labs, San Francisco, California, United States of America,
5Interactions, New York, New York, United States of America,6Design & Technology, Parsons School of Design, The New School, New York, New York, United States of America,7Media and Public Opinion Research Center, Fudan University, Shanghai, China
☯These authors contributed equally to this work. ‡These authors are joint senior authors. *[email protected]
Abstract
As people increasingly communicate via asynchronous non-spoken modes on mobile de-vices, particularly text messaging (e.g., SMS), longstanding assumptions and practices of social measurement via telephone survey interviewing are being challenged. In the study reported here, 634 people who had agreed to participate in an interview on their iPhone were randomly assigned to answer 32 questions from US social surveys via text messaging or speech, administered either by a human interviewer or by an automated interviewing sys-tem. 10 interviewers from the University of Michigan Survey Research Center administered voice and text interviews; automated systems launched parallel text and voice interviews at the same time as the human interviews were launched. The key question was how the inter-view mode affected thequalityof the response data, in particular the precision of numerical answers (how many were not rounded), variation in answers to multiple questions with the same response scale (differentiation), and disclosure of socially undesirable information. Texting led to higher quality data—fewer rounded numerical answers, more differentiated answers to a battery of questions, and more disclosure of sensitive information—than voice interviews, both with human and automated interviewers. Text respondents also reported a strong preference for future interviews by text. The findings suggest that people interviewed on mobile devices at a time and place that is convenient for them, even when they are multi-tasking, can give more trustworthy and accurate answers than those in more traditional spo-ken interviews. The findings also suggest that answers from text interviews, when
aggregated across a sample, can tell a different story about a population than answers from voice interviews, potentially altering the policy implications from a survey.
OPEN ACCESS
Citation:Schober MF, Conrad FG, Antoun C, Ehlen P, Fail S, Hupp AL, et al. (2015) Precision and Disclosure in Text and Voice Interviews on Smartphones. PLoS ONE 10(6): e0128337. doi:10.1371/journal.pone.0128337
Academic Editor:Thomas R. Ioerger, Texas A&M University, UNITED STATES
Received:September 14, 2014
Accepted:April 25, 2015
Published:June 10, 2015
Copyright:© 2015 Schober et al. This is an open access article distributed under the terms of the
Creative Commons Attribution License, which permits unrestricted use, distribution, and reproduction in any medium, provided the original author and source are credited.
Data Availability Statement:Data have been deposited to the Inter-university Consortium for Political and Social Research (http://doi.org/10.3886/ E31912V1).
Introduction
The growing use of smartphones is transforming how people communicate. It is now ordinary for people to interact while they are mobile and multitasking, using whatever mode—voice, text messaging, email, video calling, social media—best suits their current purposes. People can no longer be assumed to be at home or in a single place when they are talking on the phone, if they are willing to talk on the phone at all as opposed to texting or using another asynchronous mode of communication [1]. And they may well be doing other things while communicating more than they would have been even a few years ago.
This transformation is challenging the basis of how we gather essential information about society: how we measure our health, employment, consumer confidence, crime, education, and many other human activities. Modern social measurement depends on face-to-face (FTF) and landline telephone surveys, and more recently on self-administered web surveys on personal computers. As FTF and landline telephone communications change, it is possible that current methods will not be sustainable [2]. But the critical need for accurate data about the population persists; effective public policy and private sector strategy depend on credible measurement of people’s opinions and behaviors. For example, world economies and US electoral politics can be significantly affected by the US unemployment rate reported each month from the Current Population Survey, a government-sponsored survey with a sample of 60,000 households per month. As another example, policies on disease prevention, health insurance, and risk-related behaviors depend on surveys such as the Behavioral Risk Factor Surveillance System (BRFSS), in which a consortium of US states and the Centers for Disease Control and Prevention inter-view more than 400,000 US households per year to track health and disease trends. Any chal-lenges to the accuracy of such data threaten our ability to understand ourselves collectively and create effective policy.
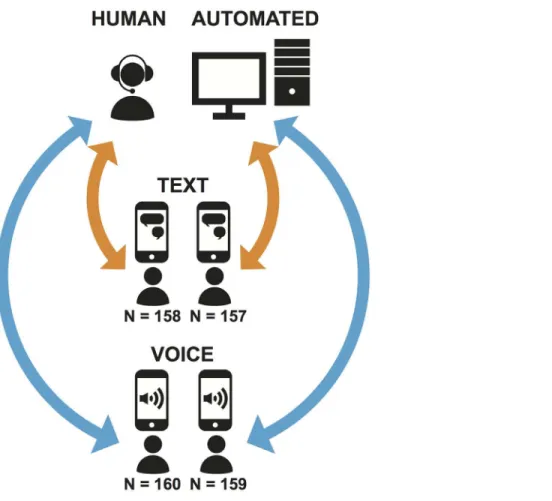
In the study reported here, we explored how members of the public report information about themselves in a survey when they are randomly assigned to respond in one of the new communication modes they now use every day, but which have not yet been used in social sci-ence and government surveys on a large scale. Our experimental design contrasts two factors that reflect the diversity in communication modes available on a single mobile device (in our case the iPhone): themediumof communication, voice vs. text messaging, and theinterviewing agent, a human interviewer vs. an automated interviewing system. This leads to four modes of interviewing: Human Voice (telephone), Human Text (text message interview administered by an interviewer), Automated Voice (telephone interview administered by an automated system), and Automated Text (text message interview administered by an automated system). (The Au-tomated Voice system is a version of what is known as Interactive Voice Response [IVR] in polls, market research, and other application areas, most often with touchtone response; see [3] on speech IVR systems). Each respondent was randomly assigned to one of these modes and answered on their own iPhone.
Our primary question is how these factors and the modes of interviewing they comprise af-fected the quality of survey data, as well as respondents’subjective experience. We also examine what else respondents did while answering questions in these modes—whether they were mul-titasking and/or mobile—and how this affected the quality of their answers in the different modes. Because we measure survey responding on the same device for all respondents (as op-posed to including other platforms such as Android or Windows), we can make fair experi-mental comparisons, even if the same modes could be deployed on other devices. Because respondents all used the uniform iPhone interface, any differences in responding across the modes cannot be because of platform differences. Because respondents used native apps on the iPhone—the Phone app or the Messages app—which they knew well and used for daily
manuscript. The specific roles of these authors are articulated in the‘author contributions’section.
communication (as opposed to answering a web survey in a browser on the iPhone, or a spe-cially designed survey app that they would need to download), any differences in responding across the modes are unlikely to have resulted from differential experience with the modes.
We examine data quality in these four modes by measuring the extent to which respondents’
answers were careful and conscientious (i.e., the extent to which respondents were not taking mental shortcuts or“satisficing”, see [4]–[5]), and the extent to which respondents were willing to disclose sensitive information. We measure thoughtfulness in answering questions that re-quire numerical responses by looking at the percentage of answers that were precise (that is, not "heaped" or rounded by ending in a zero or a five); unrounded answers are more likely to result from deliberate, memory-based thought processes than estimation (see [6]–[7]), and they are more likely to be accurate in answers to objective factual questions [8]. We measure care in answering multiple questions that use the same response scale—from“strongly favor”
to“strongly oppose”—by looking at the percentage of responses that were different from each other; the general view is that some variation across the responses (as opposed to“ straightlin-ing,”where the same response is given again and again) is likely to reflect more conscientious or thoughtful responding [9]. We use increased disclosure of sensitive information (e.g., more reported lifetime sexual partners, more reported alcohol use) as evidence of improved data quality, consistent with the evidence in survey research that more embarrassing answers are more likely to be true [10]–[12].
How might texting affect survey data quality?
Little is yet known about how survey responding differs between mobile voice and text messag-ing interviews. Will people respond less thoughtfully in text because it is often used for casual communication, or more thoughtfully because there is less time pressure to respond? Will they respond less honestly because they aren’t hearing or speaking directly to a human interviewer, or more honestly because they feel less inhibited without spoken contact? Will the lasting visual record of text messages, which others might see, make people answer more honestly because they feel accountable, or less honestly because they feel embarrassed?
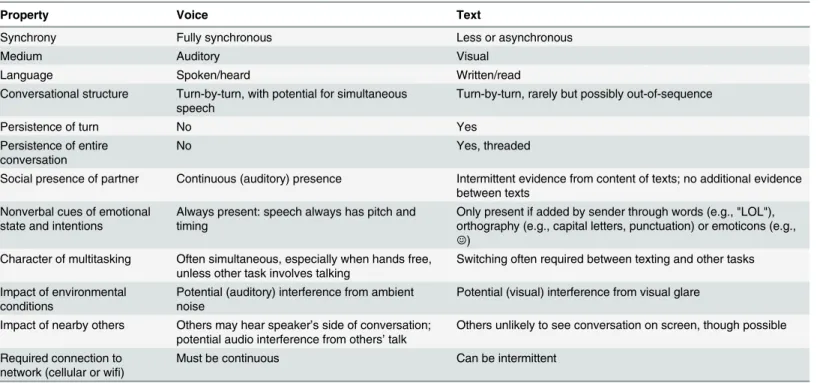
Texting and speaking differ in fundamental ways that could affect both precision and disclo-sure in surveys, asTable 1outlines. In addition to leaving a persistent visual record of what has been communicated, texting is less synchronous than speaking; the delay between successive text messages can be hours or even days. Even when the back-and-forth of texting is quick, it still does not allow simultaneous production and reception in the way that speaking does, nor does it allow precisely timed requests for clarification or feedback during the partner’s speech, because utterances arrive fully formed. In general, the rhythm of texting is quite different than the rhythm of speech: speakers in conversation are typically expected to respond immediately or to account for any delays (e.g., [13]–[14]), while the same expectations do not necessarily hold in text. In text, delay or complete lack of response doesn’t necessarily signal a problem in the way it does in speech.
return their gaze and attention to the smartphone screen. In other words, the effort for multi-tasking (whether that means alternating between tasks or performing them simultaneously) can differ significantly between text and voice—texting while walking is harder (and less safe) than talking while walking. Additional effort in dialogue management can be required in text-ing if messages are received out of sequence because of network performance problems.
More difficult to quantify is how different the social presence of the communicative partner is in texting. Textingfeelsdifferent; there is no continuous (auditory) evidence about the pres-ence of one’s partner—less of a sense that the partner is there (see, e.g., [17]–[18])—and less chance of interruption or feedback during an utterance. Text also doesn’t have as rich a palette of intonation cues, which can give a sense of a communication partner’s mental and emotional states, evaluative judgment, or attentiveness (though see [16] for discussion of the "paralinguis-tic restitution" that texters use to communicate nonverbal content).
These differences could easily affect both precision and disclosure in surveys. For precision, texting reduces demand to respond immediately, and may enable respondents to take more time thinking about their answers and to respond more precisely. Alternatively, respondents might engage in more task-switching while texting, leading them to answer less precisely be-cause the mental resources required for task switching diminish their processing ability. And the reduced social presence of the interviewer in text could lead respondents to feel less ac-countable for their answers, which could lead to less precision.
For disclosure, texting offers a combination of features that could lead respondents to report more embarrassing information than when speaking: the asynchrony and reduced social pres-ence of the interviewer give less immediate evidpres-ence of an interviewer’s reaction to answers, and possibly more time to grow comfortable with the potential consequences of disclosure. Also, texting an answer to a sensitive question might feel more“private”than speaking it out loud. On the other hand, respondents might disclose less in text if they worry about the possi-bility of others eventually discovering the answers on their phone, on synced computers, or in
Table 1. Voice vs. text on smartphones.
Property Voice Text
Synchrony Fully synchronous Less or asynchronous
Medium Auditory Visual
Language Spoken/heard Written/read
Conversational structure Turn-by-turn, with potential for simultaneous speech
Turn-by-turn, rarely but possibly out-of-sequence
Persistence of turn No Yes
Persistence of entire conversation
No Yes, threaded
Social presence of partner Continuous (auditory) presence Intermittent evidence from content of texts; no additional evidence between texts
Nonverbal cues of emotional state and intentions
Always present: speech always has pitch and timing
Only present if added by sender through words (e.g., "LOL"), orthography (e.g., capital letters, punctuation) or emoticons (e.g., ☺)
Character of multitasking Often simultaneous, especially when hands free, unless other task involves talking
Switching often required between texting and other tasks
Impact of environmental conditions
Potential (auditory) interference from ambient noise
Potential (visual) interference from visual glare
Impact of nearby others Others may hear speaker’s side of conversation; potential audio interference from others’talk
Others unlikely to see conversation on screen, though possible
Required connection to network (cellular or wifi)
Must be continuous Can be intermittent
service providers’databases. The asynchrony of texting could also give respondents more time to devise answers that are evasive or less truthful.
How might automated interviewing systems affect survey data quality on
smartphones?
As for automated interviewing on smartphones, it is well known that people respond different-ly to“self-administered”surveys delivered by automated systems than by human interviewers, and this affects respondents’care in answering (for better [19] or worse [20]) and increases dis-closure (e.g., [10], [21]). Our question is whether these effects are also observed in surveys ad-ministered on a smartphone, where respondents can be mobile, in differently distracting environments, and potentially less private than when answering on desktop computers or land-line telephones. It is also unclear whether these effects will extend to automated surveys admin-istered with the turn-taking structure of voice and text, as opposed to web surveys. If, for example, respondents feel less social presence (and thus accountability) with a text interviewer than a voice interviewer, then perhaps automation won’t matter in text.
Regarding conscientious responding, the evidence in traditional survey modes is mixed. People seem to skip fewer questions in web surveys than in telephone interviews [20], but they sometimes straightline more [20] and sometimes less [19], [22]–[23]. It is unclear whether this happens because the web surveys are automated (they lack an interviewer) or the fact that the interaction is textual, or both. Our texting modes allow us to examine this directly.
As for disclosure, people are known to report more sensitive information—more sex part-ners, more substance use, poorer academic performance—in automated surveys than to human interviewers (e.g., [10], [21]). The usual explanation for this is that the privacy and ano-nymity of automated interviews reduce concern about being judged and one’s answers revealed [11], [24]–[25], though what may be particularly important is the lack of the interviewer’s face [26]. If these effects replicate in text and voice on smartphones, then we should see greater dis-closure in Automated Voice and Text interviews than Human Voice and Text interviews. Whether the effects will be the same in voice and text is less clear. If social presence is lower in text than voice (even with a human interviewer), then automation may not affect disclosure in text at all. And given that with a mobile device people can choose when and where they re-spond, it is unknown whether the privacy concerns that promote disclosure with automated systems are still relevant.
Materials and Methods
A convenience sample of iPhone users was recruited from a variety of online sources to partici-pate in a survey on their iPhone for a $20 iTunes gift code incentive. They were then randomly assigned to one of the four interview modes (Human Voice, Human Text, Automated Voice, Automated Text). All procedures were approved by the Health Sciences and Behavioral Sci-ences Institutional Review Boards at the University of Michigan and the Institutional Review Board at The New School.
Experimental Design
(automated or human) interviewer and respondent, and the same protocols for handling any speech or text by respondents other than acceptable answers (handling requests for clarification, responses that did not match the response options, responses that could not be perceived or un-derstood, and out-of-scope commentary). In voice interviews respondents answered by talking; in text interviews respondents were instructed to answer by texting a single character corre-sponding to a response option (Y/N, a letter [e.g., a, b, c], or a number).
The human interviewers used a designed desktop interface connected to a custom-designed case management system, which randomly assigned participants to interview modes and interviewers and stored the survey data. The interface for voice presented interviewers with the questions for them to read aloud, and they selected or typed the answers they heard. In the text interface interviewers selected, edited or typed questions and prompts and clicked to send the text messages, which were routed through a third party provider (Aerialink); they then entered respondents’texted answers through the interface. 10 professional interviewers at the University of Michigan Survey Research Center carried out both voice and text interviews; they all administered interviews in both modes.
For the automated voice interviews, a custom speech dialogue system was created using AT&T’s Watson speech recognizer and the Asterisk telephony gateway; questions and prompts were presented by a recorded female human interviewer, and respondents’speech (not touch-tone) was recognized by Watson; answers were automatically stored (see [27] for details). For the automated text interviews, a custom text dialogue system was created; text messages were
Fig 1. Experimental design and procedure.
also routed through Aerialink, and respondents’texted answers were automatically stored in the database (seeS1 Figfor a system diagram). The introductory material for the Automated Text interviews explicitly labeled the interview as automated (“This is an automated interview from the University of Michigan”), while the comparable materials in the Human Text inter-views identified the interviewer (“My name is<first name, last name>from the University of
Michigan”). All messages sent in the Automated Text interviews were pre-scripted, while the human text interviewers could individualize the scripted materials (other than the survey ques-tions) if they chose; they could also generate original message content if they deemed
it necessary.
Materials and Procedures
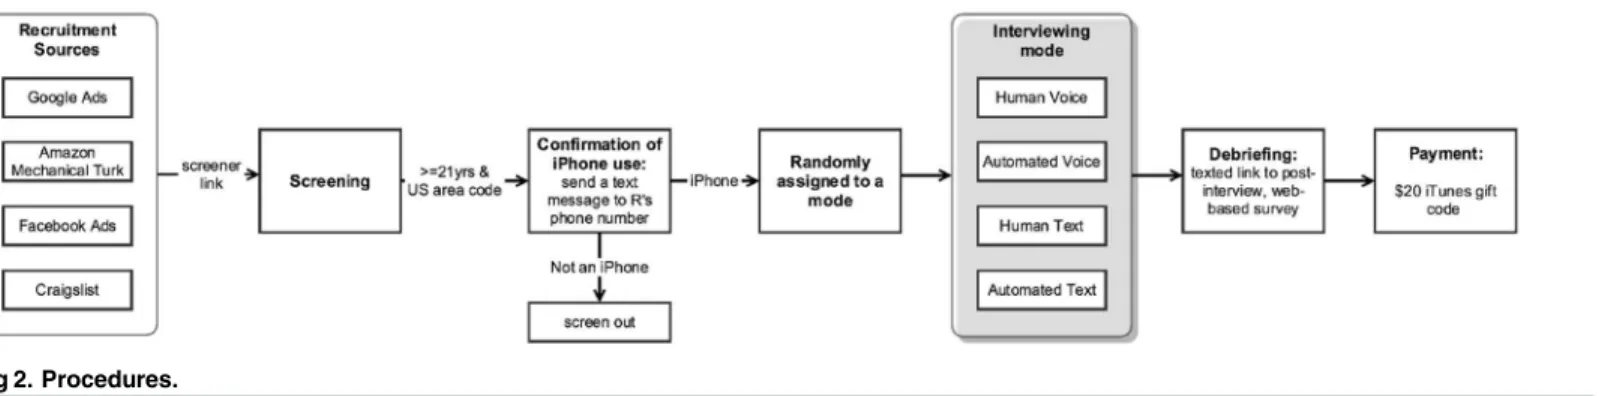
Fig 2summarizes the sequence of steps that participants experienced.
Recruitment and Screening. iPhone users were recruited from Google AdWords (31.0%), Amazon Mechanical Turk (60.9%), Facebook Ads (0.3%) and Craigslist (7.8%) (see [28] for analyses of the impact of these recruitment sources on sample composition). They followed a link from the recruitment source to a browser-based screener questionnaire that asked them for their zip code, date of birth, education, income, gender, ethnicity, race, telephone number, service provider, voice minutes and text message plan, whether they were the sole user of this phone, and time zone. The screener asked them to explicitly consent to participate in a research study by clicking a check box. If the participants reported being 21 years of age and over, and if their phone number did indeed have a US area code, they were sent a text message to which they replied so that we could verify that their device was an iPhone. If their device was verified as an iPhone, they were randomly assigned to one of the four modes of interviewing.
Interview. All interviews were started with either a safe-to-talk or safe-to-text question and could only continue if respondents indicated that it was in fact safe. The same 32 questions from major US social surveys and methodological studies were asked in each mode (seeS1 Table, which lists the questions in the order they appeared in the interview, along with their source). Fifteen questions were selected to allow measurement of conscientious responding: 8 questions requiring numerical responses which could later be classified as precise or rounded (divisible by 5) numbers (e.g., number of movies seen last month, number of apps on iPhone) and a battery of 7 questions that all used the same 5-point response scale (from“strongly favor”to“strongly oppose”) allowing measurement of straightlining (generally defined as se-lecting the same response options for all or most questions in a battery). 15 questions with more or less socially desirable answers were selected to allow measurement of disclosure, in that they had more and less socially desirable answers (e.g., number of sex partners, lifetime marijuana use, frequency of reading the newspaper, etc.). A number of these questions were
Fig 2. Procedures.
known to have produced differences in conscientious responding or disclosure in conventional survey modes.
Debriefing. After completing the interview, respondents were sent a text message with a link to the post-interview online debriefing questionnaire. This questionnaire asked about the presence of others during the interview, interference from environmental conditions (back-ground noise, glare), multitasking, intrusiveness of the questions, preference for mode of future interviews among the four in this study, ease of completing the interview, and satisfaction with the interview. Upon completion of the post-interview debriefing questionnaire, a text message was sent with a $20 iTunes gift code as payment for participation.
Participants
The data reported here are based on the responses of the 634 respondents who completed the interview and the on-line debriefing questionnaire between March and May 2012 (seeTable 2
for completion rates).
Respondent demographics
The respondents were somewhat younger and less affluent than US national iPhone users at the time [30] but across the four modes they did not differ reliably in age, education, income, gender, ethnicity, race, or cell phone carrier (seeTable 3).
Results
We report findings based on the responses recorded by the human interviewers (in Human Voice and Human Text) and by the automated systems (in Automated Voice and Automated Text). In the Automated Voice mode, the system correctly recognized the answers in 95.6% of the responses; the patterns of results do not differ if we use human annotations, the presumed gold standard (see [27]).
Data quality: Conscientious responding
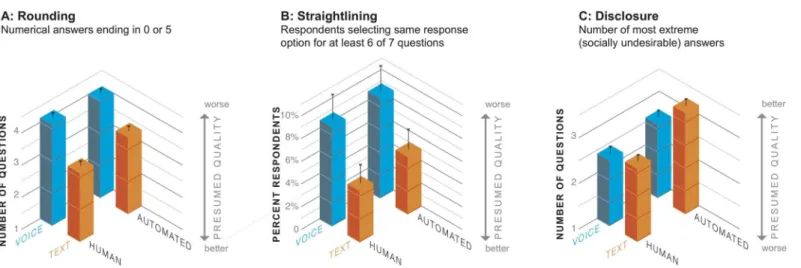
People’s answers were more precise in text than in voice interviews (seeFig 3A). Across the 8 relevant questions, respondents provided fewer rounded answers (numerical answers that ended in 0 or 5) in text than in voice interviews,F(1,632) = 41.25,p<.0001. The amount of
rounding was not affected by the interviewing agent (human vs. automated interviewer),F
(1,632) = 0.55,ns, nor did agent interact with the medium of interviewing (text vs. voice), inter-actionF(1,632) = 2.49,ns.
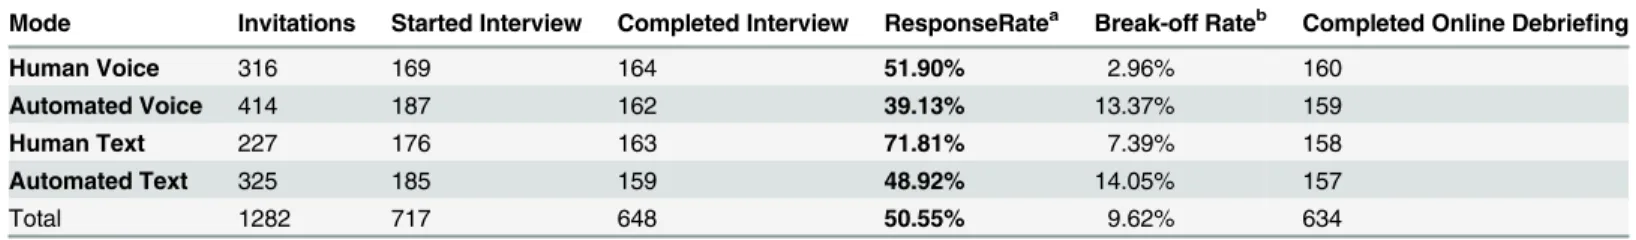
Table 2. Participation, response rates and break-off rates.
Mode Invitations Started Interview Completed Interview ResponseRatea Break-off Rateb Completed Online Debriefing
Human Voice 316 169 164 51.90% 2.96% 160
Automated Voice 414 187 162 39.13% 13.37% 159
Human Text 227 176 163 71.81% 7.39% 158
Automated Text 325 185 159 48.92% 14.05% 157
Total 1282 717 648 50.55% 9.62% 634
aThe response rate (known as AAPOR RR1 [29]) is calculated as the number of complete interviews divided by the number of invitations. bThe break-off rate is calculated as the number of people who dropped off during the survey divided by the number of people who started.
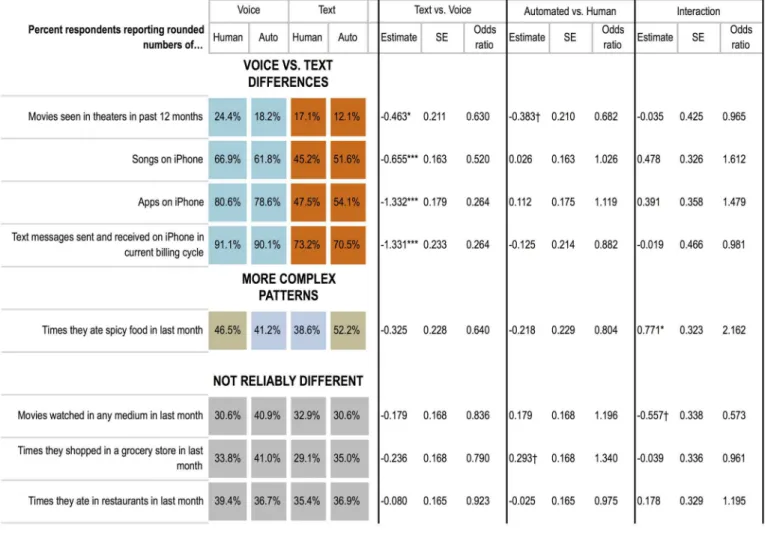
For a more fine-grained view of the rounding pattern, seeFig 4; reliably fewer respondents rounded their numerical responses on the questions about movies seen in a movie theater in the past 12 months, number of songs on their iPhone, number of apps on their iPhone, and number of text messages in their most recent billing cycle. For these questions the differences in percentages of respondents rounding in voice vs. text were quite large, from 12 to more than 30 percent; for some questions the more precise answers in text would lead to different sub-stantive conclusions about the population than answers in voice, if the results were used to make population inferences (which of course is not advisable here, given our convenience
Table 3. Respondent demographics across four modes.
Demographic variables
Voice Text
Human Automated Human Automated Chi-square statistics
Degrees of freedom
p
Agea 7.833 12 0.798
21–34 years 56.30% 62.70% 57.00% 64.70% 35–44 years 15.00% 13.90% 17.10% 10.30% 45–54 years 12.50% 12.00% 12.70% 11.50%
55–64 years 13.10% 10.10% 9.50% 9.60% 65 years and older 3.10% 1.30% 3.80% 3.90%
Education 7.275 12 0.839
High school or less 7.50% 5.70% 8.90% 7.60%
Some college 28.80% 28.30% 24.10% 28.70%
Associate/Vocational/ Technical
11.90% 8.10% 9.50% 13.40%
Bachelor's degree 28.10% 37.10% 33.50% 29.90%
Master/Professional/PhD 23.80% 20.10% 24.10% 20.40%
Income 10.861 12 0.541
$25000 or less 17.50% 18.20% 13.90% 16.60%
$25000 to $50000 21.90% 25.80% 24.70% 29.90%
$50000 to $75000 16.30% 17.60% 22.80% 18.50%
$75000 or more 31.90% 32.10% 30.40% 29.30%
Decline to answer 12.50% 6.30% 8.20% 5.70%
Gender 2.533 3 0.469
Female 41.90% 49.70% 49.40% 47.80%
Male 58.10% 50.30% 50.60% 52.20%
Hispanic origin 3.896 3 0.273
No 88.10% 93.70% 90.50% 93.00%
Yes 11.90% 6.30% 9.50% 7.00%
Race 5.367 9 0.801
White 76.90% 81.80% 76.60% 79.00%
African American 9.40% 3.80% 7.00% 5.70%
Asian 5.60% 6.90% 7.00% 5.70%
Other 8.10% 7.60% 9.50% 9.60%
Carrier 3.731 6 0.713
AT&T 60.00% 62.30% 64.60% 66.90%
Sprint 10.00% 7.60% 10.10% 10.20%
Verizon 30.00% 30.20% 25.30% 22.90%
aAge values are missing for two respondents (n = 632 instead of 634).
sample of participants). For example, the average number of apps on respondents' iPhones re-ported via text was nearly 20 percent higher (50.7 apps) than via voice (42.8 apps), F(1,630) = 4.44, p<.05, and the average number of songs on respondents' iPhones reported via text was
30% lower (479.9 songs) than via voice (692.0 songs), F(1,627) = 3.93, p<.05. We can only
speculate about the exact mechanisms underlying these effects, but the findings provide clear evidence that text interviewing promotes more precise responding than voice, independent of whether the interviewing agent is human or automated.
People were also reliably less likely to straightline in text than in voice (seeFig 3B). Across the 7 relevant questions, fewer respondents were likely to select the same response option 6 or more times in text. In a logistic regression, the odds of straightlining in text were about half the odds of straightlining in voice (odds ratio [OR] 0.52, 95% confidence interval [CI], 0.27–
0.99,p= 0.047). There were no differences by interviewing agent nor did agent interact with medium. These findings again suggest that text interviewing promotes more conscientious responding.
Data quality: Disclosure
People reported more socially undesirable behaviors in text than voice interviews, and in auto-mated than human interviews (seeFig 3C). This was evident in several ways. Across the 15 rel-evant questions, respondents produced more answers in text that we determined to be the most socially undesirable, either above the top decile for continuous numerical responses (number of lifetime sex partners, drinks per week, etc.) or the most extreme categorical re-sponse option in the stigmatized direction (e.g., exercising less than one day per week, never at-tending religious services, or having smoked more than 100 cigarettes in one’s entire life), F (1,632) = 7.87, p<.01. People also reported more socially undesirable behaviors to automated
than human interviewers,F(1,632) = 7.46,p<.01. There was no interaction between medium
and interviewing agent,F(1,632) = 1.45,ns.
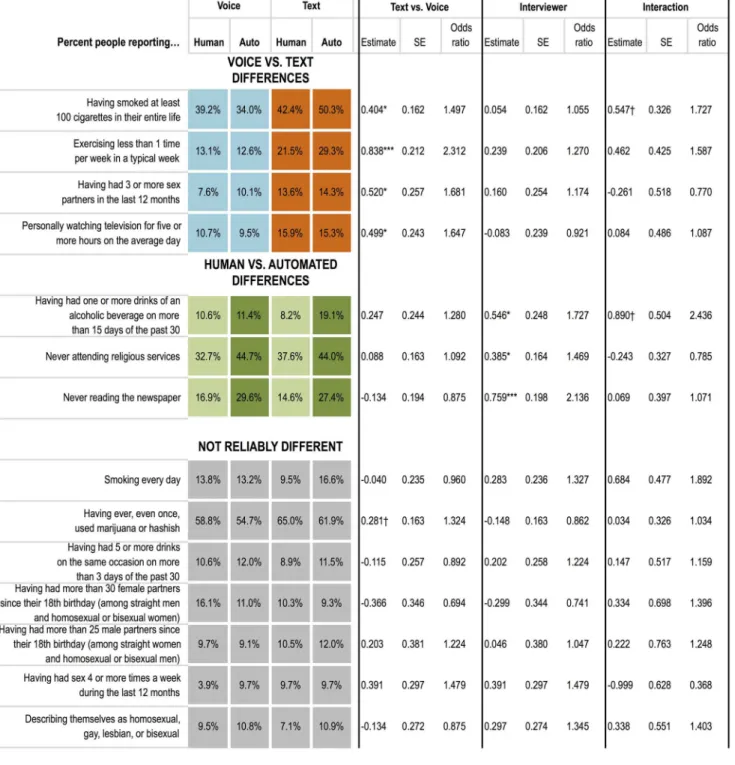
A more fine-grained view of the pattern (Fig 5) shows the percentage of respondents provid-ing the most socially undesirable responses on individual questions. The effects are item-specif-ic, with reliably more disclosure in text than voice for some questions (cigarettes, exercise, number of sex partners, television watching) and more disclosure to the automated interviewer than human for others (drinking frequency, religious attendance, newspaper reading). For these questions the differences in percentages of respondents reporting the most socially
Fig 3. Data quality across the four modes: (A) rounding, (B) straightlining, and (C) disclosure.
undesirable responses are large enough across modes, from 5 to 16%, to affect substantive in-terpretation and population estimation; for example, if we were to generalize to the population from text interviews in our convenience sample (again, which one would not do in practice), we would estimate that 46.4% of the population has ever been a smoker, compared with 36.6% in voice interviews. Similarly, estimates of how sedentary the population is from text interviews (25.4% exercising less than once a week) would look different than from voice interviews (12.9% exercising less than once a week).
Of course, to understand this phenomenon more fully, one would need to know more about the norms our participants subscribe to, for example, how much exercise they think is desirable in the eyes of others, how embarrassed they are about smoking, how many sex partners they find embarrassing or how important they feel it is to attend religious services. Nonetheless, the fact that our participants were randomly assigned to interviewing modes means that the distri-bution of norms was unlikely to have differed across the modes, and that the modes were there-fore responsible for the levels of disclosure.
Fig 4. Rounding effects for each question.
Fig 5. Disclosure effects for each question.
These patterns of disclosure replicate—on a mobile device—the well-known effect of greater disclosure to automated systems compared to human interviewers [31], [10], [21]; clearly our participants could tell the difference between human and automated interviews in voice (where the speaker’s being live or recorded is unmistakable) and text (even though the difference is more subtle). They also demonstrate that people disclose more in text than voice, consistent with Hancock et al.’s [32] findings of reduced deception in textual vs. spoken modes of com-munication. The effects on disclosure of answering textually and answering to an automated interviewer are statistically independent, which suggests that prior findings of greater disclo-sure in textual automated systems (e.g., web surveys) may have resulted both from automation and also from not speaking.
Multitasking and mobility
A survey on a mobile multimodal device raises the possibility that respondents might be doing many other things while answering than would have been likely in landline or desktop web sur-veys. We measured the extent to which this happened in the post-interview online debriefing questionnaire. In general, respondents were more likely to have multitasked during text than voice interviews. AsFig 6Ashows, more text respondents reported having communicated with someone else during the interview: either to have talked with someone else on the phone or face to face, to have texted with someone else, or to have videochatted with someone else (OR 4.75, 95% CI 2.85–7.92,p<.0001). Respondents in both text modes were more likely to report
having carried out any other device-based activities (Fig 6B): watching TV or video, playing video games, or doing anything else on their iPhone or on another device (OR 2.18, 95% CI 1.54–3.08,p<.0001). And respondents in both text modes reported having been more likely
to be participating in any other activities during the interview (Fig 6C): preparing a meal, eating or drinking, traveling in a vehicle or on foot, working, doing household chores, and shopping or running errands (OR 1.37, 95% CI 1.00–1.88,p= .047). There were no effects of the inter-viewing agent nor any interactions with the medium.
One consequence of being mobile is that there can be variation in respondents’auditory and visual environments, as well as in whether they are alone or not. Despite being interviewed on mobile devices, most respondents (88%) reported that they were not mobile during the in-terview. There was also no evidence that respondents in the different modes were any more or
Fig 6. Multitasking across the four modes.
less likely to have been in motion (in a vehicle or on foot). Nonetheless, respondents in differ-ent modes were differdiffer-ently affected by their circumstances; more responddiffer-ents in the voice modes reported that background noise had interfered with the interview (29%) than in the text modes (12%) (OR 0.19, 95% CI 0.10–0.36,p<.0001), particularly in the automated voice
mode (OR 0.36, 95% CI 0.15–0.85,p= .020). There were no differences in reported effects of visual glare.
We saw no evidence that reported multitasking by respondents had any impact on the qual-ity of their answers: on their rounding, straightlining, or disclosure. Presumably the asynchro-nous nature of text messaging allowed multitasking respondents to fully switch their focus between the survey task and other activities, thus allowing them to fully attend to the survey task at the moments they were responding.
Interview duration and rhythm
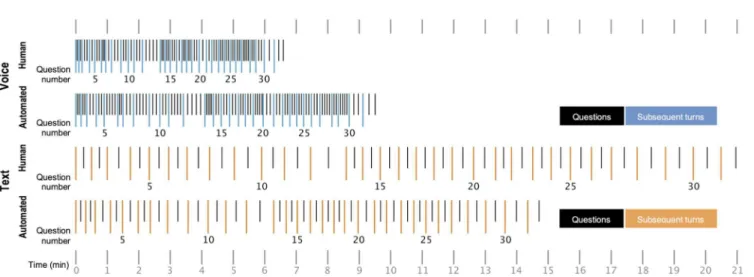
As one might expect, interviews via text had an entirely different rhythm than interviews via voice: they were far longer and less“dense,”with fewer conversational turns after survey ques-tions, than were voice interviews (seeFig 7). Text interviews took substantially longer to com-plete than voice interviews (Mann-WhitneyU,z= -19.02,p<.0001) but they involved reliably
fewer conversational turns (F[1,617] = 1297.01,p<.0001), reflecting a slower back-and-forth
compared to the relative rapid fire of voice (as measured by turns per minute—F[1,617] = 3111.75,p<.0001). (Degrees of freedom for these comparisons reflect that 13 voice interviews
were not fully audio-recorded and 2 human text interviews were each missing one sequence). The number of turns following each question in voice was more variable than in text, where most questions were answered in a single turn (Levene’s test:F[1,617] = 86.37,p<.0001).
Questions 7–12, which asked about sexual behavior and orientation, averaged longer response times than other questions in all four modes, presumably due to their sensitivity [33].
Spoken communication clearly differs from communicating by text, with higher attentional demand (strong demand to remain focused) and a requirement to articulate answers (as op-posed to entering a single character). Whether the text interviews reflect less total time“on
Fig 7. Interview duration and median number of turns per survey question.These timelines display the median duration of question-answer sequences with the median number of turns after each question.
task”is unclear. The fact that text respondents answered more precisely and with more careful consideration suggests that at least some of the time between turns was spent constructing bet-ter answers—perhaps counting rather than estimating the frequency of their behaviors, or looking up precisely how many songs or apps they had. A more detailed view of the text inter-views suggests that text promotes precision because it imposes less time pressure than voice: re-spondents gave more precise answers (rounded less) in text interviews that were slower (that is, time between the onset of successive turns was greater than the median of 15.8 seconds) com-pared with more rapid-fire text interviews (time between onset of successive turns less than the median) (F(1,311) = 17.14,p<.0001). This effect is specific to text; there was no such
differ-ence for slower and faster voice interviews (interactionF(1, 628) = 218.73, p<.001), perhaps
because the median time between the onset of successive turns in voice interviews was much faster, 4.04 seconds.
These differences in the dynamics of text vs. voice interviews raise the question of which medium is more efficient—either operationally, for interviewers and researchers, or for respon-dents’subjective experience of being burdened with an interview. Traditionally, effort and bur-den have been measured mainly by looking at total elapsed time, as well as measuring
respondent satisfaction or irritation [34]–[36]. In mobile text interviews, which allow respon-dents greater control over how, when and where they respond to each question, it is entirely possible that a longer interview couldreduceburden, or at least not increase it. Our findings are consistent with this idea: despite the fact that the text interviews took longer, at least as many text respondents reported being very or somewhat satisfied with their interview as voice respondents (95% vs. 93%,χ2[1] = 0.65,ns). Our text respondents overwhelmingly reported
that they would prefer future interviews in text than in voice (84% in human text and 90% in automated text), and a substantial percentage of voice respondents (36% for human voice, and 53% for automated voice) reported that they would prefer text interviews in the future.
However one thinks about efficiency, the bottom line is that even though text interviews took longer than voice interviews, they produced data likely to be of better quality than the data from voice interviews: less rounding, less straightlining, and more disclosure.
What is the role of non-response?
One interpretation of the findings is that texting promotes better data quality because respon-dents are under less time pressure and feel less social scrutiny than in voice interviews. Could the findings instead be explained by different patterns of starting and finishing interviews across the four modes? That is, were people who were more conscientious (less likely to round their answers or to straightline) or more willing to disclose sensitive information actually less likely to start or finish interviews in voice modes than in text modes? Could our mode effects result not from the contribution of responders and completers, but instead from the non-con-tribution of non-responders and non-completers?
Our study design allows us to examine this in a focused way, because all our sample mem-bers had already indicated, by screening into the study, interest in and at least some commit-ment to participating in an interview on their iPhone (in an unspecified interview mode). The fact that our participants were randomly assigned to an interviewing mode means that their initiative was unlikely to have differed across the modes. Thus any mode differences in starting or finishing the interview are unlikely to be due to differences in inclination to participate.
and text interviews, and thus that those who did not respond to voice (or text) invitations would have answered differently—if they participated—than those who did respond. This would require that the tendency of respondents to give imprecise answers, for example, and the reluctance to engage in a text interview (but willingness to engage in a voice interview) would have the same origin. It is hard to imagine why this would be the case, particularly given the popularity of texting as a mode of communication.
Could differences incompletionrate account for the mode differences in data quality? The percentage of completion was no different between text and voice interviews (89% vs 92%;χ2[1]
= 1.16,ns), and so differential rates of completion cannot account for the finding that texting promotes better data quality (seeTable 2for more detail). The rate of completion was higher in human than automated interviews (95% vs 86%,χ2[1] = 14.84,p<.05), as is typical in
compari-sons of human- to self-administered surveys (see, e.g., [37], chapter 5, for relevant comparisons). Might this account for the greater disclosure in automated than human interviews? This would require a systematic reversal of the pattern of disclosure observed for those who completed and for those who broke off. For non-completion to fully account for the difference in the observed rate of disclosure to automated and human interviewers, the 51 people who broke off with auto-mated interviewers would have needed to disclose 98% less than those who completed the inter-view (averaging 0.05 instead of 2.91 socially desirable answers). Such a scenario is implausible. If anything, one would expect that those who break off have more to disclose.
Discussion
People who were randomly assigned to text interviews provided more precise and candid infor-mation in survey interviews on smartphones than did people who spoke their answers: they rounded less, they differentiated among response options more (i.e., they straightlined less), and they reported more information that was sensitive. And they did this at rates that would likely affect the substantive conclusions that one would draw from survey data collected in voice versus text interviews, which could in turn affect the policy implications of the data. While of course we can’t be sure that this different pattern of responding reflects greater accu-racy, it is reasonable to assume that it does, both on logical grounds and consistent with prior empirical evidence that unrounded answers to objective questions like ours are more accurate [8] and that increased reporting of socially undesirable behaviors is also more accurate [10].
Text interviews also had a fundamentally different dynamic than voice interviews: texters took fewer“turns”spread over a longer period of time, and they were more likely to be doing other things at the same time as the interview. Texting may allow people to be more thoughtful and precise because it is asynchronous, allowing them to take all the time they need and to an-swer when it is convenient for them—perhaps even giving them time to base their answers on records they have checked (e.g., their log of text messaging this month, or the number of songs on their iPhone). Texting may also make it easier for people to report embarrassing informa-tion, since texters do not have to experience the (vocal) presence of an interviewer and (as im-plemented in our experiment) they didn’t have to speak (or even type) an embarrassing answer. Texters disclosed more even though text data are more persistent and potentially visi-ble to others than voice data.
questionnaires [31], [10], [21]. This suggests that the privacy concerns that promote disclosure with automated systems are still relevant in a mobile environment.
These findings raise a number of questions about how these new communication modes can best be used for social measurement. One question is whether the effects of mode of inter-viewing on conscientious responding and disclosure observed here will replicate across respon-dents of different ages, income levels, education, technological sophistication, and other individual and group differences. Another is whether the effects change for a sample represent-ing a national population, or even a national population of smartphone users, as opposed to our volunteer convenience sample. Of course, because each mode consisted of a bundle of fea-tures, additional research would be needed to determine which particular features or combina-tions of features are responsible for the effects observed here. Different implementacombina-tions of each mode, and more choices—for example, the opportunity to answer in a mode other than the contact mode, or even to change interview mode mid-stream—might also lead to different patterns of results.
Nonetheless, the consistency of the patterns and the size of the differences observed lead to clear interpretations, and we believe that the implications will generalize even as technologies develop (our findings represent a snapshot of a particular state of transition in people’s use of evolving communication technologies). First, asynchronous communication—which is here to stay on mobile devices—reduces time pressure to respond and increases social distance with in-terlocutors, while synchronous communication demands a more immediate response. Whatev-er new modes may emWhatev-erge on mobile devices (asynchronous voice communications in
enhanced texting applications like WhatsApp are already changing the equation), the implica-tions for social measurement are likely to be the same: more precision and more disclosure are likely to occur in less synchronous modes of interviewing. Whether synchronous (voice, face-to-face) interviews can still be assumed to represent the gold standard for high quality survey data is, as we see it, an open question.
Second, multitasking while answering survey questions does not necessarily lead to poorer data quality, and may well enhance respondents’satisfaction and well-being by allowing them to respond where and when they find it convenient. In our findings, we do not see evidence of degraded performance from multitasking that is evident in other domains of activity (see [38]–
[39]). Even if there are millisecond-level startup and switching costs for respondents when an-swering survey questions while doing other tasks [40], and perhaps degradation of perfor-mance on the other tasks, data quality in our study was actually better in text, where there was more multitasking, than in voice.
Third, automated interviewing on mobile devices increases respondents’disclosure just as it does in web surveys and other self-administered computerized modes. And the effects of auto-mation are independent of the effects of texting. This suggests that the potential benefits of au-tomation for social measurement extend to the use of a personal portable device despite the varying contexts (public and private) in which the device is used.
Our data do not lead us to argue that all interviews should now be carried out via text mes-saging or by automated systems. There are likely to be subgroups of the population who would rather not text, and who prefer to speak to a human. Good automated systems have serious de-velopment costs (particularly speech systems), which may make them better suited for longitu-dinal studies where the development costs are amortized, as opposed to one-off or
Supporting Information
S1 Fig. System diagram.
(TIF)
S1 Table. Questionnaire items listed in the order they appeared in the survey.
(DOCX)
Acknowledgments
Many thanks to Alison Bowers, David Carroll, Stephanie Chardoul, Mick Couper, Gabriel Gia-nordoli, Lloyd Hemingway, Courtney Kellner, Monique Kelly, Mingnan Liu, Kelly F. Nichols, and Leif Percifield.
Author Contributions
Conceived and designed the experiments: MFS FGC PE MJ. Performed the experiments: CA ALH LV HY CZ. Analyzed the data: MFS FGC CA PE ALH MJ HY CZ. Contributed reagents/ materials/analysis tools: PE SF MJ LV. Wrote the paper: MFS FGC CA PE ALH MJ HY CZ. Designed the interviewing system and case management software: LV, with consultation from PE MJ and ALH.
References
1. Duggan M (19 Sept 2013) Cell phone activities 2013. Pew Internet and American Life Project. Avail-able:http://www.pewinternet.org/2013/09/19/cell-phone-activities-2013/. Accessed 3 Sept 2014.
2. Link MW, Murphy J, Schober MF, Buskirk TD, Childs JH, Tesfaye CL (2014) Mobile technologies for conducting, augmenting and potentially replacing surveys: Executive summary of the AAPOR task force on emerging technologies in public opinion research. Public Opin Q 78: 779–787. doi:10.1093/ poq/nfu054
3. Bloom J (2008) The speech IVR as a survey interviewing methodology. In: Conrad FG, Schober MF, editors. Envisioning the survey interview of the future. New York: Wiley. pp. 119–136. doi:10.1002/ 9780470183373.ch6
4. Krosnick JA, Alwin DF (1987) An evaluation of a cognitive theory of response-order effects in survey measurement. Public Opin Q 51(2): 201–219.
5. Simon HA (1956) Rational choice and the structure of the environment. Psychol Rev 63(2): 129–138. PMID:13310708
6. Brown NR (1995) Estimation strategies and the judgment of event frequency. J Exp Psychol Learn Mem Cogn 21: 1539–1553.
7. Conrad FG, Brown NR, Dashen M (2003) Estimating the frequency of events from unnatural categories. Mem Cognit 31: 552–562 PMID:12872871
8. Holbrook AL, Anand S, Johnson TP, Cho YI, Shavitt S, Chávez N, et al. (2014) Response heaping in in-terviewer-administered surveys: Is it really a form of satisficing? Public Opin Q 78: 591–633.
9. Krosnick J (1991) Response strategies for coping with the cognitive demands of attitude measures in surveys. Appl Cogn Psychol 5(3): 213–236.
10. Kreuter F, Presser S, Tourangeau R (2008) Social desirability bias in CATI, IVR, and web surveys: the effects of mode and question sensitivity. Public Opin Q 72: 847–865.
11. Schaeffer NC (2000) Asking questions about threatening topics: a selective overview. In: Stone AA, Bachrach CA, Jobe JB, Kurtzman HS, Cain VS, editors. The science of self-report: implications for re-search and practice. New Jersey: Lawrence Erlbaum Associates, Inc. pp 105–121.
12. Tourangeau R, Rips L, Rasinski K (2000) The psychology of survey response. Cambridge: Cambridge University Press.
13. Jefferson G (1988) Notes on a possible metric which provides for a 'standard maximum' silence of ap-proximately one second in conversation. In: Roger D, Bull PP, editors. Conversation: An interdisciplin-ary perspective. Clevedon, UK: Multilingual Matters. pp 166–196.
15. Clark HH, Brennan SE (1991) Grounding in communication. In: Resnick LB, Levine JM, Teasley SD, editors. Perspectives on socially shared cognition. Washington DC: APA Books. pp 127–149.
16. Thurlow C, Poff M (2013). Text messaging. In: Herring SC, Stein D, Virtanen T, editors. Pragmatics of computer-mediated communication. Berlin, Germany: Mouton de Gruyter. pp. 163–190.
17. Hancock JT (2007) Disclosure and deception in tomorrow’s survey interview: the role of information technology. In: Conrad FG, Schober MF, editors. Envisioning the survey interview of the future. New York: Wiley. pp. 79–194. doi:10.1002/9780470183373.ch9
18. Joinson AN (2001) Self-disclosure in computer-mediated communication: the role of self-awareness and visual anonymity. Eur J Soc Psychol 31: 177–192.
19. Chang L, Krosnick JA (2009) National surveys via RDD telephone interviewing versus the internet: comparing sample representativeness and response quality. Public Opin Q 73: 641–678.
20. Fricker S, Galesic M, Tourangeau R, Yan T (2005) An experimental comparison of web and telephone surveys. Public Opin Q 69: 370–392.
21. Tourangeau R, Smith T (1996) Asking sensitive questions: the impact of data collection mode, question format, and question context. Public Opin Q 60: 275–304.
22. Chang L, Krosnick JA (2010) Comparing oral interviewing with self-administered computerized ques-tionnaires: an experiment. Public Opin Q 74: 154–167.
23. Holbrook AL, Green MC, Krosnick JA (2003) Telephone vs. face-to-face interviewing of national proba-bility samples with long questionnaires: comparisons of respondent satisficing and social desiraproba-bility re-sponse bias. Public Opin Q 67: 79–125.
24. Aquilino WS (1994) Interview mode effects in surveys of drug and alcohol use: a field experiment. Pub-lic Opin Q 58: 210–240.
25. Tourangeau R, Yan T (2007) Sensitive questions in surveys. Psychol Bull 133: 859–883. PMID:
17723033
26. Lind LH, Schober MF, Conrad FG, Reichert H (2013) Why do survey respondents disclose more when computers ask the questions? Public Opin Q 77: 888–935. doi:10.1093/poq/nft038
27. Johnston M, Ehlen P, Conrad FG, Schober MF, Antoun C, Fail S, et al. (2013) Spoken dialog systems for automated survey interviewing. In the proceedings of the 14thAnnual SIGDIAL Meeting on
Dis-course and Dialogue: 329–333.
28. Antoun C, Zhang C, Conrad FG, Schober MF. Comparisons of online recruitment strategies for conve-nience samples: Craigslist, Google AdWords, Facebook and Amazon’s Mechanical Turk. Field Meth-ods 28(3), forthcoming.
29. The American Association for Public Opinion Research (2011) Standard definitions: final dispositions of case codes and outcome rates for surveys. 7th edition. Available:http://www.aapor.org/AM/ Template.cfm?Section=Standard_Definitions2&Template=/CM/ContentDisplay.cfm&ContentID=3156. Accessed 3 Sept 2014.
30. Radwanick S (29 June 2012) 5 years later: a look back at the rise of the iPhone. ComScore Blog. Avail-able:http://www.comscore.com/ita/Insights/Blog/5_Years_Later_A_Look_Back_at_the_Rise_of_the_ iPhone/Accessed 3 Sept 2014.
31. Gribble JN, Miller HG, Cooley PC, Catania JA, Pollack L, Turner CF (2000) The impact of T-ACASI in-terviewing on reported drug use among men who have sex with men. Subst Use Misuse 35(6–8): 869– 890. PMID:11349687
32. Hancock JT, Thom-Santelli J, Ritchie T (2004) Deception and design: the impact of communication technologies on lying behavior. In proceedings of the SIGCHI conference on human factors in comput-ing systems: 129–134. ACM.
33. Holtgraves T (2004) Social desirability and self-reports: testing models of socially desirable responding. Pers Soc Psychol Bull 30: 161–172. PMID:15030631
34. Graf I (2008) Respondent burden. In Lavrakas PJ, editor. Encyclopedia of Survey Research Methods. Thousand Oaks, CA: Sage. pp 740.
35. Scholetzky W (2004) Use of respondent burden measurements at NASS. Proc of the Annual Conf of the Am Stat Assoc. pp 1745–1749.
36. Williams D, Green S, Jones J (2009) Measuring respondent burden in the UK Office for National Statis-tics. Proc Stats Canada Int’l Symposium 2008: Data Collection: Challenges, Achievements and New Directions. Available:http://www.statcan.gc.ca/pub/11-522-x/2008000/article/11006-eng.pdf/. Ac-cessed 3 Sept 2014.
38. Junco R, Cotten S (2012) No A 4 U: the relationship between multitasking and academic performance. Comput Educ 59(2): 505–514.
39. Pashler H (1994) Dual-task interference in simple tasks: data and theory. Psychol Bull 116(2): 220– 244. PMID:7972591