BGD
12, 6215–6284, 2015Co-variation of metabolic rates and
cell-size in coccolithophores
G. Aloisi
Title Page
Abstract Introduction
Conclusions References
Tables Figures
◭ ◮
◭ ◮
Back Close
Full Screen / Esc
Printer-friendly Version Interactive Discussion
Discussion
P
a
per
|
Discussion
P
a
per
|
Discussion
P
a
per
|
Discussion
P
a
per
|
Biogeosciences Discuss., 12, 6215–6284, 2015 www.biogeosciences-discuss.net/12/6215/2015/ doi:10.5194/bgd-12-6215-2015
© Author(s) 2015. CC Attribution 3.0 License.
This discussion paper is/has been under review for the journal Biogeosciences (BG). Please refer to the corresponding final paper in BG if available.
Co-variation of metabolic rates and
cell-size in coccolithophores
G. Aloisi
Laboratoire d’Océanographie et du Climat: Expérimentation et Approches Numériques UMR 7159, CNRS-UPMC-IRD-MNHN, 75252 Paris, France
Received: 17 March 2015 – Accepted: 27 March 2015 – Published: 27 April 2015 Correspondence to: G. Aloisi ([email protected])
BGD
12, 6215–6284, 2015Co-variation of metabolic rates and
cell-size in coccolithophores
G. Aloisi
Title Page
Abstract Introduction
Conclusions References
Tables Figures
◭ ◮
◭ ◮
Back Close
Full Screen / Esc
Printer-friendly Version Interactive Discussion
Discussion
P
a
per
|
Discussion
P
a
per
|
Discussion
P
a
per
|
Discussion
P
a
per
|
Abstract
Coccolithophores are sensitive recorders of environmental change. The size of their coccosphere varies in the ocean along gradients of environmental conditions and pro-vides a key for understanding the fate of this important phytoplankton group in the future ocean. But interpreting field changes in coccosphere size in terms of
labora-5
tory observations is hard, mainly because the marine signal reflects the response of multiple morphotypes to changes in a combination of environmental variables. In this paper I examine the large corpus of published laboratory experiments with coccol-ithophores looking for relations between environmental conditions, metabolic rates and cell size (a proxy for coccosphere size). I show that growth, photosynthesis, and to
10
a lesser extent calcification, co-vary with cell size when pCO2, irradiance, tempera-ture, nitrate, phosphate and iron conditions change. With the exception of phosphate and temperature, a change from limiting to non-limiting conditions always results in an increase in cell size. An increase in phosphate or temperature produces the op-posite effect. The magnitude of the coccosphere size changes observed in the
labo-15
ratory is comparable to that observed in the ocean. If the biological reasons behind the environment-metabolism-size link are understood, it will be possible to use coc-cosphere size changes in the modern ocean and in marine sediments to investigate the fate of coccolithophores in the future ocean. This reasoning can be extended to the size of coccoliths if, as recent experiments are starting to show, coccolith size
re-20
acts to environmental change proportionally to coccosphere size. I introduce a simple model that simulates the growth rate and the size of cells forced by nitrate and phos-phate concentrations. By considering a simple rule that allocates the energy flow from nutrient acquisition to cell structure (biomass) and cell maturity (biological complexity, eventually leading to cell division), the model is able to reproduce the co-variation of
25
growth rate and cell size observed in the laboratory when these nutrients become lim-iting. These results support ongoing efforts to interpret coccosphere and coccolith size
BGD
12, 6215–6284, 2015Co-variation of metabolic rates and
cell-size in coccolithophores
G. Aloisi
Title Page
Abstract Introduction
Conclusions References
Tables Figures
◭ ◮
◭ ◮
Back Close
Full Screen / Esc
Printer-friendly Version Interactive Discussion
Discussion
P
a
per
|
Discussion
P
a
per
|
Discussion
P
a
per
|
Discussion
P
a
per
|
1 Introduction
Coccolithophores, the main calcifying phytoplankton group, are an important compo-nent of the oceanic carbon cycle (Broecker and Clark, 2009; Poulton et al., 2007). Through their cellular processes of photosynthesis (a CO2 sink) and calcification (a source of CO2), they contribute in defining the magnitude of the ocean–atmosphere
5
CO2flux (Shutler et al., 2013). The calcium carbonate platelets (coccoliths) that make up their exoskeleton (coccosphere) provide ballast for dead organic mater in the photic zone, accelerating the export of carbon from the upper ocean to the sediments (Honjo et al., 2008). There is laboratory and field evidence that climate change is affecting
the cellular processes and global distribution of coccolithophores, with potential
con-10
sequences on the magnitude of the carbon fluxes introduced above (Gehlen, 2007; Wilson et al., 2012). For example, in laboratory cultures, coccolithophores show re-duced calcification-to-photosynthesis ratios when CO2 is changed from pre-industrial levels to those predicted for the future, acidic ocean (Hoppe et al., 2011; Langer et al., 2009; Riebesell et al., 2000; Zondervan et al., 2002). In the ocean, the coccolithophore
15
Emiliania huxleyi has been expanding polewards in the past sixty years, most likely driven by rising sea surface temperatures and the fertilizing effect of increased CO2
levels (Winter et al., 2013). Despite the great number of laboratory experiments testing the effect of multiple environmental conditions on coccolithophore physiology
(Iglesias-Rodriguez et al., 2008; Langer et al., 2012; Paasche et al., 1996; Riebesell et al.,
20
2000; Riegman et al., 2000; Rouco et al., 2013; Sett et al., 2014; Zondervan, 2007; Zondervan et al., 2002), it is hard to link laboratory results with field observations to obtain a unified picture of how coccolithophores respond to changing environmental conditions (Poulton et al., 2014).
Emiliania huxleyi is the most abundant, geographically distributed and studied
coc-25
colithophore (Iglesias-Rodríguez, 2002; Paasche, 2001; Winter et al., 2013). It exhibits a strong genetic diversity, with the different genotypes adapted to distinct
BGD
12, 6215–6284, 2015Co-variation of metabolic rates and
cell-size in coccolithophores
G. Aloisi
Title Page
Abstract Introduction
Conclusions References
Tables Figures
◭ ◮
◭ ◮
Back Close
Full Screen / Esc
Printer-friendly Version Interactive Discussion
Discussion
P
a
per
|
Discussion
P
a
per
|
Discussion
P
a
per
|
Discussion
P
a
per
|
1996) – a characteristic that explains its global distribution and ecological success in the modern ocean (Read et al., 2013). Emiliania huxleyi morphotypes, which differ
for their coccosphere size, as well as shape, size and degree of calcification of coc-coliths (Young and Henriksen, 2003), correspond to at least three genetically distinct genotypes (Cook et al., 2011; Schroeder et al., 2005). The geographical distribution of
5
Emiliania huxleyimorphotypes in the ocean is controlled by environmental conditions (Beaufort et al., 2008, 2011; Cubillos et al., 2007; Henderiks et al., 2012; Poulton et al., 2011; Schiebel et al., 2011; Smith et al., 2012; Young et al., 2014). But the ecologi-cal role of key factors such as pCO2 is controversial, with a study showing that high
pCO2 favors morphotypes with smaller and lighter coccoliths, (Beaufort et al., 2011),
10
and other studies showing the opposite (Grelaud et al., 2009; Iglesias-Rodriguez et al., 2008; Smith et al., 2012). Next topCO2, there is growing evidence that also irradiance, nutrients and temperature play a role in controlling morphotype biogeography (Berger et al., 2014; Henderiks et al., 2012; Smith et al., 2012). Despite the need for a better understanding, it is clear that the geographical distribution ofEmiliania huxleyi
morpho-15
types carries precious information on how this key coccolithophore species will react to climate change.
But there is another, more subtle effect of climate change on coccolithophores: as
living conditions evolve, cell-size and coccosphere-size adapt, due uniquely to a phys-iological response to environmental change. At the cellular scale, laboratory
experi-20
ments show thatpCO2, irradiance, temperature and nutrient concentrations affect not only rates of photosynthesis and calcification, but also cell and coccosphere size, with-out inducing a change in morphotype (Bach et al., 2011; De Bodt et al., 2010; Iglesias-Rodriguez et al., 2008; Müller et al., 2008, 2012; Oviedo et al., 2014; Rouco et al., 2013). Culture conditions also affect the size and mass of coccoliths (Bach et al., 2012;
25
BGD
12, 6215–6284, 2015Co-variation of metabolic rates and
cell-size in coccolithophores
G. Aloisi
Title Page
Abstract Introduction
Conclusions References
Tables Figures
◭ ◮
◭ ◮
Back Close
Full Screen / Esc
Printer-friendly Version Interactive Discussion
Discussion
P
a
per
|
Discussion
P
a
per
|
Discussion
P
a
per
|
Discussion
P
a
per
|
to that of coccospheres in laboratory experiments (Müller et al., 2012), in the ocean (Beaufort et al., 2008) and in marine sediments (Henderiks, 2008), and the mass of coccoliths is positively related to that of coccospheres in the ocean (Beaufort et al., 2011). These observations suggest that the physiological sensitivity of coccosphere and coccolith size to environmental conditions carries supplementary information on
5
the reaction ofEmiliania huxleyito climate change.
In the ocean, attempts are made to disentangle the effect of multiple environmental
parameters on the size and mass of Emiliania huxleyi coccospheres and coccoliths (Beaufort et al., 2008, 2011; Cubillos et al., 2007; Hagino et al., 2005; Henderiks et al., 2012; Meier et al., 2014; Poulton et al., 2011; Young et al., 2014). This is a complicated
10
task. Primarily, as explained above, because changes in cell size are partly ecological in origin and some automatic measuring procedures do not distinguish between the different morphotypes (Beaufort et al., 2008, 2011; Meier et al., 2014). Second,
be-cause environmental parameters co-vary in the field, making it hard to interpret size changes observed in the ocean in terms of those recorded in the laboratory.
Never-15
theless, a recent study based on scanning electron microscope observations suggests that the coccosphere size within a population of a given morphotype varies consider-ably and is likely under physiological control (Henderiks et al., 2012). Also the size of coccoliths of a given morphotype varies in the modern ocean (Hagino et al., 2005; Hen-deriks et al., 2012; Poulton et al., 2011) as well as the recent geological past (Berger
20
et al., 2014; Horigome et al., 2014), and could be under the control of parameters other thanpCO2(Horigome et al., 2014; Young et al., 2014). To take advantage of the physi-ological and environmental information carried by coccosphere and coccolith size, two steps need to be taken: first, the effect of single environmental parameters on
coc-cosphere and coccolith size has to be systematically observed in the laboratory and,
25
second, an understanding of the biological reasons behind cell-size changes needs to be developed.
BGD
12, 6215–6284, 2015Co-variation of metabolic rates and
cell-size in coccolithophores
G. Aloisi
Title Page
Abstract Introduction
Conclusions References
Tables Figures
◭ ◮
◭ ◮
Back Close
Full Screen / Esc
Printer-friendly Version Interactive Discussion
Discussion
P
a
per
|
Discussion
P
a
per
|
Discussion
P
a
per
|
Discussion
P
a
per
|
cell-size in five species of coccolithophores, and how this scaling compares to that of other phytoplankton groups. Second, I discuss how metabolic rates and coccosphere size of a given coccolithophore species are affected by changes in environmental
cul-ture conditions. The laboratory changes inEmiliania huxleyicoccosphere-size are com-pared to coccosphere size changes observed in the modern ocean across gradients of
5
environmental change. Finally, I propose a simple model that explains why metabolic rates and cell-size co-vary, with the hope that a few basic principles may be used in the future to extract environmental and metabolic information from coccosphere and coccolith measurements obtained in the field. This paper is based on a database of published results of culture experiments with coccolithophores – the next section
intro-10
duces this database.
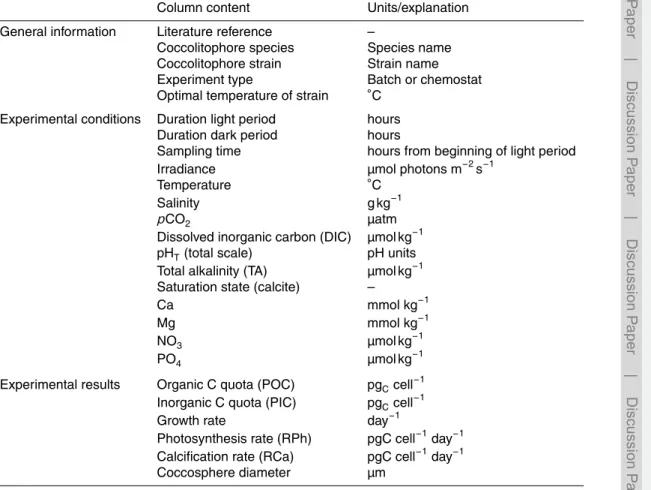
2 A database of coccolithophore metabolism and cell size
The database (Table 1, Appendix A1) is composed of data collected in 369 separate culture experiments with 28 strains belonging to five species of coccolithophores ( Emil-iania huxleyi,Gephyrocapsa oceanica,Calcidiscus leptoporus,Syracosphaera pulchra
15
andCoccolithus braarudii (formerly known asCoccolithus pelagicus)). These studies were carried out in batch reactors or chemostats, in a wide range of culture conditions, including variable irradiance, light cycle, temperature, nutrient concentration (NO3, PO4 and Fe) calcium and inorganic carbon concentrations (pCO2, DIC, total alkalinity). The salinity and the concentration of magnesium are similar to that of seawater. The
20
database reports measured values of growth rate µ, in units of day−1, the organic (POC) and inorganic (PIC) carbon quota, in units of pgC cell−1, and the cell-specific rates of photosynthesis (RPh) and calcification (RCa), in units of pgC cell−1day−1. These quantities are interrelated according to the following expressions:
RPh=µ×POC (1)
BGD
12, 6215–6284, 2015Co-variation of metabolic rates and
cell-size in coccolithophores
G. Aloisi
Title Page
Abstract Introduction
Conclusions References
Tables Figures
◭ ◮
◭ ◮
Back Close
Full Screen / Esc
Printer-friendly Version Interactive Discussion
Discussion
P
a
per
|
Discussion
P
a
per
|
Discussion
P
a
per
|
Discussion
P
a
per
|
and
RCa=µ×PIC (2)
Equations (1) and (2) were used to complete the database when only two out of three of growth rate, carbon content and cell-specific metabolic rates are presented in a given literature source. When possible, the DIC system data has been converted to the total
5
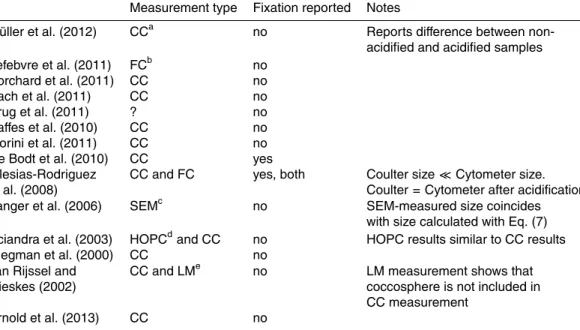
pH scale so that pCO2 can be compared across the dataset. The database includes 120 measurements of coccosphere size carried out with coulter counters, flow cytome-ters and optical and scanning electron (SEM) microscopes.
Some consideration of growth rate measurements in conditions of nutrient limitation is necessary. In nutrient-limited batch cultures, the growth rate decreases in time as
nu-10
trients are depleted, so that determining growth rates via cell counts yields erroneous results (Langer et al., 2013). Reliable growth rates in conditions of nutrient limitation can be obtained in chemostats, where the growth rate is controlled by setting the di-lution rate of the medium and the cell population is continuously renovated (Langer et al., 2013). An alternative are semi-continuous cultures where cells are periodically
15
harvested and inoculated into new medium, allowing relatively constant growth condi-tions (LaRoche et al., 2010). When considering nutrient limitation, I thus chosen to use only data produced in chemostat and semi-continuous culture experiments.
2.1 Normalized growth rates
The light cycle varies from experiment to experiment, ranging from continuous light to
20
a 12–12 h light-dark cycle. In order to compare the growth rates from experiments with different light/dark cycles, the data needs to be normalized with respect to the duration
of the light period. Since photosynthesis is restricted to the light period, growth rates (µ, in day−1) have been normalized to the length of the light period. This is done applying the following relationship (Rost et al., 2002):
25
µi=
µ×(L+D)
BGD
12, 6215–6284, 2015Co-variation of metabolic rates and
cell-size in coccolithophores
G. Aloisi
Title Page
Abstract Introduction
Conclusions References
Tables Figures
◭ ◮
◭ ◮
Back Close
Full Screen / Esc
Printer-friendly Version Interactive Discussion
Discussion
P
a
per
|
Discussion
P
a
per
|
Discussion
P
a
per
|
Discussion
P
a
per
|
whereµi (in day
−1
) is the normalized, instantaneous growth rate, µ(in day−1) is the growth rate measured via cell counts,LandDare the length (in hours) of the light and dark periods andr, the factor which accounts for the respiratory loss of carbon during the dark period, is set to 0.15 (Laws and Bannister, 1980). Thus, the instantaneous growth rateµi, in units of day
−1
, is the growth rate normalized to a light period of 24 h.
5
2.2 Normalized cell carbon quotas
The organic carbon quota (POC) is positively related to cell volume. To compare POC across the database, a large bias introduced by the sampling strategy needs to be considered. Specifically, in experiments with a light/dark cycle, POC increases during the day as small cells formed during nighttime division assimilate carbon and increase
10
in size (Linschooten et al., 1991; Müller et al., 2008; Vanbleijswijk et al., 1994; Zonder-van et al., 2002). Typically, sampling for POC measurements is carried out at different
times during the light period in different experiments. This introduces variability in the
POC data that is not related to the experimental growth conditions. When the time of sampling in the light cycle is reported, POC data have been normalized with respect
15
to the time of sampling using the following equation (the derivation of this equation is given in Appendix A1):
POC(t)=L·POC (ST) L+ST ·
1+ t L
(4)
whereLis the length (in hours) of the light period,STis the sampling time in hours after the beginning of the light period, POC(ST) is the POC measured in the experiment at
20
timeST andtis the time at which the corrected POC value is calculated.
For experiments with a light/dark cycle where the sampling time is reported, I im-posedt=L/2 in Eq. (4) to estimate the POC in the middle of the light phase. When
the time of sampling is not reported, Eq. (4) was used to estimate a minimum and a maximum POC in the middle of the light phase assuming that the reported POC
BGD
12, 6215–6284, 2015Co-variation of metabolic rates and
cell-size in coccolithophores
G. Aloisi
Title Page
Abstract Introduction
Conclusions References
Tables Figures
◭ ◮
◭ ◮
Back Close
Full Screen / Esc
Printer-friendly Version Interactive Discussion
Discussion
P
a
per
|
Discussion
P
a
per
|
Discussion
P
a
per
|
Discussion
P
a
per
|
value was measured at the end and at the beginning of the light phase, respectively. This procedure was applied also to PIC values because inorganic carbon (CaCO3) production takes place nearly exclusively during the light phase in coccolithophores (Müller et al., 2008) and PIC shows an evolution similar to POC during the light pe-riod (Zondervan et al., 2002). In experiments with continuous light the cell-cycle is
5
desynchronized such that the average cell diameter remains constant if environmental conditions do not change (Müller et al., 2008, 2012). Thus, the POC measurements were not corrected in these experiments.
2.3 Normalized cell-specific rates of photosynthesis and calcification
The normalized growth rates and normalized cell carbon quota are used to calculate
10
normalized, cell-specific rates of photosynthesis (RPhi, in pgC cell
−1
day−1) and calcifi-cation (RCai, in pgC cell
−1
day−1):
RPhi=µi·POCC (5)
RCai=µ
i·PICC (6)
where the subscript C indicates that the carbon quota refers to the value in the middle
15
of the light phase (calculated imposingt=L/2 in Eq. 4) and the subscript i indicates
that the metabolic rates are normalized with respect to the light period (Eq. 3). Thus, RPhi and RCai are the metabolic rates normalized to a light period of 24 h. When the time at which sampling occurred during the light period is not known, minimum and a maximum cell-specific rates of photosynthesis and calcification are calculated
20
assuming that the reported POC and PIC values were measured at the end and at the beginning of the light phase, respectively.
2.4 Estimating cell and coccosphere size from carbon quota
Coccosphere size data is reported only in a third of the experiments included in the dataset. To take advantage of the full set of metabolic measurements available,
BGD
12, 6215–6284, 2015Co-variation of metabolic rates and
cell-size in coccolithophores
G. Aloisi
Title Page
Abstract Introduction
Conclusions References
Tables Figures
◭ ◮
◭ ◮
Back Close
Full Screen / Esc
Printer-friendly Version Interactive Discussion
Discussion
P
a
per
|
Discussion
P
a
per
|
Discussion
P
a
per
|
Discussion
P
a
per
|
size and coccosphere size were estimated from the particulate organic (POC) and inorganic (PIC) carbon content per cell with the following expression (the full derivation is given in Appendix A1):
VSphere=
1.8×POC
dPOM
·
1+ fCY
1−fCY
+100
12 · PIC
dCaCO3
·
1+ fSh
1−fSh
(7)
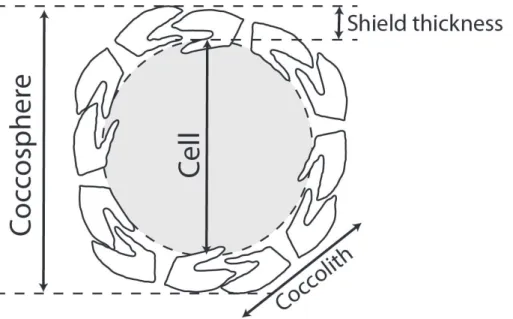
where VSphere is the volume of the coccosphere (Fig. 1), the volume of the cell and
5
shield are equal to the first and second term on the right in Eq. (7), respectively,dPOM (in g cm−3) is the density of organic matter, dCaCO3 (equal to 2.7 g cm
−3
) is the density of CaCO3 and fCY and fSh are the volume fraction occupied by water in the cell and shield, respectively. Eq. (7) assumes that cell volume scales linearly with cellular car-bon content. This assumption is reasonable for coccolithophores due to the absence
10
of large vacuoles (Paasche, 1967).
I used Eq. (7) to calculate the diameter of the cell and the coccosphere for all the experiments in the database for which POC and PIC data are available (Fig. 2). The un-knowns in this equation aredPOM,fCYandfSH. First,dPOM was set to 1.5 g cm
−3
, which lies at the center of the range of values proposed by Walsby and Raynolds (1980) (1.3–
15
1.7 g cm−3). Then fCY and fSH were varied so that the resulting diameter of the great majority of Emiliania huxleyi spheres fell in the range 3–7.5 µm, which corresponds approximately to the range reported in culture experiments (Fig. 2) and to that mea-sured microscopically in surface waters offthe coast of the Benguela upwelling system
(Henderiks et al., 2012). The chosen values offCY(0.79) andfSH(0.66) results in a
dif-20
ference between the diameter of the coccosphere and that of the cell of about 1.5 µm for most ofEmiliania huxleyithe cells (values significantly smaller or larger than 1.5 µm are interpreted in Appendix A1). This value, observed in cultures ofEmiliania huxleyi
(J. Henderiks, personal communication, 2010), corresponds roughly to twice the thick-ness of one layer of coccoliths (and thus to one layer of coccoliths in the shield around
25
BGD
12, 6215–6284, 2015Co-variation of metabolic rates and
cell-size in coccolithophores
G. Aloisi
Title Page
Abstract Introduction
Conclusions References
Tables Figures
◭ ◮
◭ ◮
Back Close
Full Screen / Esc
Printer-friendly Version Interactive Discussion
Discussion
P
a
per
|
Discussion
P
a
per
|
Discussion
P
a
per
|
Discussion
P
a
per
|
least a complete layer of coccoliths, even in growth-limited conditions (Paasche, 1999). With these parameter settings, the resulting density of the nakedEmiliania huxleyicell is 0.18 pg C µm−3, which is comparable to that of carbon in protist plankton of similar size determined by Menden-Deuer and Lessard (2000). The cell diameter obtained with this procedure is compared with that obtained applying an existing relation
be-5
tween POC and cell volume (Montagnes et al., 1994) in Appendix A1.
The calculated coccosphere diameter ofEmiliania huxleyiis compared to the mea-sured coccosphere diameter for the experiments in the database where POC, PIC and cell size data are reported (Fig. 2b). Although a clear positive relation between mea-sured and calculated coccosphere size exists, the calculated diameters are always
10
larger than the measured diameters (except for two experiments in Kaffes et al., 2010).
The large majority of coccosphere size measurements in the database were carried out with Coulter counters, which often do not include the coccolith shield in the size mea-surement. Consistently, the Coulter counter diameter forEmiliania huxleyicorresponds to the cell diameter calculated with Eq. (7) (Fig. 2b). Another source for the observed
15
discrepancy is the fact that in some experiments cells are fixed chemically prior to size measurements, a treatment that induces cell shrinkage. Appendix A1 discusses the discrepancy between measured and calculated coccosphere size more in detail. With these consideration in mind, the choice made above of constraining Eq. (7) with the range ofEmiliania huxleyi coccosphere diameters measured with the microscope
20
(Henderiks, 2008) appears to be the safest.
In Fig. 2c, the same parameterization of Eq. (7) is applied to the POC and PIC data available for the other coccolithophore species. A comparison with published cocco-sphere size data for some of these species suggests that approach is reasonable. Most of the calculated coccosphere diameters forCoccolithus braarudii, for example,
25
fall in the range 17–24 µm, which is slightly more extended that that reported in Hen-deriks (2008) (18–22 µm). The corresponding shield thickness forCoccolithus braarudii
di-BGD
12, 6215–6284, 2015Co-variation of metabolic rates and
cell-size in coccolithophores
G. Aloisi
Title Page
Abstract Introduction
Conclusions References
Tables Figures
◭ ◮
◭ ◮
Back Close
Full Screen / Esc
Printer-friendly Version Interactive Discussion
Discussion
P
a
per
|
Discussion
P
a
per
|
Discussion
P
a
per
|
Discussion
P
a
per
|
ameter measured with Coulter counters is always smaller than the calculated diameter (Fig. 2d). However, the discrepancy is small for these larger-sized species. Significantly, the coccosphere diameter ofCalcidiscus leptoporusmeasured with SEM without prior fixing of cells by Langer et al. (2006) coincides with the calculated coccosphere diam-eter using Eq. (7) (Fig. 2d). When discussing cell and coccosphere size from
experi-5
ments in the database I use Eq. (7) throughout the rest of this manuscript, regardless if size measurements are reported in the literature sources or not.
3 The allometric scaling of coccolithophore metabolism
In this section the coccolithophore database is used to investigate relationships be-tween cell volume and metabolic rates across different taxa under comparable growth
10
conditions (allometric relations). The differences in metabolic rates we will deal with
are largely due to differences in characteristic cell size across different taxa. Allometric
relationships for coccolithophores will be compared with similar relations for other phy-toplankton groups compiled by Maranon (2008). The Maranon (2008) dataset includes cell volume and metabolic rate data measured in the field for a vast array of unicellular
15
photosynthetic organisms spanning 9 orders of magnitude in size, from photosynthetic cyanobacteria (volume=0.1 µm3) to large diatoms (volume=108µm3) and including
dinoflagellates and haptophytes. The Maranon (2008) dataset reports rate measure-ments that mostly reflect in situ optimum growth conditions; thus, in this section, I focus on experiments in the coccolithophore database that were carried out in optimum
con-20
ditions (Table 2). The assumptions made in comparing metabolic rates from the coc-colithophore database with those measured in the field by Maranon (2008) are detailed in Appendix A2.
Figure 3a and b compares the allometric relations of photosynthesis and growth for coccolithophores with those established by Maranon (2008) for phytoplankton.
Fig-25
BGD
12, 6215–6284, 2015Co-variation of metabolic rates and
cell-size in coccolithophores
G. Aloisi
Title Page
Abstract Introduction
Conclusions References
Tables Figures
◭ ◮
◭ ◮
Back Close
Full Screen / Esc
Printer-friendly Version Interactive Discussion
Discussion
P
a
per
|
Discussion
P
a
per
|
Discussion
P
a
per
|
Discussion
P
a
per
|
considered. Linear regressions through the optimum coccolithophore dataset yield the following equations:
log10(RPhi)=0.89·log10(Volume)−0.66 (8)
log10(µi)=−0.11·log10(Volume)+0.1 (9)
log10(RCai)=1.02·log10(Volume)−1.02 (10)
5
The slope of the photosynthesis (0.89) and growth rate (−0.11) regressions for
coc-colithophores is very similar to that of the Maranon (2008) dataset (0.91 and−0.09, respectively) and comparable to the slope of the regression through the calcification rate data (1.02). Furthermore, the different coccolithophore species occupy a position
on the volume- photosynthesis diagram that is dictated by their cell size (Fig. 3c). These
10
plots show that (1) photosynthesis in coccolithophores – including five different species
spanning nearly three orders of magnitude in cell size – scales to cell volume in a com-parable way as it does in other phytoplankton, (2) the size dependence of growth rates is very small for coccolithophores, (3) calcification in optimum growth conditions scales isometrically with cell volume.
15
The finding of a near-isometric scaling of coccolithophore growth in laboratory ex-periments has implications for the scaling of phytoplankton population abundance with body size in the ocean. In the ocean, including a variety of contrasting marine environ-ments, phytoplankton population abundance scales with body size with an exponent equal to−3/4: in other words, small cells are more abundant than large cells (Cermeno
20
et al., 2006). Reviews of laboratory culture experiments with phytoplankton growth un-der optimal growth conditions suggest that cell-specific photosynthesis rates scale with cell volume with an exponent of 3/4 (Lopez-Urrutia, 2006; Niklas and Enquist, 2001), possibly a consequence of the generic properties of transportation networks inside the organisms (Banavar et al., 2002; West et al., 1997). According to this scaling rule,
25
growth rates scale with cell-size with an exponent of −1/4, implying that large cells grow more slowly than small cells and offering an explanation for the size scaling of
BGD
12, 6215–6284, 2015Co-variation of metabolic rates and
cell-size in coccolithophores
G. Aloisi
Title Page
Abstract Introduction
Conclusions References
Tables Figures
◭ ◮
◭ ◮
Back Close
Full Screen / Esc
Printer-friendly Version Interactive Discussion
Discussion
P
a
per
|
Discussion
P
a
per
|
Discussion
P
a
per
|
Discussion
P
a
per
|
However, the laboratory−1/4 scaling of growth rate to cell size has been challenged by the observation that the same scaling in natural communities of phytoplankton is nearly isometric (Huete-Ortega et al., 2012; Maranon, 2008; Maranon et al., 2007) (i.e. a slope in Eq. (9) nearly equal to 0 and no effect of cell size on growth rate). The size
exponent for different phytoplankton groups varies, with diatoms having a higher
ex-5
ponent (0.01) that of dinoflagellates (−0.11) (Maranon, 2008) and whole community
exponents varying from −0.01 (Maranon, 2008) to 0.16 (Huete-Ortega et al., 2012).
An isometric scaling of growth rates to cell volume has recently been also observed in laboratory experiments with 22 species of phytoplankton ranging from 0.1 to 106µm3 in volume (López-Sandoval et al., 2014; Marañón et al., 2013). In this context the
coc-10
colithophore dataset is particularly relevant because it fills in the gap of sizes between 100and 103µm3that is underrepresented in Marañóns’ (2008) dataset. Furthermore, it confirms that a scaling exponent significantly smaller than−1/4 occurs in laboratory
conditions, in addition to field situations, suggesting that cell-size is not an important factor in determining the size distribution of coccolithophore populations. Taken
to-15
gether, the near-isometric scaling of growth rate with cell size observed in the ocean by Marañón (2008) and in the laboratory (López-Sandoval et al., 2014; Marañón et al., 2013) suggest that the−3/4 scaling of phytoplankton population abundance with cell size is not due uniquely to an effect of cell size on growth rates.
We are left with a contradiction that needs to be explained: whereas in some cases
20
growth rates in the laboratory scale with cell-size with an exponent of −1/4 (Lopez-Urrutia, 2006; Niklas and Enquist, 2001), this is not the case in the ocean (Huete-Ortega et al., 2012; Maranon, 2008; Maranon et al., 2007) and in some laboratory experiments (López-Sandoval et al., 2014; Marañón et al., 2013; this work). With re-gard to laboratory experiments, López-Sandoval et al. (2014) point out that this
dif-25
BGD
12, 6215–6284, 2015Co-variation of metabolic rates and
cell-size in coccolithophores
G. Aloisi
Title Page
Abstract Introduction
Conclusions References
Tables Figures
◭ ◮
◭ ◮
Back Close
Full Screen / Esc
Printer-friendly Version Interactive Discussion
Discussion
P
a
per
|
Discussion
P
a
per
|
Discussion
P
a
per
|
Discussion
P
a
per
|
an advantage over small phytoplankton cells and provides a possible explanation for the near-isometric scaling of natural phytoplankton communities (Maranon, 2008). In laboratory experiments, where environmental parameters are typically constant, such extrinsic factors cannot be at play and some intrinsic, cellular-level, property of coccol-ithophore cells must exist that allows larger coccolcoccol-ithophores to overcome the
geomet-5
rical constraints imposed by cell size on resource acquisition (Raven, 1998). Coccol-ithophores posses carbon concentrating mechanisms (CCMs) that enable cells to take up HCO−3, as well as CO2, for photosynthesis, and interconvert HCO
−
3 to CO2 inter-nally via the carbonic anhydrate enzyme (Reinfelder, 2011; Rost et al., 2003). There is evidence form the carbon stable isotope composition of coccolithophore calcite that
10
large coccolithophore species employ CCMs more efficiently than small species when
CO2 is scarce (Bolton and Stoll, 2013). This differential use of CCMs in large and small coccolithophore species offers a plausible (even if not excusive) explanation of
why coccolithophore growth rate scales nearly isometrically with cell size in laboratory experiments.
15
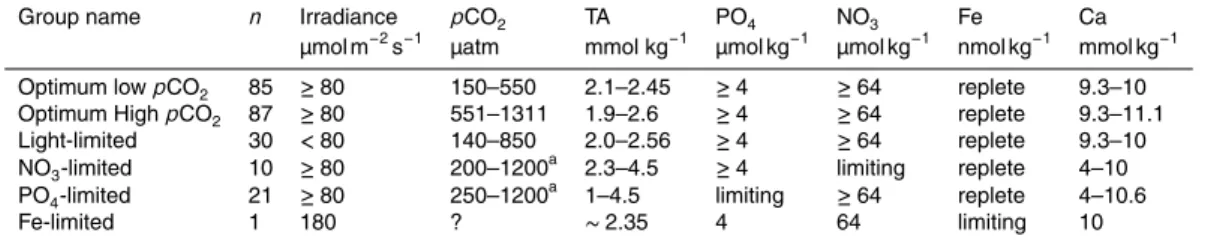
4 Environmental controls on cell size and metabolic rates in coccolithophores
In this section I investigate how changes in environmental conditions affect cell size and
metabolic rates in coccolithophores. The changes we will deal with are produced by the physiological response of a given taxon to environmental change; I will discuss the ef-fects of six environmental variables:pCO2, irradiance, temperature, nitrate, phosphate
20
and iron. Next to the optimum group of experiments introduced in Sect. 3, I highlight light-limited, nitrate-limited, phosphate-limited and iron-limited experiments. The set of conditions defining these groups is detailed in Table 2. Most of the data comes from cul-tures ofEmiliania huxleyi, the more thoroughly studied coccolithophore; experiments with the other four coccolithophores in the database have essentially tested the effect
25
BGD
12, 6215–6284, 2015Co-variation of metabolic rates and
cell-size in coccolithophores
G. Aloisi
Title Page
Abstract Introduction
Conclusions References
Tables Figures
◭ ◮
◭ ◮
Back Close
Full Screen / Esc
Printer-friendly Version Interactive Discussion
Discussion
P
a
per
|
Discussion
P
a
per
|
Discussion
P
a
per
|
Discussion
P
a
per
|
Within the optimum group of experiments, the position of the high-CO2 subgroup largely corresponds to that of the lowpCO2group (Fig. 4). A considerable number of data points collected in sub-optimal growth conditions, however, fall below the regres-sion line through the optimal data. The scatter is greater forEmiliania huxleyireflecting the fact that a much smaller number of environmental conditions have been tried out
5
for the other species. For all rates of growth, photosynthesis and calcification, the light-limited experiments consistently plot below the optimum experiments (Fig. 4). The po-sition of the nutrient-limited experiments below the optimum experiments is even more evident (Fig. 4): light-limited and nutrient limited cells have smaller metabolic rates than cells of comparable size grown in optimum conditions. For experiments where the
10
sampling time during the light period is unknown, the range of values for the photo-synthetic rate (error bars) is large and an overlap with optimum group of experiment exists. However, only 5 out of 30 experiments in the light-limited group and 9 out of 31 nutrient-limited experiments have unknown sampling times, such that the position of the experiments run in limiting conditions under the optimum group of experiments is
15
significant.
The plots of volume against metabolic rates introduced above do not take advantage of the whole potential of the experimental dataset. This is because part of the vari-ability in metabolic rates observed is due to differences in the pre-culture conditions
and, very likely, to biological variability, rather than to the experimental conditions that
20
the experiments are designed to test. A better picture is obtained if changes in cell volume are plotted againstchanges in metabolic rates. I have explored the database for sets of experiments were only one experimental condition is changed at a time, so that the change in volume and metabolic rates can be calculated by subtraction and plotted. In this way different sets of experiments can be compared on the same plot
25
BGD
12, 6215–6284, 2015Co-variation of metabolic rates and
cell-size in coccolithophores
G. Aloisi
Title Page
Abstract Introduction
Conclusions References
Tables Figures
◭ ◮
◭ ◮
Back Close
Full Screen / Esc
Printer-friendly Version Interactive Discussion
Discussion
P
a
per
|
Discussion
P
a
per
|
Discussion
P
a
per
|
Discussion
P
a
per
|
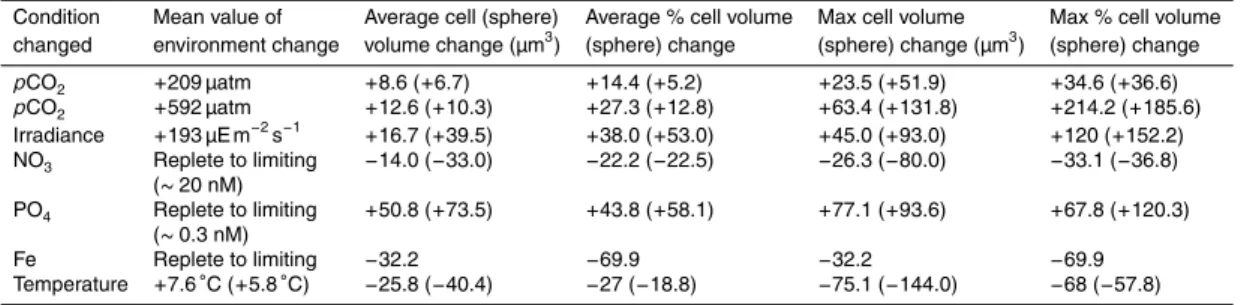
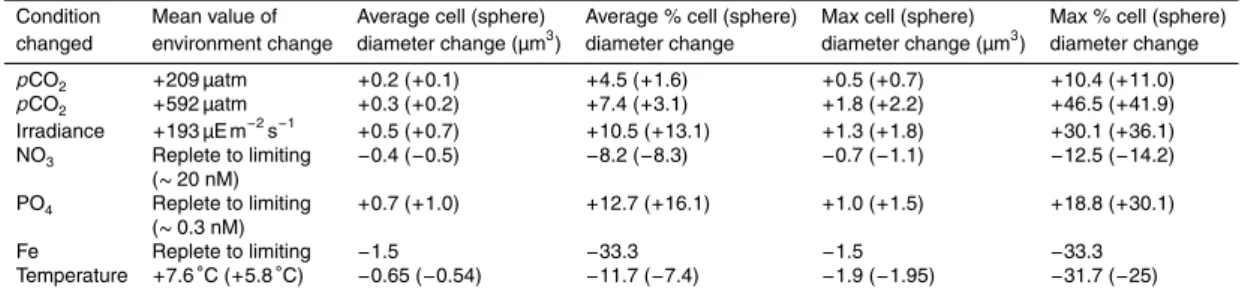
changes correspond to the evolution of the living conditions that phytoplankton are ex-periencing (warming, acidification) or are planned to experience (ocean stratification leading to increased irradiance and oligotrophy) in the coming centuries (Behrenfeld et al., 2006; Bopp, 2005; Bopp et al., 2001). Tables 3 and 4 summarize the changes in cell and coccosphere diameter and volume induced by changes in experimental
cul-5
ture conditions. They highlight an important fact: changes inpCO2produce only limited variations in coccosphere size compared to variations in other parameters such as ir-radiance, temperature and nutrients.
4.1 pCO2increase
For the low-pCO2group of experiments run in optimum conditions (Fig. 5), an increase
10
inpCO2leads to an increase in cell size and little change in the growth rate. The rate of photosynthesis increases withpCO2, indicating thatEmiliania huxleyiis carbon-limited in this range of pCO2. The biomass-specific calcification rate decreases in the great majority of the experiments, while the change in the rate of calcification can be positive or negative. Interestingly, the response of photosynthesis and calcification differ not
15
only in sign, but also in homogeneity: while the change in photosynthetic rate defines a clear trend in the volume-metabolism space, the change in calcification rate is poorly correlated with the change in cell volume. This is not surprising given that the rate of photosynthesis increases both due to the fertilizing effect of CO2(physiological effect)
and due to the increase in cell size (geometric effect), while the rate of calcification is
20
positively affected by the increase in cell-size (geometric effect) but inhibited
physiolog-ically by acidification (Raven and Crawfurd, 2012). Furthermore, the response of calcifi-cation to a rise inpCO2is modulated by the growth temperature (which varies between experiments) and can be negative or positive (Sett et al., 2014). Finally, the response of calcification inEmiliania huxleyito an increase inpCO2is known to be strain-specific,
25
BGD
12, 6215–6284, 2015Co-variation of metabolic rates and
cell-size in coccolithophores
G. Aloisi
Title Page
Abstract Introduction
Conclusions References
Tables Figures
◭ ◮
◭ ◮
Back Close
Full Screen / Esc
Printer-friendly Version Interactive Discussion
Discussion
P
a
per
|
Discussion
P
a
per
|
Discussion
P
a
per
|
Discussion
P
a
per
|
also in the high-pCO2 group of experiments (albeit with a larger scatter) and in the experiments run in conditions of light limitation (Fig. 5). The few experiments available wherepCO2is varied in conditions of nitrate limitation seem point to a similar behavior (see Appendix A3), as do the data available for other coccolithophore species (Fig. 5).
4.2 Irradiance increase in light-limited conditions
5
Increasing irradiance from irradiance-limited conditions leads to a large increase in cell-size, growth rate and rate of photosynthesis (Fig. 6). In the majority of experiments also the biomass-specific and cell-specific rate of calcification increase with irradiance. The effects on the calcification-to-photosynthesis ratio are large, with most experiments
showing an increase in calcification compared to photosynthesis. These effects are
ob-10
served both in lowpCO2and in high-pCO2conditions; they can be understood consid-ering that both photosynthesis and calcification are light-dependent, energy-requiring processes (Brownlee et al., 1995; Raven and Crawfurd, 2012). Interestingly, there is a smaller dispersion in the calcification rate data compared to the set of experiments wherepCO2is increased (Fig. 5). This is because both the geometric and physiological
15
consequences of an irradiance increase concur in increasing the rate of calcification (geometric and physiological effects have contrasting influence on calcification rate for
apCO2rise). The experiments showing a negative response of the PIC/POC ratio with increased irradiance are from Rokitta and Rost (2012) and Feng et al. (2008) where high light intensities where used (300 and 400 µmol m−2s−1, respectively), possibly
in-20
ducing photoinhibition of calcification (Feng et al., 2008).
4.3 Temperature
Both in optimum and in light-limited conditions, an increase in temperature leads to an increase in the growth, photosynthesis and calcification rate and a decrease in cell size in the majority of the experiments considered (the scatter is considerable).
25
BGD
12, 6215–6284, 2015Co-variation of metabolic rates and
cell-size in coccolithophores
G. Aloisi
Title Page
Abstract Introduction
Conclusions References
Tables Figures
◭ ◮
◭ ◮
Back Close
Full Screen / Esc
Printer-friendly Version Interactive Discussion
Discussion
P
a
per
|
Discussion
P
a
per
|
Discussion
P
a
per
|
Discussion
P
a
per
|
at temperatures 5–10◦C higher than the maxima observed at the isolation sites (Sett et al., 2014) – a pattern that seems to apply in general to phytoplankton from polar and temperate regions (Atkinson et al., 2003; Thomas et al., 2012). This trend has also been described in an long-term experiment during whichEmiliania huxleyiwas allowed to adapt for 1 year (roughly 460 asexual generations) to high temperatures (Schlüter
5
et al., 2014).
4.4 NO3, PO4and Fe limitation
Under nitrogen limitation all cell-specific and biomass-specific metabolic rates de-crease and cells become smaller (Fig. 6). The same effect on metabolic rates is
ob-served under phosphorous limitation, but the effect on cell size is opposite (Fig. 6).
10
The contrasting effect of nitrogen and phosphorous limitation on cell size depends on
the different role of these nutrient in the cell cycle (Müller et al., 2008). In the G1
(as-similation) phase of the cell-cycle, nitrogen consumption byEmiliania huxleyi cells is high because cells are synthesizing and accumulating biomass (Müller et al., 2008). Therefore, nitrogen depletion decreases assimilation rates and leads to smaller cells.
15
The result is not dissimilar from what happens during light limitation. Phosphorous consumption, instead, is highest during the S and G2 +M phases, due to synthesis
of nucleic acids and membrane phospholipids immediately before cell division (Geider and La Roche, 2002; Müller et al., 2008). Thus, phosphorous limitation is though to arrest the cells in the G1 (assimilation) phase of the cell cycle, increasing the length
20
of this phase and leading to an increase in the cell-size. Thus, in phosphorous limited cells, cell-size does not increase because the assimilation rate increases but because the assimilation period is longer. The change in the ratio of photosynthesis to calcifi-cation is generally positive. In the only set of experiments considering iron limitation (Schulz et al., 2007), cell-size co-varies with growth and photosynthesis rates in a
sim-25
ilar way as in nitrate-limited experiments (Fig. 6). Iron is a key component of carbon concentrating mechanisms (CCMs) that increase the rate of import of inorganic carbon (CO2and HCO
−
BGD
12, 6215–6284, 2015Co-variation of metabolic rates and
cell-size in coccolithophores
G. Aloisi
Title Page
Abstract Introduction
Conclusions References
Tables Figures
◭ ◮
◭ ◮
Back Close
Full Screen / Esc
Printer-friendly Version Interactive Discussion
Discussion
P
a
per
|
Discussion
P
a
per
|
Discussion
P
a
per
|
Discussion
P
a
per
|
in metabolic rates is produced by carbon-limitation (Schulz et al., 2007). The concomi-tant decrease in cell-size is consistent with the size shifts observed in the experiments wherepCO2is varied (Fig. 5).
It should be noted that the experiments included in the coccolithophore dataset are designed to quantify the instantaneous (meaning a few generations) response of
coc-5
colithophores to changing growth conditions. In longer-term experiments, lasting sev-eral hundred generations, (Lohbeck et al., 2012; Schlüter et al., 2014)Emiliania huxleyi
has been observed to adapt to elevated temperatures andpCO2conditions simulating future ocean conditions. This implies that the trends of metabolic rates and cell-size with changing environmental conditions that are described in this section will be
modu-10
lated by evolutionary adaptation, adding further complexity to the interpretation of past and future response of coccolithophores to climate change. The results of these ex-periments show, however, that the long-term response of growth rate and cell size to increased temperature and increasedpCO2are qualitatively comparable: cells adapted to high temperature decrease their cell-size while cells adapted to highpCO2increase
15
their cell size (Schlüter et al., 2014).
5 The size ofEmiliania huxleyiin the ocean: is there hope of detecting
a physiological signal?
In the previous section we saw that a change in laboratory culture conditions nearly always results in a change of cell and coccosphere-size of coccolithophores. In this
20
section the changes in coccosphere size observed in laboratory experiments are com-pared to those observed in the ocean. I will consider in some detail the BIOSOPE transect that crosses the south pacific gyre from the Marquises islands to the Peru upwelling zone (Beaufort et al., 2008). Figure 7a shows the BIOSOPE transect su-perimposed on a surface ocean chrolophyll concentraion map obtained from satellite
25
BGD
12, 6215–6284, 2015Co-variation of metabolic rates and
cell-size in coccolithophores
G. Aloisi
Title Page
Abstract Introduction
Conclusions References
Tables Figures
◭ ◮
◭ ◮
Back Close
Full Screen / Esc
Printer-friendly Version Interactive Discussion
Discussion
P
a
per
|
Discussion
P
a
per
|
Discussion
P
a
per
|
Discussion
P
a
per
|
The order Isochrysidales is composed of the genera Emiliania, Geophyrocapsa and
Crenalithus. These genera cannot be distinguished from one another by the automated SYRACO system used to measure coccosphere diameter and generate Fig. 7b. In ad-dition to SYRACO, the BIOSOPE samples were examined with a Scanning Electron Microscope and a light microscope which process less samples than SYRACO but are
5
able to distinguish the different Isochrysidales genera.
Along the BIOSOPE transect the diameter and volume of Isochrysidales cocco-spheres measured with SYRACO varies considerably (from 4.5 to 8 µm Fig. 7b). Scanning Electron Microscope and light microscope observations show that between 140◦W and 130◦W, where coccospheres are largest (mostly>6 µm in diameter),
10
Gephyrocapsa oceanica dominates the Isochrysidales assemblage (Beaufort et al., 2008). Gephyrocapsa oceanica has a characteristic cell size which is slightly larger thanEmiliania huxleyi(Fig. 3). In the Peru upwelling zone (75◦W) where SYRACO de-tects large coccospheres (mostly>6 µm in diameter), microscope observations show thatEmiliania huxleyimorphotype R, which is characteristically large (“over-calcified”),
15
is abundant. Clearly, changes in coccosphere size along the BIOSOPE transect are partly ecological in origin – an observation that can be exported to the global ocean (Beaufort et al., 2011).
But how do the cell-size changes observed along the BIOSOPE transect compare with those observed in laboratory experiments? Whereas in the ocean changes in cell
20
size can be due to both ecological and physiological effects, in the laboratory only
phys-iological effects are expected. The histograms of Fig. 8a and b show the coccosphere
diameter and volume of culturedEmiliania huxleyicells and of theIsochrysidales coc-colithophores in the BIOSOPE transect. Laboratory and field measurements compare well. The red horizontal bar graphs of Fig. 8a and b are the changes in coccosphere
25
con-BGD
12, 6215–6284, 2015Co-variation of metabolic rates and
cell-size in coccolithophores
G. Aloisi
Title Page
Abstract Introduction
Conclusions References
Tables Figures
◭ ◮
◭ ◮
Back Close
Full Screen / Esc
Printer-friendly Version Interactive Discussion
Discussion
P
a
per
|
Discussion
P
a
per
|
Discussion
P
a
per
|
Discussion
P
a
per
|
ditions imposed in laboratory cultures are compared with the range of environmental conditions along the BIOSOPE transect. Large differences in the total range exist only
for phosphate and iron, with concentrations in limited experiments being much lower than those measured in the BIOSOPE transect. Even discarding the phosphate and iron limitation experiments, it is clear that changes in environmental conditions along
5
the BIOSOPE transect are very likely to be an important driver of coccosphere size variability: physiological effects concur with ecological effects in determining
coccol-ithophore cell-size variability.
Further evidence for a physiological control on coccosphere size in the ocean comes from the Benguela coastal upwelling system, where the size of the well-calcified
Emil-10
iania huxleyimorphotype A∗(determined by SEM observations) changes considerably with environmental conditions (Henderiks et al., 2012). The largest coccospheres oc-curred at the depth of the deep chlorophyll maximum (DCM) – where growth condi-tions can be assumed to have been optimal – whereas coccospheres above and below the DCM were significantly smaller. This is consistent with the laboratory observations
15
(Sect. 4) that environmental conditions which result in large growth rates (and thus lead to large populations in the field) are also those that give rise to large cells (phosphate concentrations in the Benguela upwelling system were much larger than those which induce an increase in cell size in culture experiments).
Another, even less explored (but equally promising), avenue of research is that of the
20
physiological control of environmental conditions on the size of coccoliths. Field mea-surements of coccolith size are more abundant that meamea-surements of coccosphere size. However, as for coccospheres, it is difficult to disentangle physiological from
eco-logical effects. Clearly, different morphotypes occupy distinct ecological niches
char-acterized by different environmental conditions. For example, Cubillos et al. (2007)
25
show that Type A (“overcalcified”) and Type B/C morphotypes occupy distinct latitudinal zones in the southern ocean. Environmental conditions likely control the geographical distribution of different morphotypes on the east coast of Japan (Hagino et al., 2005),
BGD
12, 6215–6284, 2015Co-variation of metabolic rates and
cell-size in coccolithophores
G. Aloisi
Title Page
Abstract Introduction
Conclusions References
Tables Figures
◭ ◮
◭ ◮
Back Close
Full Screen / Esc
Printer-friendly Version Interactive Discussion
Discussion
P
a
per
|
Discussion
P
a
per
|
Discussion
P
a
per
|
Discussion
P
a
per
|
the South East Pacific (Beaufort et al., 2008). Clearly, part of the variability in coccolith size distribution in the global ocean is due to ecological effects (Beaufort et al., 2011).
There is laboratory and field evidence, however, that coccolith size is affected by
envi-ronmental conditions also via physiological effects. Coccosphere and coccolith size are
related (Henderiks, 2008). In laboratory cultures subject to varyingpCO2 and nitrate
5
levels, coccolith volume (which is related to coccolith length) is positively correlated to both cell and coccosphere size (Müller et al., 2012), leading to the counterintuitive co-existence of large coccoliths and acidic conditions. An increase in the size of coccol-iths with increasingpCO2has also been observed in nutrient replete, nitrogen-limited and phosphate-limited experiments (Rouco et al., 2013). In the Benguela coastal
up-10
welling system a significant positive correlation has been found between the cocco-sphere diameter and coccolith length ofEmiliania huxleyi morphotype A∗ (Henderiks et al., 2012). Since the Benguela correlation is based on SEM observaions, it is likely that ecological effects can be excluded and that the physiological effects that produce
larger coccospheres also result in the production of larger coccoliths. More in general,
15
when the coccolith size from individual morphotypes is measured along gradients of environmental conditions, it results that coccolith size varies significantly; for example off the eastern coast of Japan (Hagino et al., 2005) and along the Patagonian shelf
(Poulton et al., 2011). More experiments and field observations are needed to under-stand how other environmental parameters (e.g. temperature, irradiance and nutrient
20
availability) affect coccolith size, and to what extent laboratory observations can be
exported to the ocean. The available information suggests, however, that the environ-ment controls coccolith size via a physiological effect and that there could be as much
hidden information in the size of coccoliths as there is in the size of coccospheres – in the next section I propose a way to extract this information from the modern ocean and
25
BGD
12, 6215–6284, 2015Co-variation of metabolic rates and
cell-size in coccolithophores
G. Aloisi
Title Page
Abstract Introduction
Conclusions References
Tables Figures
◭ ◮
◭ ◮
Back Close
Full Screen / Esc
Printer-friendly Version Interactive Discussion
Discussion
P
a
per
|
Discussion
P
a
per
|
Discussion
P
a
per
|
Discussion
P
a
per
|
6 A theoretical basis for interpreting the co-variation of metabolic rates and
cell size
We saw that metabolic rates and cell-size co-vary in coccolithophores subject to changes in laboratory environmental conditions (Sect. 4) and that the changes in coccosphere size observed in the laboratory are comparable in magnitude to those
5
observed in the field along gradients of environmental change (Sect. 5). If the cel-lular processes that give rise to this co-variation are understood, there is hope that coccosphere-size measurements from the field will yield information on the metabolic status of cells in the modern ocean and, possibly, on past environmental conditions. In this section I introduce a simple model that provides a theoretical basis for
understand-10
ing how cellular metabolism – forced by environmental conditions – controls cell-size, giving rise to the correlations described in Sect. 4.
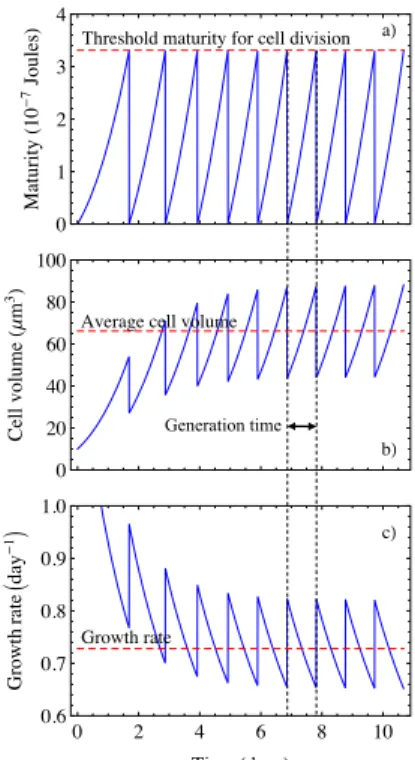
The mean size of dividing cells is the result of two factors: the rate of nutrient as-similation into biomass and the length of the generation time (the time between two successive cell divisions) – long generation times and large rates of nutrient
assim-15
ilation give rise to large cells, and vice versa. The changes in cell size observed in the previous section can be interpreted within this simple scheme. The central concept I use – that of separation ofstructure (biomass) from maturity (biological complexity, eventually leading to cell division) – is taken from the Dynamic Energy Budget (DEB) Theory (Kooijman, 2010). The model presented here is much simplified compared to
20
existing DEB models of phytoplankton cells (Lorena et al., 2010; Muller et al., 2011; Muller and Nisbet, 2014). However, it considers the minimum number of concepts that are necessary to explain the co-variance of metabolic rates and cell-size we are deal-ing with. The most important simplifications I introduce are discussed in Appendix A4; the mathematical notation in this section follows that of (Kooijman, 2010).
25
Consider a spherical growing cell assimilating NO3and PO4(CO2is considered to be non-limiting). The assimilation rate of nutrients, ˙Ji(in µmol cell
−1
BGD
12, 6215–6284, 2015Co-variation of metabolic rates and
cell-size in coccolithophores
G. Aloisi
Title Page
Abstract Introduction
Conclusions References
Tables Figures
◭ ◮
◭ ◮
Back Close
Full Screen / Esc
Printer-friendly Version Interactive Discussion
Discussion
P
a
per
|
Discussion
P
a
per
|
Discussion
P
a
per
|
Discussion
P
a
per
|
to the surface of the cell (Fig. 9):
˙
Ji=S·jimax· [i]
[i]+Ki (11)
where the subscripti represents either NO3 or PO4, ˙Jimax (in µmol µm
−2
day−1) is the surface-specific maximum nutrient uptake rate, S (in µmol µm−2) is cell surface, Ki (mol L−1) is a Monod constant for nutrient uptake and [i] (in mol L−1) is the nutrient
5
concentration. Both the cell surface and the rate of nutrient assimilation are time de-pendent because the model simulates a growing cell. Values of ˙Jimax were set equal to 4×10⁻⁹ and values of Ki were set equal to 0.2 µmol L−1 and 2 nmol L−1 for NO3
and PO4, respectively, which is in the range of values determined forEmiliania huxleyi
(Riegman et al., 2000).
10
Assimilated nutrients are used to undertake two fundamental tasks (Fig. 9): (1) in-crease the cellular biomass via production of structureand (2) increase the maturity
of the organism. In DEB theory thestructure (quantified in moles of carbon per cell) contributes to the biomass of the organism (and thus cell volume) and is composed of organic compounds that have a long residence time in the cell.Maturity(quantified in
15
Joules per cell) has the formal status of information and is a measure of the complexity of the organism (Kooijman, 2010). Fundamental biological events in the lifespan of an organism, such as cell division, take place at a threshold level ofmaturity. Assimilated N and P both contribute to structure and maturity via the fluxes ˙JGi and ˙JMATi such that mass is conserved:
20
˙
JGi=κ·J˙i (12)
and
˙
JMATi=(1−κ)·J˙i (13)
whereκ, which takes a value from 0 to 1, is the portion of the nutrient uptake flux which is dedicated to growth, and ˙JGiand ˙JMATi(in µmolicell
−1
day−1) are the fluxes dedicated
BGD
12, 6215–6284, 2015Co-variation of metabolic rates and
cell-size in coccolithophores
G. Aloisi
Title Page
Abstract Introduction
Conclusions References
Tables Figures
◭ ◮
◭ ◮
Back Close
Full Screen / Esc
Printer-friendly Version Interactive Discussion
Discussion
P
a
per
|
Discussion
P
a
per
|
Discussion
P
a
per
|
Discussion
P
a
per
|
to growth and maturity, respectively. Dimensionless parameterκ was set equal to 0.5 both for NO3and for PO4.
The growth fluxes generated from nutrient uptake, ˙JGi, are sent to a synthesizing unit (SU) for growth where biomass is synthesized at a rate ˙JG(in molCcell
−1
day−1):
˙
JG=10−6
·CNBIO·
X
i=N,P ˙
JGi
yGi
!−1
−
X
i=N,P ˙
JGi
yGi
−1
−1
(14)
5
whereCNBIO is the Redfield C/N ratio (equal to 106/16), necessary to transform the growth rate from units of molNcell
−1
day−1to molCcell
−1
day−1, and parametersyGi are the yield of nutrient fluxi to the structure. The maturation fluxes generated from nutrient uptake, ˙JMATi, are sent to another SU which tracks the build up of maturity in the cell with a rate ˙pR(in Joules cell
−1
day−1):
10
˙
pR=10
−6
·CNBIO·µMAT·
X
i=N,P ˙
JMATi
yMATi
!−1
−
X
i=N,P ˙
JMATi
yMATi
−1
−1
(15)
where µMAT (in Joules mol
−1
C ) is the chemical potential of maturity (set equal to 105joules mol−C1) and the parameters yMATi are the yield of nutrient flux i to matu-rity. In this simple model, I set the yield parameters in equations x and y such that NO3contributes primarily to the structure (yGNO3 =1;yGPO4 =0.6) and PO4to maturity
15