Article
Printed in Brazil - ©2016 Sociedade Brasileira de Química0103 - 5053 $6.00+0.00
*e-mail: [email protected]
Characterization of Pequi (
Caryocar brasiliense
) Shells and Evaluation of Their
Potential for the Adsorption of Pb
IIIons in Aqueous Systems
Dayane J. Amorim,a Hélen C. Rezende,b Érica L. Oliveira,a Ione L. S. Almeida,c Nívia M. M. Coelho,c Túlio N. Matosa and Cleide S. T. Araújo*,a
aUniversidade Estadual de Goiás, Campus Anápolis de Ciências Exatas e Tecnológicas, Henrique Santilo, 75133-900 Anápolis-GO, Brazil
bUnidade Acadêmica de Ciências Exatas, Universidade Federal de Goiás, Regional Jataí, 75805-190 Jataí-GO, Brazil
cInstituto de Química, Universidade Federal de Uberlândia, 38400-902 Uberlândia-MG, Brazil
In this study pequi (Caryocar brasiliense) shells were evaluated in relation to their potential
for the adsorption of PbII ions in aqueous systems. The adsorbent was characterized by point
of zero charge (PZC), Fourier transform infrared spectroscopy (FTIR), and scanning electron
microscopy-energy dispersive spectroscopy (SEM-EDS) and PbII ions were detected by flame
atomic absorption spectrometry (FAAS). The adsorption parameters studied were solution pH, adsorbent mass, contact time and the optimum adsorption conditions were found to be 7.0, 50 mg and 30 min, respectively, using 15 mL of the metal solution. A study on the adsorption kinetics and isotherms was performed applying the optimized conditions. The adsorption process followed a pseudo-second-order model. The experimental adsorption data were fitted to the Langmuir and Freundlich isotherm adsorptions and a very good fit to the Langmuir linear model was observed.
The maximum adsorption capacity was found to be 35.52 mg g-1.
Keywords: PbII adsorption, isotherm, kinetic of biosorption, pequi shell
Introduction
The presence of toxic metals in aqueous systems due to discharges from various industrial processes has caused serious environmental problems, particularly due to their non-biodegradability and ability to accumulate in living tissues.1
Lead is one of the most toxic of the metal ions, even in low concentrations, and exposure can lead to a wide range of adverse health effects in both adults and children. According to the US Environmental Protection Agency the current drinking water standard for lead is 300 ug L-1. At levels above 0.05 mg L-1 in drinking water PbII is a potent neurotoxic metal.2
In general, metal ions are removed from wastewater using conventional physico-chemical methods such as, electrochemical treatment, ion exchange, precipitation,
and recovery by evaporation or adsorption onto activated carbon.3-5 However, in many cases, these methods are inefficient and associated with high costs.5,6
Natural materials derived from various types of biomass have been investigated because of their ability to accumulate species on the surface (biosorption). The biosorption process involves a solid phase (adsorbent) and a liquid phase containing a dissolved species to be sorbed, which is known as the adsorbate (e.g., metal ions).7
be used as an adsorbent material for removing toxic metals from wastewaters. Several studies in which agricultural by-products have been used for the removal of PbII ions in contaminated environments have been reported in the literature.1,15-17 However, no reports on the removal of metals using pequi (Caryocar brasiliense) have been published yet.
The aim of this study was to explore the biosorption efficiency of the crushed shells of pequi (C. brasiliense) in the removal of PbII. This species, known in Brazil as pequi or “pequizeiro”, is a tree characteristic of the Brazilian cerrado, with a wide distribution in this biome.18 It plays an important economic role, due to the marketing of the fruit and derivative products mainly for human consumption, and it has received good acceptance due to its taste and nutritional value.19 The rind of the fruit is thick and rich in carbohydrates, fiber, lipids and proteins; however, it is generally not used for human consumption and is discarded.20
Experimental
Instrumentation
An atomic absorption spectrometer (AAnalyst 400, Perkin Elmer, Singapore) equipped with deuterium background correction was used to measure the concentrations of PbII by flame atomic absorption spectrometry. A hollow-cathode lamp (same manufacturer) was used as the radiation source, air/acetylene flame with flow rate of 13.5 and 2.0 L min-1, respectively, was used. The instrument was operated under conditions recommended by the manufacturer. The pH of the solutions was adjusted using a pHmeter equipped with a combined glass electrode and the addition of 0.3 mol L-1 NaOH or HNO
3 (Merck, Germany).
Reagents, solutions and samples
All solutions were prepared using deionized water obtained from a Gehaka (Brazil) water purification system and all reagents used were of analytical grade. Before use, the laboratory glassware was kept overnight in 10% (v/v) HNO3, rinsed with deionized water and dried in a dust-free environment.
Reference solutions of lead were prepared through the dilution of a 1000 mg L-1 stock solution obtained from Merck (Germany). A residue sample generated in experimental analytical chemistry classes at the State University of Goiás was used for the application of the method.
Preparation of adsorbent
Pequi (Caryocar brasiliense) was acquired from a commercial source in Anápolis city, Goiás State, Brazil. The shells were separated from the pulp, washed in deionized water and dried for 24 h at 35 ºC in an oven with air circulation Marconi (Brazil). After drying, the rind was crushed in a knife mill Marconi (Brazil) and the resulting powder was classified using a sieve shaker Bertel (Brazil). The fraction 500-850 mm was chosen to carry out the adsorption studies.
Characterization of adsorbent
To determine the point of zero charge (PZC) 50 mL of water, at different pH values (1-11), was mixed with 0.2 g of the sample. The suspensions were shaken at 140 rpm for 48 h at room temperature (25 ± 1 °C) and the final pH (pHf) of each solution was then measured.21 A graph was plotted with the values of pHf versus pHi (inicial pH). The point of intersection of pHf versus pHi (where pHi = pHf) was identified as the point at which the change in the pH of the solution was equal to zero and this is the pHPZC value.22
The functional groups involved in the metal adsorption process were identified using a Fourier transform infrared spectrometer (Perkin Elmer, FTIR 1605, United States). The spectra were recorded from 500 to 4000 cm-1 with 64 scans per spectrum. Samples collected before and after metal sorption were dried, crushed and mixed with KBr (Merck, Germany) at a ratio of 1:100.
For the thermal analysis, approximately 10 mg of adsorbent were heated to 950 °C at a heating rate of 20 ºC min-1 under an inert atmosphere of nitrogen.
The surface structure and elemental composition of the adsorbent, before and after the adsorption of PbII ions, were characterized using scanning electron microscopy-energy dispersive spectroscopy (SEM-EDS) (JMT-300, JEOL, Japan) coupled with energy-dispersive X-ray spectrometry. The samples were coated with a thin layer of gold and conductive tape was used to fix each one to the holder. The images were observed in secondary electron mode, using an accelerating voltage of 20 kV.
Adsorption studies
Adsorption experiments were carried out by mixing 15 mL of 10 mg L-1 PbII with an adequate mass of pequi shells in clean conical flasks. The mixtures were shaken (180 rpm) for 20 min, with the exception of the contact time experiment. The samples were then filtered through Whatman 32 filter papers and the metal concentrations of the filtrates were determined by flame atomic absorption spectrometry (FAAS). All experiments were carried out in triplicate and the results are reported as average values.
The kinetic experiments were performed using a PbII solution (10 mg L-1) under the optimum conditions of adsorbent dosage and pH.
In the isotherm study, adsorption experiments were carried out using various initial PbII concentrations and optimum conditions of adsorbent dosage, contact time and pH.
The amount of PbII adsorbed per gram of adsorbent, Qe (mg g-1), was calculated using the following equation 1:
o e
e
(C – C )V Q =
W (1)
where Co is the initial concentration of PbII (mg L-1), Ce is the equilibrium PbII concentration (mg L-1), V is the volume of solution used (L), and W is the mass of adsorbent used (g).
Application of the method
The adsorbent material was applied to the treatment of wastewater generated in an experimental analytical chemistry class. The sample was initially filtered to remove particulate matter and the pH was adjusted to 7.0. The adsorption procedure was performed under optimized conditions and the PbII ions were quantified before and after the removal experiments.
Results and Discussion
Characterization of adsorbent
The PZC is the pH value at which the surface charge density in the material is zero during contact between a solid material and a liquid solution. When the pH is below the pHPZC value the solid surface is positively charged and anions are adsorbed to balance the charge. In this case, the adsorbents are more effective for the removal of anionic species. In contrast, in aqueous solutions with a pH higher than the pHPZC value the surface is negatively charged and adsorbs preferentially cations.23,24 The pHPZC for pequi shells was found to be approximately pH 2.3 and thus it is expected that with a pH value higher than this the adsorption of metal ions will be favored.
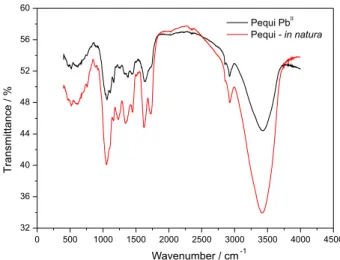
Infrared spectroscopy is an important tool in the identification of the functional groups that may be present in different substances. The adsorption capacity of an adsorbent is dependent on the chemical reactivity of functional groups at the adsorbent surface.25 In this study the possible changes in the spectrum bands after the adsorption of lead by the biosorbent material was investigated, especially with regard to the availability of the main groups in the pequi shells which are involved in the adsorption phenomenon. Figure 1 shows the Fourier transform infrared (FTIR) spectra for the pequi shells before and after adsorption. The broad band centered at 3410 cm-1 may be attributed to stretching of the -OH bond in the proteins, fatty acids, carbohydrates and lignin present in plants.23,26,27 The OH stretching can also be attributed to the presence of adsorbed water.28 There is also a contribution in this region due to stretching of the NH amide bond.21
The peaks at around 2928 cm-1 and 2818 cm-1 can be attributed to C−H stretching in the methyl and methylene groups.26,29,30 Stretching of the C=O groups is indicated by a peak at 1730 cm-1.24 The band near 1000 cm-1 can be attributed to the C−OH stretching vibration of cellulose and hemicelluloses.29 The main change in the spectrum after the removal of PbII ions was the intensity of the -OH and C=O peaks, indicating that these groups participate in the adsorption process.22,31
In SEM analysis the main surface characteristics (presence of cracks and pores) of a sample can be observed.1 Figures 2a and 2b show the micrographs for the pequi shells
in natura and Figures 2c and 2d after the adsorption of PbII obtained from the SEM analysis in the ranges of 100 and 20 mm. On the images obtained for the pequi shells in natura
an uneven surface with the presence of heterogeneous and disordered grooves was observed, while the images taken after the adsorption showed a change in the morphology of
0 500 1000 1500 2000 2500 3000 3500 4000 4500 32 36 40 44 48 52 56 60 T ra n s m it ta n c e / %
Pequi PbII Pequi -in natura
Wavenumber / cm-1
Figure 1. FTIR spectra of pequi shells before and after adsorption process.
0 500 1000 1500 2000 2500 3000 3500 4000 4500 32 36 40 44 48 52 56 60 T ra n s m it ta n c e / %
Pequi PbII Pequi -in natura
the material surface (less irregular), which can be attributed to the metal adsorption process.
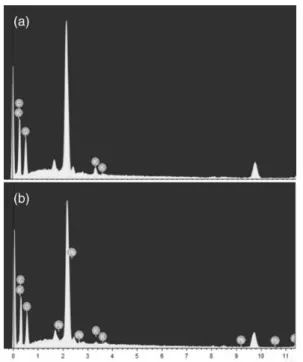
Based on the EDS spectrum shown in Figure 3 it can be observed that the structure of pequi shells in natura
is comprised of carbon (54.10%), oxygen (44.80%) and potassium (1.09%). In the spectrum for the pequi shells after the adsorption of 10 mg L-1 PbII there was a slight decrease in the amounts of carbon (53.70%), oxygen (43.79%) and potassium (0.33%) and the presence of PbII (2.17%) adsorbed on the surface of the material.
Optimization of adsorption process
Effect of pH
The adsorption process is pH-dependent, since hydrogen ions can strongly compete with the adsorbate.
It is generally observed that the adsorption process is favored by an increase in the pH, because of the metal hydrolysis reaction between binding sites of the adsorbent and the metal, where the hydrogen bond is broken and hydrogen ions are released, which are then substituted by the metal.31,32 Experiments to determine the effect of the pH were carried out by stirring 15 mL of a solution with a PbII concentration of 10 mg L-1 containing 25 mg of adsorbent material, applying a contact time of 20 min and varying the initial pH of the solutions. The results for the pH study are reported in Figure 4.
The lowest Qe value was observed for pH 2.0, since this is below the pHPCZ. The Qe value increased with increasing pH until pH 7.0, which provided the highest adsorption Qe. With increasing pH protons are probably removed from the surface of the adsorbent material releasing active sites which can be occupied by metal ions. At pH above 7.0 a reduction in the adsorption occurred, since the PbII ions can be involved in hydrolysis and precipitation processes, lowering the concentration of ions available for absorption and thus reducing the adsorption. Also, at pH 7.0 an increase in the standard deviation was observed.16 Based on these results, a pH value of 7.0 was established for further experiments.
Effect of adsorbent dosage
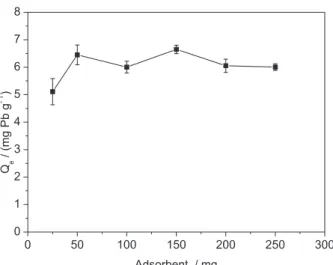
In order to study the effect of the adsorbent dosage on the removal of PbII, experiments were carried out with a solution at pH 7.0 containing10 mg L-1 of PbII and applying a contact time of 20 min. The results are shown in Figure 5. In this study, it was generally noted that with an increase in the adsorbent dosage there was an improvement in the adsorption, which is due to an increase in the number of adsorption sites and the surface area.31,33 The results obtained in this study show only a small increase in the
Figure 2. SEM micrographs of pequi shells (a,b) before; (c,d) after
adsorption process.
Figure 3. EDS spectrum of pequi shells (a) before; (b) after adsorption
process.
1 2 3 4 5 6 7 8 9 10 11 0
2 4 6 8 10
Qe
/
(m
g
Pb
g
-1 )
pH
Figure 4. Effect of initial pH of the solution on the biosorption of PbII
adsorption capacity when the mass of adsorbent was increased from 25 mg to 50 mg, and after this value the adsorptive capacity remained practically constant. The weak influence observed for the adsorbent dosage may be attributed to the metal ion concentration in the solution used. At low metal ion concentrations only a small amount of adsorbent is required. Thus, for the subsequent studies an adsorbent dosage of 50 mg was selected.
Effect of contact time
Figure 6 shows the effect of the contact time on the adsorption of PbII ions by pequi shells. A 10 mg L-1 PbII solution at pH 7.0 and 25 mg of adsorbent material were used. The results showed that in the period of 0-30 min the Qe increased, indicating that the adsorption process is relatively rapid. For contact times longer than 30 min the Qe tends to remain constant, with a small reduction in the accuracy of the measurements, demonstrating that equilibrium of the PbII biosorption was reached. Therefore, a contact time of 30 min was selected for the adsorption tests.
Adsorption kinetics
Based on the results obtained for the contact time reported in the Figure 6. The adsorption kinetics was studied according to pseudo-first-order and pseudo-second-order models, the linear forms of which are given in equations 2 and 3, respectively:
e t e 1
t log (q – q ) = log q – k
2.303 (2)
(3)
where Qe (mg g-1) is the amount of metal ion adsorbed at equilibrium, qt (mg g-1) is the amount of biosorbate at contact time t, t (min) is the contact time, k1 (min-1) is the pseudo-first-order rate constant and k2 (mg g-1 min-1) is the pseudo-second-order rate constant.33,34
Table 1 shows the kinetics parameters for the models applied. The results were analyzed considering the values obtained for the correlation coefficient (R2) and biosorption capacity calculated (Qe cal) versus experimental biosorption capacity (Qe exp). The results show that the pseudo-second-order kinetics model provided a better result for R2 and for Q
e cal and Qe exp the values provided by pseudo-second-order can be considered to be the same. In the pseudo-second-order kinetics model it is assumed that the process occurs at localized sites with no interaction between the adsorbates and that the maximum adsorption occurs with the saturation of a monolayer of adsorbates on the adsorbent surface. This leads to a chemical process involving valence forces with the sharing or exchange of electrons between metal ions and adsorbent groups.34
Adsorption isotherms
Adsorption isotherms are commonly studied to gain a better understanding of the distribution of the adsorbate between the liquid and solid phases when the adsorption process reaches an equilibrium state.35
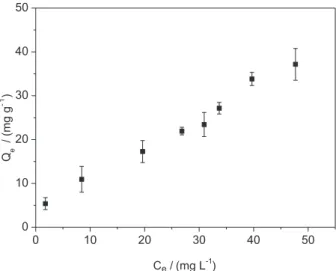
The isotherm for the PbII adsorption by pequi shells is shown in Figure 7 where it can be observed that the adsorption capacity increased on increasing the initial PbII concentration, and in the period studied saturation was not reached. Adsorption isotherms are used to describe adsorption data for a wide range of adsorbate concentrations.
The Langmuir and Freundlich isotherms are those mostly commonly used for the study of the adsorption of cationic species.
The Langmuir model is described by the linearized equation shown in equation 4.
Figure 5. Effect of adsorbent dosage on the biosorption of PbII by pequi
shells.
0 50 100 150 200 250 300
0 1 2 3 4 5 6 7 8
Qe
/
(m
g
P
b
g
-1)
Adsorbent / mg
Figure 6. Effect of contact time on the biosorption of PbII by pequi shells.
0 50 100 150 200 250 300
0.0 2.5 5.0 7.5 10.0 12.5 15.0
Q
/ (mg Pb
g
)
e
2+
-1
(4)
where Q0 (mg g-1) is the amount of adsorbate that can be absorbed by a unit mass of the adsorbent in the formation of a monolayer on the surface and is called the adsorption capacity and b (L mg-1) is the Langmuir constant, which is related to the affinity between the adsorbent and adsorbate.
The essential characteristics of the Langmuir isotherm can be described by the separation factor, RL, which describes the affinity between the adsorbate and the adsorbent that is defined by equation 5:
(5)
where Ci is the initial metal ion concentration. For RL > 1,
the isotherm is of the unfavorable type; RL = 1 indicates a linear isotherm; for 0 < RL < 1 the isotherm is favorable; and for RL = 0 the isotherm is irreversible.27
The Freundlich model can be described by the following linearized equation (equation 6):
e F e
1
log Q = log k + log C
n (6)
where kF is the constant related to the sorption capacity of the adsorbent, indicative of the affinity between the species; and n is the constant related to the sorption intensity, indicative of the effect of the metal concentration.31
The Langmuir and Freundlich isotherm were plotted and the parameters calculated for the models are given in Table 2. On comparing the R2 values it can be observed that the Langmuir model provided a higher value, which suggests that it yielded a better fit, indicating that the adsorption takes place at homogeneous sites which are identical and energetically equivalent.36
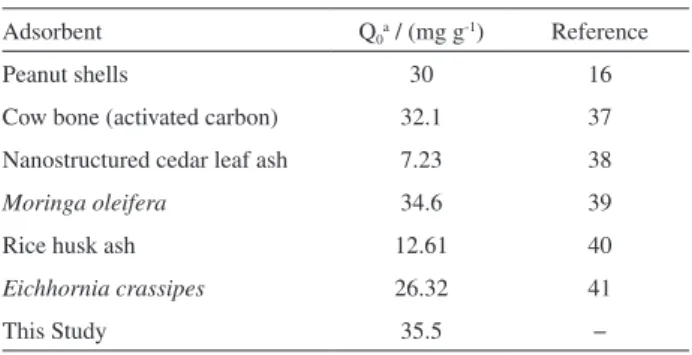
The Q0 calculated from the Langmuir model was determined to be 35.52 mg g-1. For Langmuir equilibrium parameter (RL) the value obtained was 0.25 indicating that the isotherm is favorable. Table 3 shows a comparison between the adsorption capacities of some sorbents for lead removal, this shows that pequi shells for PbII removal has a good adsorption capacity in comparison to other sorbents.
Application of the method
Table 4 shows the results for the removal of PbII from real samples. The values obtained verify the excellent potential of the use of pequi shells for the removal of PbII ions. The methodology is simple and of low cost and it can therefore be used as a remediation technique.
Table 1. Kinetics parameters for the biosorption of PbII by pequi shells
Pseudo-first-order Pseudo-second-order
k1a / min-1 Qe expb / (mg g-1) Qe calc / (mg g-1) R2d k2e / (mg g-1 min-1) Qe expb / (mg g-1) Qe calc / (mg g-1) R2d
0.00921 0.92 12.11 0.484 0.053 12.68 12.66 0.999
ak
1: Pseudo-first-order rate constant; bQe exp: experimental biosorption capacity; cQe cal: biosorption capacity calculated; dR2: correlation coefficient;
ek
2: pseudo-second-order rate constant.
Figure 7. Adsorption isotherm for the removal of PbII by pequi shells.
0 10 20 30 40 50
0 10 20 30 40 50
Qe
/
(m
g
g
-1 )
C /e (mg L-1)
Table 2. Isotherm parameters for biosorption of PbII by pequi shells
Langmuir model Freundlich model
Q0a / (mg g-1) bb / (L mg -1) R
Lc R2d kfe nf R2d
35.52 0.10 0.25 0.9971 3.49 1.71 0.9762
aQ
0: Amount of adsorbate that can be absorbed by a unit mass of the adsorbent; bb: Langmuir constant; cRL: Langmuir equilibrium parameter; dR2: correlation
coefficient; ek
Conclusions
The results reported in this paper show that pequi shells represent an alternative sorbent for PbII removal from aqueous effluents, since the procedure is simple, economically accessible and contributes to minimizing environmental impacts. The solution pH, adsorbent mass dosage and contact time were optimized. The adsorption equilibrium was satisfactorily represented by the pseudo-second-order Langmuir isotherm and the maximum adsorption capacity was 35.52 mg g-1.
Acknowledgements
The authors are grateful for financial support from the governmental agencies Conselho Nacional de Desenvolvimento Científico e Tecnológico (CNPq), Fundação de Amparo à Pesquisa do Estado de Goiás (FAPEG) and Coordenação de Aperfeiçoamento de Pessoal de Nível Superior (CAPES).
References
1. Saadat, S.; Karimi-Jashni, A.; Chem. Eng. J. 2011, 173, 743.
2. Sag, Y.; Ozer, D.; Kutsal, T.; Process Biochem.1995, 30, 169. 3. Gupta, S.; Babu, B. V.; J. Environ. Manage.2009, 90, 3013. 4. O’Connell, D. W.; Birkinshaw, C.; O’Dwyer, T. F.; Bioresour.
Technol. 2008,99, 6709.
5. Min, S. H.; Han, J. S.; Shin, E. W.; Park, J. K.; Water Res.2004, 38, 1289.
6. Guzel, F.; Yakut, H.; Topal, G.; J. Hazard. Mater.2008, 153, 1275.
7. Rao, R. A. K.; Khan, M. A.; Rehman, F.; Chem. Eng. J.2010, 156, 106.
8. Demirbas, A.; J. Hazard. Mater.2008, 157, 220.
9. Vaughan, T.; Seo, C. W.; Marshall, W. E.; Bioresour. Technol. 2001, 78, 133.
10. Fiol, N.; Villaescusa, I.; Martinez, M.; Miralles, N.; Poch, J.; Serarols, J.; Sep. Purif. Technol.2006, 50, 132.
11. Chamarthy, S.; Seo, C. W.; Marshall, W. E.; Sep. Purif. Technol. 2001, 76, 593.
12. Kumar, U.; Bandyopadhyay, M.; Bioresour. Technol.2006, 97, 104.
13. Marshall, W. E.; Chatters, A. Z.; Wartelle, L. H.; Mcaloon, A.; Ind. Crops Prod.2001, 14, 191.
14. Low, K. S.; Lee, C. K.; Liew, S. C.; Process Biochem.2000, 36, 59.
15. Santos, W. N. L.; Cavalcante, D. D.; Silva, E. G. P.; Virgens, C. F.; Dias, F. S.; Microchem. J.2011, 97, 269.
16. Tasar, S.; Kaya, F.; Ozer, A.; J. Environ. Chem. Eng.2014, 2, 1018.
17. Martín-Lara, M. A.; Rodríguez, I. L.; Blázquez, G.; Calero, M.; Desalination2011, 278, 132.
18. Silva, F. H. L.; Fernandes, S. C.; Esteves, E. A.; Titon, M.; Santana, R. C.; Rev. Bras. Fruticultura 2012, 34, 806. 19. Cardoso, L. M.; Reis, B. L.; Hamacek, F. R.; Sant’ana, H. M. P.;
Fruits2013, 68, 3.
20. Machado, M. T. C.; Mello, B. C. B. S.; Hubinger, M. D.; J. Food Eng.2013, 117, 450.
21. Lin, C.; Qiao, S.; Luo, W.; Liu, Y.; Liu, D.; Li, X.; Liu, M.; BioResources2014, 9, 6998.
22. Ribeiro, R. L. F.; Soares, V. C.; Costa, L. M.; Nascentes, C. C.; J. Hazard. Mater.2012, 237, 170.
23. Gerola, G. P.; Boas, N. V.; Caetano, J.; Tarley, C. R. T.; Gonçalves Jr., A. C.; Dragunski, D. C.; Water Air Soil Pollut. 2013, 224, 1446.
24. Dahri, M. K.; Kooh, M. R. R.; Lim, L. B. L.; J. Environ. Chem. Eng.2014, 2, 1434.
25. Jeyakumar, R. P. S.; Chandrasekaran, V.; GJRA2013, 2, 10. 26. Tasar, S.; Kaya, F.; Ozer, A.; J. Environ. Chem. Eng.2014, 2,
1018.
27. Azouaou, N.; Sadaoui, Z.; Djaafri, A.; Mokaddem, H.; J. Hazard. Mater.2010, 184, 126.
28. Mafra, M. R.; Igarashi-Mafra, L.; Zuim, D. R.; Vasques, E. C.; Ferreira, M. A.; Braz. J. Chem. Eng.2013, 30, 657.
29. Han, S.; Fang, G.; Li, S.; Liu, G.; Jiang, G.; BioResources2014, 9, 4971.
30. Ribeiro, G. C.; Coelho, L. M.; Oliveira, E.; Coelho, N. M. M.; BioResources2013, 8, 3309.
Table 3. Comparison between adsorption capacities of several sorbents
for lead removal
Adsorbent Q0a / (mg g-1) Reference
Peanut shells 30 16
Cow bone (activated carbon) 32.1 37
Nanostructured cedar leaf ash 7.23 38
Moringa oleifera 34.6 39
Rice husk ash 12.61 40
Eichhornia crassipes 26.32 41
This Study 35.5 −
aQ
0: Amount of adsorbate that can be absorbed by a unit mass of the
adsorbent.
Table 4. Results for the removal of PbII ions from the sample
Sample PbII initial / (mg L-1)
PbII final /
(mg L-1) Adsorption / %
Residue from experimental class
31. Meitei, M. D.; Prasad, M. N. D.; J. Environ. Chem. Eng.2013, 1, 200.
32. Mohammadi, S.; Mirghaffari, N.; Water, Air, Soil Pollut.2014, 226, 2237.
33. Noreen, S.; Bhatti, H. N.; Nausheen, S.; Sadaf, S.; Ashfaq, M.; Ind. Crops Prod.2013, 50, 568.
34. Shin, K.; Hong, J.; Jang, J.; J. Hazard. Mater.2011, 190, 36. 35. Armagan, B.; Toprak, F.; Pol. J. Environ. Stud.2013, 22, 1007. 36. Foo, K. Y.; Hameed, B. H.; Chem. Eng. J.2012, 187, 53. 37. Cechinel, M. A. P.; Souza, S. M. A. G. U.; Souza, A. A. U.;
J. Cleaner Prod. 2014, 65, 342.
38. Hafshejani, L. D.; Nasab, S. B.; Gholami, R. M.; Moradzadeh, M.; Izadpanah, Z.; Hafshejani, S. B.; Bhatnagar, A.; J. Mol. Liq. 2015, 2011, 448.
39. Reddy, D. H. K.; Seshaiaha, K.; Reddy, A. V. R.; Rao, M. M.; Wang, M. C.; J. Hazard. Mater.2010, 174, 831.
40. Feng, Q.; Lin, Q.; Gong, F.; Sugita, S.; Shoya, M.; J. Colloid Interface Sci.2004, 278, 1.
41. Mahamadi, C.; Nharingo, T.; Environ. Technol. 2010, 31, 1221.
Submitted: August 10, 2015