UNIVERSIDADE FEDERAL DE SÃO CARLOS
Programa de Pós-Graduação em Ecologia e Recursos Naturais
ROBERTA MAFRA FREITAS DA SILVA
Environmental drivers of bacterial
metabolism in tropical reservoirs
Reguladores do metabolismo bacteriano em reservatórios tropicais
2
ROBERTA MAFRA FREITAS DA SILVA
Environmental drivers of bacterial metabolism in tropical reservoirs
Reguladores do metabolismo bacteriano em reservatórios tropicais
Dissertação apresentada ao Programa de Pós-Graduação em Ecologia e Recursos Naturais da Universidade Federal de São Carlos, campus São Carlos, como parte dos requisitos para obtenção do título de Mestre
Área de concentração: Ecologia e Recursos Naturais
Orientador: Hugo Sarmento
4
5
6
Agradecimentos
À minha família que sempre foi meu porto seguro.
Agradeço ao Profº Dr Hugo Sarmento pela oportunidade de me aventurar em uma nova e envolvente área e por todos os ensinamentos, tanto acadêmicos quanto profissionais e pessoais.
À Fundação de Amparo à Pesquisa do Estado de São Paulo (FAPESP) pelo financiamento da pesquisa (Processos 14/14139-3 e 11/50054-4). Ao Conselho Nacional de Desenvolvimento Científico e Tecnológico (CNPq) pela bolsa concedida. Aos componentes da banca avaliadora, pelas contribuições ao trabalho, Prof Dr André Amado e, especialmente, Profa Dra Odete Rocha por permitir a utilização de seu laboratório.
Ao Profº Dr Armando Vieira por disponibilizar seu laboratório e por toda a infraestrutura necessária para a realização desse trabalho.
Aos meus queridos amigos/família da escola Lívia, Diana, Regiane, Renato e Greg; do cursinho (vários que não cabem aqui, mas todos maravilhosos) e da graduação, em especial Helena, Vinícius, Bruna, Renan, Giovanna, Ary, Pablo, Isabela, Jaque e Jonas por compartilharem comigo momentos felizes, dos quais, nunca me esquecerei.
Aos meus queridos amigos/família da pós-graduação com os quais passei dois anos maravilhosos e divertidos, dos quais, nunca me esquecerei.
À Angela Fushita por sua amizade e por seu auxílio com a o mapa da área de estudo. Aos meus queridos amigos/família do Laboratório de Ecologia de Insetos Aquáticos, do Laboratório de Processos Microbianos e Biodiversidade, e Laboratório de Ficologia por todos os momentos divertidos que passamos, em especial, Michaela Ladeira por auxiliar no artigo com ideias e pelo levantamento bibliográfico realizado, Helena e Guilherme por toda a ajuda no trabalho, Mariana e Erick.
7
A todos os professores que passaram por minha formação e que, de alguma forma, foram essenciais para a construção da profissional e cidadã que me tornei. À Prof Dra Alaide Aparecida Fonseca-Gessner pela generosidade e oportunidade em me orientar na iniciação científica e Prof Dra Susana Trivinho-Strixino por abrir as portas de seu laboratório, me auxiliando no aprendizado da identificação e ecologia de insetos aquáticos.
À todas minhas amigas da limpeza, em especial Naldia, Rosa (DHb), Rosinha (DEBE), Luciene, Gê, Dona Fátima, Dona Eva, Lúcia, Marlene, que sempre me receberam com lindos sorrisos e abraços carinhosos, além de deixar meu local de trabalho impecável. Aos técnicos Luizinho e Alcídio, por todo o apoio e diversão nas coletas, sem os quais, não seria possível desenvolver meu trabalho. À técnica Jurity, pelo esforço e dedicação em me auxiliar nas análises químicas, essenciais ao meu trabalho.
Ao Laboratório de Biogeoquímica da Universidade Federal do Rio de Janeiro (UFRJ) por nos auxiliar com as análises de produção bacteriana.
À Andreia, por todo o carinho e preocupação comigo e todos os outros alunos, sempre trazendo alegria, beleza e guloseimas ao laboratório.
Às secretárias e aos estagiários do DHb, em especial, Fabiana, que sempre foi super solícita e carinhosa comigo e todos do departamento. Aos secretários do PPGERN, João e Roseli, por sempre nos auxiliar e tirar nossas dúvidas em relação à pós, além de nos ensinarem A VER O EDITAL!!!
À Simone e à Franscielly do Instituto Nacional de Meteorologia (INMET) por gentilmente cederam os dados meteorológicos utilizados nesse trabalho e ao Jefferson, técnico da empresa Leco, que nos auxiliou nos reparos do CHN.
Ao Talenthus Karaokê, Bar do Toco, Viva Cuba, Black Bird, Saint Patrick, Espaço Múltiplo e festas acadêmicas pelos momentos de descontração proporcionados (porque ninguém é de ferro!).
A todas as pessoas que não citei o nome aqui, mas que com certeza têm um lugar especial em meu coração e em minha história.
9
Resumo
Reservatórios de regiões tropicais são fontes de carbono (C) para a atmosfera e o metabolismo bacteriano é um processo fundamental na regulação dessas emissões. No entanto, estudos que elucidem os fatores ambientais que determinam o metabolismo bacteriano em reservatórios tropicais são ainda escassos. Neste estudo foram medidas taxas metabólicas e parâmetros limnológicos em quatro reservatórios em cascata que formam um gradiente de estado trófico, com o intuito de determinar os reguladores do metabolismo bacteriano em uma região tropical e compará-los com dados obtidos a partir da literatura disponível (principalmente de regiões temperadas). Nossos modelos de regressão múltipla selecionaram variáveis relacionadas ao estado trófico como os principais reguladores da produção bacteriana (PB) e da eficiência de crescimento bacteriano (ECB). Foi encontrada uma relação fraca e negativa entre a respiração bacteriana (RB) e o carbono orgânico dissolvido (COD), diferente dos dados da literatura. As taxas de RB foram sempre elevadas, especialmente em reservatórios menos produtivos, nos quais as comunidades planctônicas estavam limitadas por fósforo. A escassez de nutrientes, as elevadas temperaturas e a alta intensidade de luz incidente aumentam o grau de hostilidade, e as células devem investir mais energia em mecanismos de reparação, o que direciona o metabolismo para a RB. Isso foi observado nos reservatórios estudados, especialmente, nos ambientes mais oligotróficos (Nova Avanhandava e Três Irmãos) nos quais a RB foi mais elevada e a ECB mais baixa. Nossos resultados indicam que os mecanismos reguladores do metabolismo bacteriano podem variar de acordo com a latitude.
Palavras-chave: produção bacteriana, respiração bacteriana, eficiência de crescimento
10
Abstract
Reservoirs located in tropical regions are main carbon (C) sources to the atmosphere, and bacterial metabolism is a key process that regulates those emissions. However, studies on the environmental drivers of bacterial metabolism in tropical reservoirs are scarce. By measuring metabolic rates and the limnological parameters in four cascading reservoirs that form a trophic state gradient, we determined the environmental drivers of bacterial metabolism in a tropical region, and compared them with those found in the literature (mainly from temperate regions). Our multiple regression models selected variables related to the trophic state as the main drivers of bacterial production (BP) and bacterial growth efficiency (BGE). On the other hand, bacterial respiration (BR), and consequently bacterial carbon demand (BCD), were weakly and negatively correlated to dissolved organic carbon (DOC), contrasting with the literature data. BR was always high, especially in less productive reservoirs where planktonic communities were limited by phosphorus. Nutrient limitation, high temperatures and high incident light intensity increased the environmental hostility, and cells must invest more energy in maintenance mechanisms, which directs the metabolism towards BR. This was observed in the reservoirs studied, especially in the more oligotrophic environments (Nova Avanhandava and Três Irmãos) where BR was higher and ECB lower. Our results indicate that the regulatory mechanisms of bacterial metabolism may vary according to latitude.
11
Lista de abreviaturas e siglas
BB – Barra Bonita
BCD – bacterial carbon demand
BGE – bacterial growth efficiency
BP – bacterial production
BR – bacterial respiration
C – carbon ou carbono
Chl a – clorofila a
CO2 –carbon dioxide ou dióxido de carbono
DCB – demanda de carbono bacteriano
DOC – dissolved organic carbon
ECB – eficiência de crescimento bacteriano
EM – energia de manutenção
GEE – gases do efeito estufa
GF/F - glass-fiber filter
MOD – matéria orgânica dissolvida
N – nitrogênio
12
P – fósforo
PB – produção bacteriana
PCH – pequena central hidrelétrica
POC – particulate organic carbon
PON – particulate organic nitrogen
POP – particulate organic phosphorus
PR - Promissão
RB – respiração bacteriana
RE – respiração celular específica
RT – residence time
SGR – specific growth rate
TCA – trichloroacetic acid
TI – Três Irmãos
UHE – usina hidrelétrica
13
Lista de figuras (Cap. I)
Figura 1. Diagrama hipotético demonstrando as relações entre fatores de estresse ambiental (ou “hostilidade” ambiental) e a partição da energia em células bacterianas,
decorrente da eficiência de crescimento bacteriano (ECB) e respiração celular específica (RE). Com o aumento da hostilidade ambiental, mais energia é dirigida à manutenção celular (EM). Dessa forma, a ECB decai e a RE aumenta. Adaptado e traduzido de Carlson et al., 2007.
Figura 2. Representação da razão C:P em sistemas aquáticos. Espécies individuais de algas em cultura (Healey e Hendzel, 1979), ou partículas do séston misturadas em amostras de lago (Elser e Hassett, 1994), mostram uma ampla gama de razões C:P (todas dadas em molar). A razão C:P de bactérias heterotróficas parece ser mais limitada, mas novamente, linhagens individuais em culturas (Kyle, 1994) e coleções de partículas do tamanho de bactérias de ecossistemas naturais (Vadstein et al., 1988) indicam considerável variabilidade nas razões C:P dentro de linhagens, embora a faixa de variação seja menor que a observada em algas. Em contrapartida, para metazoários do zooplâncton têm sido mostrada pequena variabilidade intraespecífica, e variabilidade interespecífica um pouco mais elevada (Hessen, 1990; Andersen e Hessen, 1991; Hessen e Lyche, 1991). A gama total de razões C:P em metazoários do zooplâncton é consideravelmente menor que em bactérias ou algas e varia de 100 a 200. Finalmente, as razões C:P de peixes são também limitadas, sendo também baixas (Davis e Boyd, 1978; Penczak, 1985; George, 1994). Adaptado e traduzido de Sterner et al.,1998.
14
List of figures (Cap. II)
Fig. 1. Location of the Tietê River in the Paraná River basin, with the four reservoirs studied.
Fig. 2. Accumulated precipitation and air temperature (minimum and maximum) in Barra Bonita during the study period (INMET, 2016)
Fig. 3. Mean and standard deviation of the main environmental variables by sampling month. A: temperature; B: residence time; C: chlorophyll a; D: euphotic zone; E: dissolved organic carbon
Fig. 4. Mean and standard deviation of the main environmental variables by reservoir. Barra Bonita: BB; Promissão: PR; Nova Avanhandava: NO; Três Irmãos: TI. A: temperature; B: residence time; C: chlorophyll a; D: euphotic zone; E: dissolved organic carbon
Fig. 5. Mean and standard deviation of the main biotic variables by sampling month. A: bacterial production; B: bacterial respiration; C: bacterial growth efficiency; D: bacterial carbon demand
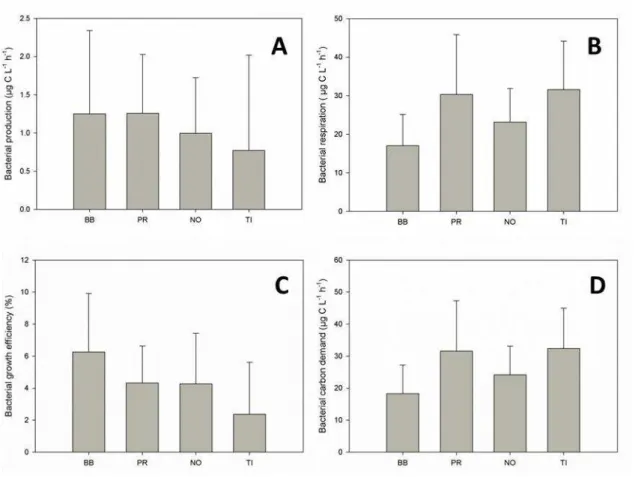
Fig. 6. Mean and standard deviation of the main biotic variables by reservoir. Barra Bonita: BB; Promissão: PR; Nova Avanhandava: NO; and Três Irmãos: TI. A: bacterial production; B: bacterial respiration; C: bacterial growth efficiency; D: bacterial carbon demand
15
Lista de tabelas (Cap. I)
Tabela 1: Revisão bibliográfica de estudos que encontraram relações significativas entre variáveis do metabolismo bacteriano (PB, RB e ECB) com fatores ambientais agrupados por: “Fitoplâncton” – clorofila a, produção primária, feopigmentos; “Carbono” – carbono orgânico dissolvido, carbono orgânico total, índice de fluorescência e índices de absorbância; “Nitrogênio” – nitrogênio total, nitrogênio dissolvido, amônia, nitrito; “Fósforo” – fósforo total, fósforo dissolvido; “Outros” – grazing, infecção viral e outros fatores bióticos.
Tabela 2. Comparação entre características de lagos estratificados e reservatórios (traduzido de Straškraba, 1996).
16
List of tables (Cap. II)
Table 1: Mean, minimum and maximal values of environmental parameters and bacterial metabolism variables measured in the four reservoirs studied (BB: Barra Bonita; PR: Promissão; NO: Nova Avanhandava; TI: Três Irmãos).
Table 2. Correlation matrix and significance values between environmental parameters and bacterial metabolism variables (* <0.05; ** <0.001; *** <0.0001; log transformed data, excepting BGE; outlaier removed Barra Bonita reservoir from March 2016).
Table 3. Multiple regressions coefficients (ß) and intercept (ß0) of the best models for
17
Sumário
Capítulo I ... 18
Introdução Geral ... 18
Introdução Geral ... 19
Metabolismo bacteriano ... 20
Fontes de nutrientes e de matéria orgânica e metabolismo bacteriano ... 24
Referências ... 34
Capítulo II ... 44
Environmental drivers of bacterial metabolismo in tropical reservoir ... 44
Introduction ... 45
Materials and methods ... 47
Study area and sampling ... 47
Environmental variables ... 48
Metabolic rates ... 49
Statistical analyses ... 50
Results ... 52
Discussion ... 62
Conclusões ... 66
References ... 67
18
Capítulo I
19
Introdução Geral
Bactérias heterotróficas são os principais decompositores da matéria orgânica em ambientes aquáticos, contribuindo com boa parte da respiração e produção planctônica (Cotner e Biddanda, 2002). São também a principal forma de entrada e de reintegração do carbono orgânico dissolvido disponível no ambiente para as teias tróficas aquáticas (Azam et al., 1983), e emitem CO2 como subproduto de sua respiração
(del Giorgio et al., 1997; Cole et al., 2007). Além disso, as bactérias desempenham importantes processos ecossistêmicos como a ciclagem do carbono, nitrogênio e fósforo, realizando a mineralização desses nutrientes (Tranvik et al., 2009; Amado et al., 2013). Além de todas essas funções, bactérias heterotróficas também são capazes de colonizar diferentes zonas climáticas (boreal, temperada e tropical), todos os tipos de ambientes, como lagos, rios, vulcões, geleiras, e são elementos essenciais para a manutenção dos ecossistemas.
20
por organismos de níveis tróficos superiores, subsidiando a cadeia trófica clássica. Essa estrutura trófica foi denominada “alça microbiana” (Azam et al., 1983).
Ambientes de água doce, constituídos por córregos, rios, riachos, lagos, lagoas, reservatórios entre outros, têm importante papel e influência na ciclagem do carbono em escala global, sendo bastante ativos no transporte, mineralização e acúmulo desse elemento (Cole et al., 2007). Embora ocupem apenas cerca de 1% da superfície do planeta, ecossistemas dulcícolas emitem grandes quantidades de carbono para a atmosfera (Tranvik et al., 2009). Desse total, sistemas tropicais são responsáveis por cerca de 60% das emissões de gases do efeito estufa (Aufdenkampe et al., 2011).
Metabolismo bacteriano
O metabolismo de bactérias heterotróficas se decompõe em produção de biomassa pela produção secundária (produção bacteriana [PB]) e utilização de carbono orgânico em sua respiração, que é o conjunto de processos bioquímicos necessários para a liberação de energia que mantém as funções do organismo, liberando como subproduto o CO2 (respiração bacteriana [RB]). Denomina-se demanda de carbono
21
22
Tabela 1: Revisão bibliográfica de estudos que encontraram relações significativas entre variáveis do
metabolismo bacteriano (PB, RB e ECB) com fatores ambientais agrupados por: “Fitoplâncton” –
clorofila a, produção primária, feopigmentos; “Carbono” – carbono orgânico dissolvido, carbono
orgânico total, índice de fluorescência e índices de absorbância; “Nitrogênio” – nitrogênio total,
nitrogênio dissolvido, amônia, nitrito; “Fósforo” –fósforo total, fósforo dissolvido; “Outros” –grazing,
infecção viral e outros fatores bióticos.
Metabolismo Grupo de variáveis N % de estudos Referências
PB Fitoplâncton 14 58 2, 5, 6, 9, 10, 14, 15, 16, 17, 19, 20, 21, 23, 25
Carbono 10 42 3, 4, 8, 9, 12, 16, 17, 20, 21, 22
Fósforo 5 21 8, 14, 15, 20, 22
Nitrogênio 4 17 6, 20, 22, 24
Temperatura 4 17 1, 19, 20, 23
Outros 8 33 7, 16, 17, 18, 19, 20, 21, 25
RB Carbono 6 60 3, 8, 12, 16, 17, 18
Temperatura 3 30 7, 17, 18
Fitoplâncton 1 10 5
Fósforo 1 10 8
Nitrogênio 1 10 11
Outros 5 50 11, 14, 16, 17, 18
ECB Carbono 6 60 3, 8, 16, 17, 22, 24
Fitoplâncton 3 30 5, 16 17
Temperatura 3 30 5, 7, 24
Fósforo 2 20 8, 22
Nitrogênio 1 10 24
Outros 2 20 17, 18
Referências: Adams et al. 2010 (1); Présing et al. 1997 (2); Berggren et al. 2009 (3); Bergstrom e Jansson 2000 (4); Berman et al., 2010 (5); Bertilsson et al. 2007 (6); Biddanda et al. 2001 (7); Cammack et al. 2004 (8); Chrost et al. 2000 (9); Chrzanowski e Hubbard 1988 (10); Cimbleris e Kalff 1998 (11); Jansson et al. 2008 (12); Jugnia et al. 2006 (13); Kritzberg et al. 2005 (14); Ram et al. 2005 (15); Ram et al. 2013 (16); Ram et al. 2015 (17); Ram et al. 2016 (18); Robarts e Wicks 1990 (19); Robarts et al. 1994 (20); Simon e Tilzer 1987 (21); Smith e Prairie 2004 (22); Tulonen 1993 (23); Vidal et al. 2015 (24); White et al. 1991 (25).
23
celular o que, consequentemente, aumenta a respiração celular específica (RE). Sendo assim, com o aumento do grau de hostilidade, haverá decréscimo na ECB.
Figura 1. Diagrama hipotético demonstrando as relações entre fatores de estresse ambiental (ou
“hostilidade” ambiental) e a partição da energia em células bacterianas, decorrente da eficiência de crescimento bacteriano (ECB) e respiração celular específica (RE). Com o aumento da hostilidade ambiental, mais energia é dirigida à manutenção celular (EM). Dessa forma, a ECB decai e a RE aumenta. Adaptado e traduzido de Carlson et al. 2007.
A temperatura é um fator chave para a regulação do metabolismo bacteriano (White et al., 1991; Vázquez-Domínguez et al., 2007; Sarmento et al., 2010). Segundo a teoria metabólica da ecologia (Brown et al., 2004) o metabolismo dos organismos tende a ser mais elevado em ambientes com temperaturas mais altas. Devido à maior incidência de radiação solar nos trópicos, aliada
24
Além da temperatura, a configuração da teia trófica pode afetar a abundância bacteriana (Sarmento, 2012; Domingues et al., 2016; Segovia et al., 2016). Uma meta-análise comparou taxas metabólicas de bactérias heterotróficas (PB, RB, DCB) de águas continentais de sistemas temperados e tropicais (Amado et al., 2013), mostrando que em latitudes mais baixas a ECB é menor que nos ambientes temperados.
Estudos prévios mostram que PB e RB se relacionam positivamente com a temperatura, porém, com ECB essa relação se inverte em ambientes com limitação por nutrientes como nitrogênio e fósforo (Rivkin e Legendre, 2001; Berggren et al., 2010). A ECB apresenta uma grande variação em diferentes ambientes aquáticos, variando entre menos de 0,05 e raramente superando 0,6 (del Giorgio et al., 1997; Kritzberg et al., 2005). Isso ocorre devido às taxas respiratórias bacterianas serem bem maiores que as taxas de produção, principalmente em ambientes mais quentes, resultando em menor ECB (Amado et al., 2013).
Fontes de nutrientes e de matéria orgânica e metabolismo bacteriano
25
do solo para agricultura, aliado ao despejo de resíduos industriais e domésticos em corpos d’água (Abe et al., 2003), causam impactos em ecossistemas aquáticos, e ambientes tropicais são particularmente sensíveis a esses aportes (Downing et al., 1999). Aportes de nutrientes podem alterar a dinâmica das comunidades de ambientes aquáticos e afetar o ciclo do carbono, nomeadamente, as emissões de gases de efeito de estufa para a atmosfera (Schindler et al., 2008). Sistemas eutróficos fornecem substrato para o desenvolvimento de microalgas (principalmente cianobactérias) e macrófitas. Estes produtores primários são a principal reserva de carbono orgânico desses ambientes e constituem a principal fonte de matéria orgânica para as bactérias (Simon et al., 1992).
26
magnitude de variação das razões C:P, superando a amplitude observada para algas (Godwin e Cotner, 2015).
Figura 2. Representação da razão C:P em sistemas aquáticos. Espécies individuais de algas em cultura (Healey e Hendzel 1979), ou partículas do séston misturadas em amostras de lago (Elser e Hassett 1994), mostram uma ampla gama de razões C:P (todas dadas em molar). A razão C:P de bactérias heterotróficas parece ser mais limitada, mas novamente, linhagens individuais em culturas (Kyle 1994) e coleções de partículas do tamanho de bactérias de ecossistemas naturais (Vadstein et al. 1988) indicam considerável variabilidade nas razões C:P dentro de linhagens, embora a faixa de variação seja menor que a observada em algas. Em contrapartida, para metazoários do zooplâncton têm mostrado pequena variabilidade intraespecífica, e variabilidade interespecífica um pouco mais elevada (Hessen 1990; Andersen e Hessen 1991; Hessen e Lyche 1991). A gama total de razões C:P em metazoários do zooplâncton é consideravelmente menor que em bactérias ou algas e varia de 100 a 200. Finalmente, as razões C:P de peixes são também limitadas, sendo também baixas (Davis e Boyd 1978; Penczak 1985; George 1994). Adaptado e traduzido de Sterner et al. 1998.
27
terrestre na biomassa bacteriana. Mesmo com o aumento da produtividade do sistema, a utilização de COD alóctone será constante. Porém, não é possível inferir qual o verdadeiro grau de assimilação de COD alóctone, uma vez que o C é utilizado de diferentes formas pelas comunidades bacterianas (convertido para produção ou respiração). Também observaram que C autóctone é principalmente voltado à respiração bacteriana e C terrestre para a produção de biomassa. Além disso, há preferência por C produzido por algas, devido sua labilidade e qualidade (Guillemette et al., 2016), embora estudos prévios mostrem que o C autóctone pode não ser imediatamente respirado, mas que uma parcela pode ser acumulada ao longo do tempo (Bade et al., 2007). Resumindo, os padrões de degradação do carbono orgânico variam de acordo com a disponibilidade de nutrientes e o grau de trofia do sistema (Guillemette et al., 2013).
Reservatórios em cascata como modelo para o estudo do metabolismo bacteriano
Reservatórios artificiais são sistemas aquáticos amplamente distribuídos pelo globo e, desses, aproximadamente 20% estão associados a hidrelétricas, que abarcam uma vasta porção dos ambientes de água doce (Barros et al., 2011). Esses ambientes são responsáveis pela emissão de gases do efeito estufa (GEE) como CO2 e CH4, (Rudd et
28
dos cursos d’água (Fig. 3), tendendo à menor perda de energia (Vannote et al., 1980). São construídos em bacias de drenagem, principalmente em suas extremidades inferiores (Kalff, 2002) e têm características distintas quando comparadas a lagos naturais (Tabela 2).
29
Tabela 2. Comparação entre características de lagos estratificados e reservatórios (traduzido de Straškraba
1996.).
Característica Lagos Reservatórios Diferenças quantitativas (absolutas)
Origem Natural Antropogênica
Idade geológica Antiga (≥ Pleistoceno) Maioria recente (< 60 anos) Envelhecimento Lento Rápido (primeiros anos) Formado por preenchimento Depressões Vales dos rios
Forma Regular Dendrítica
Taxa de desenvolvimento da margem Baixa Alta
Profundidade máxima Próximo ao centro Extremo (na barragem) Sedimentos do fundo Mais autóctone Mais alóctone Gradientes longitudinais Influenciados pelo vento Influenciados pelo fluxo
Profundidade de saída Superfície Fundo
Diferenças qualitativas (relativas)
Bacia: área do lago Menor Maior Tempo de retenção da água Mais longo Mais curto
Acoplamento com bacia Menor Maior Morfometria Em forma de U Em forma de V Nível de flutuações Menor Maior
30
Figura 3. Representação da função dos reservatórios de acordo com a localização em um continuum
rios-lagos (Adaptado e traduzido de Kimmel e Groeger 1984).
Dentre os reservatórios tropicais brasileiros, aqueles inseridos no Rio Tietê, na porção superior do Rio Paraná, são de porte médio. O Rio Tietê é o maior rio do estado de São Paulo, com aproximadamente 1.100 km de extensão, com nascente no município de Salesópolis e foz no Rio Paraná. Localiza-se em uma área de drenagem de seis sub-bacias hidrográficas (Alto Tietê, Sorocaba/Médio Tietê, Piracicaba-Capivari-Jundiaí, Tietê/Batalha, Tietê/Jacaré e Baixo Tietê) e apresenta confluência com o Rio Paraná. Está inserido na Bacia Hidrográfica do Rio Paraná. É um dos principais rios do Estado de São Paulo, com grande importância econômica e social (Abe et al., 2003) e o Alto Tietê é a região mais urbanizada, sofrendo grande impacto da ação humana, resultando na aceleração da eutrofização do ambiente (Esteves et al., 2007). Com o rápido aumento populacional e industrial, essa região se tornou a mais habitada e industrializada do país, exigindo aumento na demanda de energia elétrica e abastecimento de água. Dessa forma, foram construídos diversos reservatórios nesse rio.
32
Tabela 3. Características dos quatro reservatórios em cascata do Rio Tietê. CESP , 1998.
Esse conjunto de usinas hidrelétricas (UHEs) forma o que é denominado cascata de reservatórios, ou seja, um complexo de reservatórios distribuídos ao longo de um mesmo rio, no caso, o Rio Tietê. Essa conformação favorece a influência do reservatório mais próximo à montante sobre os subsequentes, mais próximos à jusante. Dessa forma, a concentração de nutrientes de cada sistema varia, havendo a formação de um gradiente de estado trófico. É o caso das quatro usinas hidrelétricas supracitadas, que formam uma cascata (Barbosa et al., 1999) com nítido gradiente de estado trófico. Barra Bonita é o mais impactado devido às grandes descargas de esgoto industrial e doméstico, provenientes da cidade de São Paulo. Ao longo da cascata de reservatórios os nutrientes vão sendo retidos na biomassa de produtores primários e a qualidade da água vai melhorando, com diminuição na concentração de nutrientes, diminuição da biomassa fitoplanctônica e aumento na transparência da água (Barbosa et al., 1999).
Deste modo, o conjunto de reservatórios forma um gradiente de estado trófico de montante a jusante, e este sistema torna-se ideal para testar a resposta do metabolismo microbiano às quantidades de recursos (nutrientes e matéria orgânica) ao longo desse gradiente. Entretanto, muitos outros fatores podem influenciar a dinâmica desses sistemas, por exemplo, tempo de residência, taxas pluviométricas, abertura e fechamento das comportas da barragem, profundidade e tamanho do reservatório (Kalff, 2002).
Levando em consideração todos esses fatores e tendo em conta a escassez de estudos da dinâmica temporal do metabolismo bacteriano em sistemas tropicais, o presente trabalho pretende analisar a influência do gradiente de estado trófico ao longo do conjunto de reservatórios dispostos em cascata no Rio Tietê, conjuntamente com outros fatores ambientais (temperatura, pH, disponibilidade de nutrientes e carbono
Área inundada (km2) Volume (m3x106) Início de operação
Barra Bonita 310 3.135 1963
Promissão 530 7.418 1975
Nova Avanhandava 210 2.720 1982
33
34
Referências
ABE, D. S. et al. Denitrification and bacterial community structure in the cascade of six reservoirs on a tropical river in Brazil. Hydrobiologia, v. 504, n. 1-3, p. 67-76, 2003.
ABRIL, G. et al. Carbon dioxide and methane emissions and the carbon budget of a 10-year old tropical reservoir (Petit Saut, French Guiana). Global Biogeochemical Cycles, v. 19, n. 4, 2005.
ADAMS, H. E.; CRUMP, B. C.; KLING, G. W. Temperature controls on aquatic bacterial production and community dynamics in arctic lakes and streams.
Environmental Microbiology, v. 12, n. 5, p. 1319-33, 2010.
AITKENHEAD-PETERSON, J. A.; MCDOWELL, W. H.; NEFF, J. C. Sources, production, and regulation of allochthonous dissolved organic matter inputs to surface waters. p. 25-70, 2003.
AMADO, A. M. et al. Tropical freshwater ecosystems have lower bacterial growth efficiency than temperate ones. Frontiers in Microbiology, v. 4, 2013.
ANDERSEN, T.; HESSEN, D. O. Carbon, nitrogen, and phosphorus content of freshwater zooplankton. Limnology and Oceanography, v. 36, n. 4, p. 807-814, 1991.
ANEEL, Agência Nacional de Energia Elétrica. Relatório de Gestão do Exercício de 2015. Brasília, DF, p.407. 2016.
35
AUFDENKAMPE, A. K. et al. Riverine coupling of biogeochemical cycles between land, oceans, and atmosphere. Frontiers in Ecology and the Environment, v. 9, n. 1, p. 53-60, 2011.
AZAM, F. Microbial control of oceanic carbon flux: the plot thickens. Science, v. 280, n. 5364, p. 694-696, 1998.
AZAM, F. et al. The Ecological Role of Water-Column Microbes in the Sea. Marine Ecology Progress Series, v. 10, n. 3, p. 257-263, 1983.
BADE, D. L. et al. Sources and fates of dissolved organic carbon in lakes as determined by whole-lake carbon isotope additions. Biogeochemistry, v. 84, n. 2, p. 115-129, 2007.
BARBOSA, F. A. R. et al. The cascading reservoir continuum concept (CRCC) and its application to the river Tietê-basin, São Paulo State, Brazil. Theoretical
Reservoir Ecology and its Applications, p. 425-437, 1999.
BARROS, N. et al. Carbon emission from hydroelectric reservoirs linked to reservoir age and latitude. Nature Geoscience, v. 4, n. 9, p. 593-596, 2011.
BERGGREN, M.; LAUDON, H.; JANSSON, M. Aging of allochthonous organic carbon regulates bacterial production in unproductive boreal lakes. Limnology
and Oceanography, v. 54, n. 4, p. 1333-1342, 2009.
BERGGREN, M. et al. Nutrient constraints on metabolism affect the temperature regulation of aquatic bacterial growth efficiency. Microbial Ecology, v. 60, n. 4, p. 894-902, 2010.
36
BERMAN, T. et al. Estimation of long-term bacterial respiration and growth efficiency in Lake Kinneret. FEMS Microbiology Ecology, v. 71, n. 3, p. 351-63, 2010. BERTILSSON, S. et al. Links between bacterial production, amino-acid utilization and
community composition in productive lakes. ISME Journal, v. 1, n. 6, p. 532-44, 2007.
BERTILSSON, S.; JONES, J. B. Supply of dissolved organic matter to aquatic ecosystems. p. 3-24, Ed.: Stuart E.G. Findlay and Robert L. Sinsabaugh. 2003. BIDDANDA, B.; OGDAHL, M.; COTNER, J. Dominance of bacterial metabolism in
oligotrophic relative to eutrophic waters. Limnology and Oceanography, v. 46, n. 3, p. 730-739, 2001.
BROWN, J. H. et al. Toward a metabolic theory of ecology. Ecology, v. 85, n. 7, p. 1771-1789, 2004.
CALLIERI, C.; STOCKNER, J. G. Freshwater autotrophic picoplankton: a review. Journal of Limnology, v. 61, n. 1, p. 1, 2002.
CAMMACK, W. L. et al. Fluorescent dissolved organic matter in lakes: relationships with heterotrophic metabolism. Limnology and Oceanography, v. 49, n. 6, p. 2034-2045, 2004.
CARLSON, C.; DEL GIORGIO, P.; HERNDL, G. Microbes and the dissipation of energy and respiration: from cells to ecosystems. Oceanography, v. 20, n. 2, p. 89-100, 2007.
CESP, Programa de gerenciamento de reservatórios: monitoramento de qualidade
37
CHRÓST, R.; KOTON, M.; SIUDA, W. Bacterial secondary production and bacterial biomass in four Mazurian lakes of differing trophic status. Polish Journal of Environmental Studies, v. 9, n. 4, p. 255-266, 2000.
CIMBLERIS, A. C.; KALFF, J. Planktonic bacterial respiration as a function of C: N: P ratios across temperate lakes. Hydrobiologia, v. 384, n. 1-3, p. 89-100, 1998. COLE, J. J. et al. Plumbing the global carbon cycle: integrating inland waters into the
terrestrial carbon budget. Ecosystems, v. 10, n. 1, p. 172-185, 2007.
COTNER, J. B.; BIDDANDA, B. A. Small players, large role: microbial influence on biogeochemical processes in pelagic aquatic ecosystems. Ecosystems, v. 5, p. 105-121, 2002.
COTNER, J. B.; HALL, E. K.; SCOTT, J. T.; HENDAL, M. Freshwater bacteria are stoichiometrically flexible with a nutrient composition similar to seston.
Frontiers in Microbiology. 2010.
DAVIS, J. A.; BOYD, C. E. Concentrations of selected elements and ash in bluegill (Lepomis macrochirus) and certain other freshwater fish. Transactions of the American Fisheries Society, v. 107, n. 6, p. 862-867, 1978.
DEL GIORGIO, P. A.; COLE, J. J. Bacterial growth efficiency in natural aquatic systems. Annual Review of Ecology and Systematics, p. 503-541, 1998.
DEL GIORGIO, P. A.; COLE, J. J.; CIMBLERIS, A. Respiration rates in bacteria exceed phytoplankton production in unproductive aquatic systems. Nature, v. 385, n. 6612, p. 148-151, 1997.
DOMINGUES, C. D. et al. Microbial food-web drivers in tropical reservoirs.
38
DOWNING, J. A. et al. The impact of accelerating land-use change on the N-Cycle of tropical aquatic ecosystems: Current conditions and projected changes. Biogeochemistry, v. 46, n. 1-3, p. 109-148, 1999.
ELSER, J. J.; HASSETT, R. P. A stoichiometric analysis of the zooplankton– phytoplankton interaction in marine and freshwater ecosystems. Nature, v. 370, n. 6486, p. 211-213, 1994.
ESTEVES, K. E.; LOBO, A. V. P.; FARIA, M. D. R. Trophic structure of a fish community along environmental gradients of a subtropical river (Paraitinga River, Upper Tietê River Basin, Brazil). Hydrobiologia, v. 598, n. 1, p. 373-387, 2007. GEORGE, N. B. Nutrient stoichiometry of piscivore-planktivore interactions in two
whole-lake experiments. 1994. (Master). The University of Texas at Arlington,
Texas.
GODWIN, C. M.; COTNER, J, B. Aquatic heterotrophic bacteria have highly flexible phosphorus content and biomas stoichiometry. ISME Journal, v. 9, p. 2324-2327.
GUILLEMETTE, F.; LEIGH MCCALLISTER, S.; DEL GIORGIO, P. A. Selective consumption and metabolic allocation of terrestrial and algal carbon determine allochthony in lake bacteria. ISME Journal, v. 10, n. 6, p. 1373-82, 2016.
GUILLEMETTE, F.; MCCALLISTER, S. L.; DEL GIORGIO, P. A. Differentiating the degradation dynamics of algal and terrestrial carbon within complex natural dissolved organic carbon in temperate lakes. Journal of Geophysical Research: Biogeosciences, v. 118, n. 3, p. 963-973, 2013.
39
HESSEN, D. O. Carbon, nitrogen and phosphorus status in Daphnia at varying food conditions. Journal of Plankton Research, v. 12, n. 6, p. 1239-1249, 1990. HESSEN, D. O.; LYCHE, A. Inter- and intraspecific variations in zooplankton element
composition. Archiv für Hydrobiologie, v. 121, n. 3, p. 343-353, 1991.
HOLLIBAUGH, J. T.; FUHRMAN, J. A.; AZAM, F. Radioactively labeling of natural assemblages of bacterioplankton for use in trophic studies1. Limnology and Oceanography, v. 25, n. 1, p. 172-181, 1980.
JANSSON, M. et al. Links between Terrestrial Primary Production and Bacterial Production and Respiration in Lakes in a Climate Gradient in Subarctic Sweden. Ecosystems, v. 11, n. 3, p. 367-376, 2008.
JUGNIA, L.-B.; SIME-NGANDO, T.; DEVAUX, J. Relationship between bacterial and primary production in a newly filled reservoir: temporal variability over 2 consecutive years. Ecological Research, v. 22, n. 2, p. 321-330, 2006.
KALFF, J. Reservoirs. In: KALFF, J. (Ed.). Limnology: inland water ecosystems. New Jersey: Prentice Hall, v.592, 2002
KIMMEL, B. L.; GROEGER, A. W. Factors controlling primary production in lakes and reservoirs: a perspective. Lake and Reservoir Management, v. 1, n. 1, p. 277-281, 1984.
KRITZBERG, E. S. et al. Does autochthonous primary production drive variability in bacterial metabolism and growth efficiency in lakes dominated by terrestrial C inputs? Aquatic Microbial Ecology, v. 38, n. 2, p. 103-111, 2005.
KYLE, M. Stoichiometry of carbon, nitrogen and phosphorus in Pseudomonas
40
LEWIS, W. M. Tropical lakes: how latitude makes a difference. Perspectives in tropical limnology, p. 43-64, 1996.
LEWIS, W. M. J. Tropical limnology. Annual Review of Ecology and Systematics, v. 18, n. 1, p. 159-184, 1987.
MORANA, C. et al. Production of dissolved organic matter by phytoplankton and its uptake by heterotrophic prokaryotes in large tropical lakes. Limnology and Oceanography, v. 59, n. 4, p. 1364-1375, 2014.
PENCZAK, T. Phosphorus, nitrogen, and carbon cycling by fish populations in two small lowland rivers in Poland. Hydrobiologia, v. 120, n. 2, p. 159-165, 1985. POMEROY, L. R. The ocean's food web, a changing paradigm. BioScience, v. 24, n. 9,
p. 499-504, 1974.
PRÉSING, M. et al. Relative nitrogen deficiency without occurrence of nitrogen fixing blue-green algae in a hypertrophic reservoir. Developments in Hydrobiology, v. 119, p. 55-61, 1997.
RAM, A. S. et al. Phage bacteriolysis, protistan bacterivory potential, and bacterial production in a freshwater reservoir: coupling with temperature. Microbial Ecology, v. 50, n. 1, p. 64-72, 2005.
RAM, A. S. et al. Viral regulation of prokaryotic carbon metabolism in a hypereutrophic freshwater reservoir ecosystem (Villerest, France). Frontiers in Microbiology, v. 7, p. 81, 2016.
41
RAM, A. S. et al. Variable viral and grazer control of prokaryotic growth efficiency in temperate freshwater lakes (French Massif Central). Microbiology Ecology, v. 66, n. 4, p. 906-16, 2013.
REDFIELD, A. C. The biological control of chemical factors in the environment. American Scientist, v. 46, n. 3, p. 205-221, 1958.
RIVKIN, R. B.; LEGENDRE, L. Biogenic carbon cycling in the upper ocean: effects of microbial respiration. Science, v. 291, n. 5512, p. 2398-400, 2001.
ROBARTS, R. D. et al. The coupling of heterotrophic bacterial and phytoplankton production in a hypertrophic, shallow prairie lake. Canadian Journal of
Fisheries and Aquatic Sciences, v. 51, n. 10, p. 2219-2226, 1994.
ROBARTS, R. D.; WICKS, R. J. Heterotrophic bacterial production and its dependence on autotrophic production in a hypertrophic African reservoir. Canadian Journal of Fisheries and Aquatic Sciences, v. 47, n. 5, p. 1027-1037, 1990.
RUDD, J. W. M. et al. Are hydroelectric reservoirs significant sources of greenhouse gases? Ambio,v. 22, n. 4, p. 246-248, 1993.
SARMENTO, H. New paradigms in tropical limnology: the importance of the microbial food web. Hydrobiologia, v. 686, n. 1, p. 1-14, 2012.
42
SCHINDLER, D. W. et al. Eutrophication of lakes cannot be controlled by reducing nitrogen input: results of a 37-year whole-ecosystem experiment. Proceedings of
the National Academy of Sciences of the USA, v. 105, n. 32, p. 11254-8, 2008.
SEGOVIA, B. T. et al. Coupling between heterotrophic nanoflagellates and bacteria in fresh waters: does latitude make a difference? Frontiers in Microbiology, v. 7, p. 114, 2016.
SIMON, M.; CHO, B. C.; AZAM, F. Significance of bacterial biomass in lakes and the ocean: comparison to phytoplankton biomass and biogeochemical implications
Marine Ecology Progress Series, v. 86, p. 103-110, 1992.
SIMON, M.; TILZER, M. M. Bacterial response to seasonal changes in primary production and phytoplankton biomass in Lake Constance. Journal of Plankton Research, v. 9, n. 3, p. 535-552, 1987.
SMITH, E. M.; PRAIRIE, Y. T. Bacterial metabolism and growth efficiency in lakes: the importance of phosphorus availability. Limnology and Oceanography, v. 49, n. 1, p. 137-147, 2004.
ST. LOUIS, V. L. et al. Reservoir surfaces as sources of greenhouse gases to the atmosphere: a global estimate. BioScience, v. 50, n. 9, p. 766, 2000.
STERNER et al. Carbon:phosphorus stoichiometry and food chain production. Ecology Letters, v. 1, n. 3, p. 146-150, 1998.
STRASKRABA, M. Ecotechnological methods for managing non-point source pollution in watersheds, lakes and reservoirs. Water Science and Technology, v. 33, n. 4-5, p. 73-80, 1996.
TRANVIK, L. J. et al. Lakes and reservoirs as regulators of carbon cycling and climate.
43
TULONEN, T. Bacterial production in a mesohumic lake estimated from [14C] leucine incorporation rate. Microbial Ecology, v. 26, n. 3, p. 201-217, 1993
TUNDISI, J. G.; MATSUMURA-TUNDISI, T. Represas artificiais. In: TUNDISI, J. G. e MATSUMURA-TUNDISI (Ed.). Limnologia. São Paulo: Oficina de textos, 2008. cap. 12, p.317-354.
VADSTEIN, O. et al. Growth and phosphorus status of limnetic phytoplankton and bacteria. Limnology and Oceanography, v. 33, n. 4, p. 489-503, 1988
VANNOTE, R. L. et al. The river continuum concept. Canadian Journal of Fisheries and Aquatic Sciences, v. 37, n. 1, p. 130-137, 1980.
VÁZQUEZ-DOMÍNGUEZ, E.; VAQUÉ, D.; GASOL, J. M. Ocean warming enhances respiration and carbon demand of coastal microbial plankton. Global Change Biology, v. 13, n. 7, p. 1327-1334, 2007.
VIDAL, L. O. et al. Hydrological pulse regulating the bacterial heterotrophic metabolism between Amazonian mainstems and floodplain lakes. Frontiers in Microbiology, v. 6, p. 1054, 2015.
WHITE, P. A. et al. The effect of temperature and algal biomass on bacterial production and specific growth rate in freshwater and marine habitats. Microbial Ecology, v. 21, n. 1, p. 99-118, 1991.
44
Capítulo II
45
Introduction
Heterotrophic bacteria play an important role in aquatic ecosystems carbon cycle producing carbon dioxide (CO2) through respiration of the organic matter. They are the
main decomposers of organic matter and incorporate DOC into biomass through secondary production (Cole et al., 1994; Del Giorgio e Cole, 1998). Moreover, this carbon becomes bioavailable for the aquatic trophic web through the microbial loop (Azam et al., 1983).
Earlier studies argued that bacteria are more effective than phytoplankton in absorbing nutrients in oligotrophic conditions due to high surface-to-volume ratio. For this reason bacteria comprise a high percentage of community metabolism in low nutrient conditions (Biddanda et al., 2001; Cotner e Biddanda, 2002). However, in more productive environments bacterial metabolic rates are comparatively lower than phytoplankton (Cole et al., 1988; Sanders et al., 1992; Simon e Rosenstock, 1992).
Several environmental factors may affect bacterial metabolism. There is a consensus that temperature is the main regulator of bacterial metabolism (e.g. White et al., 1991; Kamjunke et al., 2016). Concurrently with organic matter quality and availability, temperature regulates BP and BGE in temperate ecosystems, when the whole year cycle is considered (Apple et al., 2006). For this reason bacterioplankton in tropical regions is expected to have comparatively higher metabolic rates than in temperate regions (Lewis, 1987; Sarmento, 2012; Amado et al., 2013).
46
and macrophytes are the main carbon source in reservoirs (Fearnside, 2005). Phytoplankton is a major pool of autochtonous organic carbon that fuel bacterial metabolism (Simon et al. 1992). High light and low nutrient availability enhance phytoplankton extracellular organic carbon release, which is easily assimilated by heterotrophic bacteria (Morana et al 2014). For example, in boreal regions, external C inputs contributed to heterotrophic bacteria biomass and BR (Guillemette et al., 2016). In turn, subarctic systems BP and BGE increased due to combination of both allochthonous and algal carbon (Roiha et al., 2016). These results corroborate the “priming effect”, where algal labile components promote bacterial degradation of terrestrial recalcitrant DOC (Guenet et al., 2013; Hotchkiss et al., 2014; Guillemette et al., 2016). Also, DOC degradation patterns vary according nutrient availability and trophic state (Guillemette et al 2013). On the other hand, in environments in which respiration exceeds primary production, terrestrial carbon sources may complement bacterial metabolism (Fonte et al, 2013).
Tropical inland waters are responsible for a substantial share of CO2 emissions
47
regions, where temperature is permanently high and the seasonal dynamics is dictated by the rainfall regime, is still lacking.
Given the relevance of tropical inland waters, especially reservoirs, to global carbon emissions it is important to elucidate which environmental factors drive bacterial metabolism in low latitudes, where temperature and light throughout the year is high and the seasonal dynamics is governed by the rainfall regime. Therefore, the aim of this study was to quantify bacterial metabolism and the concomitant limnological parameters in four tropical cascading reservoirs forming a trophic state gradient during one year, in order to elucidate the drivers of bacterial metabolism seasonal variation in low latitudes. We used regression models to determine which factors drove bacterial metabolism variables (BP, BR, BGE and BCD). We hypothesize that (1) bacterial metabolic rates are high throughout the year and respond to the trophic state gradient, and (2) the environmental drivers of bacterial metabolism in tropical regions act differently from those reported in temperate systems, as seasonality indicators are different.
Materials and methods Study area and sampling
Samples were taken in four cascading reservoirs in the Tietê River: Barra Bonita (BB) (22° 32.648’ S 048° 27.97’ W), Promissão (PR) (21° 19.123’ S 049° 44.724’ W),
Nova Avanhandava (NO) (21° 06.455’ S 050° 10.954 W) and Três Irmãos (TI) (20° 40.110’ S 051° 16.855’ W), located in the Paraná River basin, in São Paulo State
48
towards the Paraná River passing through a series of cascading reservoirs. During this 700 km course the nutrient charge decreases and, consequently, water quality improves, forming a decreasing trophic state gradient (Barbosa et al., 1999).
Fig. 1. Location of the Tietê River in the Paraná River basin, with the four reservoirs studied.
Water samples were collected using Van Dorn bottle at subsurface and kept in 20 L carboys, and 500 mL to 1 L of water was filtered, in field, through a glass-fiber filter (GF/F, 47 mm diameter) for chlorophyll a (Chla) concentration, DOC and nutrient analyses.
Environmental variables
49
Euphotic zone (Zeu), corresponding to depth of 1% the incident light, was determined using an underwater photosynthetically active radiation (PAR) sensor (Li-cor Model LI-250 Light Meter). Chla was extracted in 90% ethanol at 80°C (Marker, 1980; Nush, 1980) and quantified in a spectrophotometer (Lorenzen, 1967).
For particulate organic carbon (POC) and particulate organic nitrogen (PON) in the seston, water was filtered through previously carbonized GF/F filters. Half of the filter was used on the CHN TruSpec Micro analyzer (Leco®), following instructions of manufacturer. Pretreatment consisted in maintaining filters on oven for 24h, at approximately 50° C and exposed to HCl fume for removal of inorganic carbon. The other half of the filter was used for particulate organic phosphorus (POP) analysis, by colorimetric quantification after a digestion with potassium persulfate as described in Mackereth et al. (1978).
Residence time (RT) was obtained using the following equation:
RT = V / q (1)
where V is the reservoir volume (m3) and q is tributaries inflow (m3 d-1). Hydrological and meteorological data were gently provided by the Agência Nacional de Águas (Ana, 2016) and the Instituto Nacional de Meteorologia (INMET, 2016), respectively.
Metabolic rates
50
with 40 nM (final concentration) of H3-leucina. The incubations were stopped with 5% final concentration trichloroacetic acid (TCA). A carbon:protein conversion factor of 0,86 was used (Simon e Azam, 1989).
For BR, approximately 500 mL of water was filtered through 3 µm pore size polycarbonate membrane (37 mm diameter) discarding the first 100 mL for rinsing the filter. From these, 50 mL of water was gently dispensed in four replicate previously carbonized glass flasks, and incubated in the dark, at in situ temperature. Dissolved oxygen was measured in each flask at T0 = initial time, T1 ~ 2h, T2 ~ 6h and T3 ~ 10h, using an O2 optical fiber micro-optode (Unisense©, Aarhus, Denmark) (Briand et al.,
2004). BR rates were transformed to carbon units using a respiratory coefficient of 1 (Del Giorgio e Cole, 1998).
BGE and BCD were obtained according to the following equations:
BGE = BP / (BP + BR) (2)
BCD = BP + BR (3)
Statistical analyses
52
Results
The lowest water temperatures were observed during the dry season (May 2015 and July 2015), and the highest during the rainy season (January 2016 and March 2016), as expected for this region (Fig. 3A). Retention times (RT) decreased towards the end of the study period (Fig. 3B) and varied among reservoirs (Fig. 4B).
53
Table 1: Mean, minimum and maximal values of environmental parameters and bacterial metabolism variables measured in the four reservoirs studied (BB: Barra Bonita; PR: Promissão; NO: Nova Avanhandava; TI: Três Irmãos).
BB PR NO TI
Parameters Min Mean Max Min Mean Max Min Mean Max Min Mean Max
Area (km2) 310 530 210 817
Volume (109 m3)
3.14 7.42 2.72 13.80
Beginning of operation year 1963 1975 1982 1993
Temperature (°C) 20.24 24.95 27.79 22.01 26.17 29.81 22.62 26.5 28.99 22.95 27.05 29.54 pH 6.80 7.48 8.00 7.46 8.38 9.00 7.01 8.47 9.50 7.26 8.01 9.20 Residence time (d) 31.48 99.76 179.64 35.73 143.25 283.65 13.13 48.80 104.79 63.61 357.71 1000.52 Average influx (m3 s-1) 201.98 553.64 1152.54 302.27 971.62 2399.90 300.41 1013.48 2397.22 159.64 1006.61 2511.11
Euphotic zone (m) 1.42 2.86 4.83 3.3 4.10 5.40 3.64 5.22 7.40 5.41 9.92 14.27 Secchi disk (m) 0.30 1.35 3.80 0.90 1.28 1.60 1.00 1.47 1.90 1.80 4.22 7.60 Chlorophyll a (µg L-1) 1.68 33.16 76.31 7.99 19.93 43.58 4.59 13.63 26.41 0.82 4.91 11.35
Carbohydrates (mg L-1) 1.85 3.18 4.78 1.37 1.83 2.26 1.45 2.03 2.50 0.96 1.56 1.85 Dissolved organic carbon (µgC L-1)
7.75 10.84 21.67 5.13 6.22 8.65 5.28 6.12 7.39 4.09 4.88 5.46 Particulate organic carbon (mgC L-1) 0.8 7.8 28.1 1.7 3,23 4.9 1.04 2.7 5.21 0.5 1.51 3.65
Particulate organic nitrogen (mgN L-1) 0.2 1.83 6.14 0.53 0.89 1.3 0.21 0.65 1.04 0.09 0.32 0.74 Particulate organic phosphorus (mgP L-1) 0.08 0.14 0.25 0.03 0.06 0.08 0.02 0.05 0.08 0.08 0.03 0.60
C:N atomic ratio 3.60 4.88 6.10 2.42 4.41 6.68 3.24 4.83 6.00 4.41 5.85 7.89 C:P atomic ratio 20.23 115.11 295.63 106.36 153.48 261.26 58.88 150.11 336.56 68.71 148.60 244.77 N:P atomic ratio 3.97 23.89 55.41 15.92 38.57 59.92 9.81 31.73 57.78 10.58 27.68 52.76 Dissolved inorganic nitrogen (µg L-1) 1.70 2.73 4.46 0.15 0.35 0.59 0.00 0.26 0.63 0.01 0.06 0.13
Soluble reactive phosphorus (µg L-1) 8.45 49.18 109.21 1.21 4.86 13.73 1.24 4.04 9.04 1.57 9.02 28.90
Bact. abundance (106 mL-1) 1.91 5.79 10.34 4.96 6.58 9.44 6.34 7.38 8.37 1.99 3.70 6.56
Bact. production (µgC l-1 h-1) 0.21 1.25 3.03 0.42 1.26 2.62 0.32 0.99 2.16 0.04 0.77 3.27
Bact. respiration (µgC L-1 h-1) 5.83 17.04 29.29 12.19 30.30 50.06 14.63 23.16 37.01 13.96 31.61 46.73
Bact. growth efficiency (%) 1.65 6.26 11.93 1.62 4.33 7.95 1.60 4.27 9.45 0.10 2.36 8.73 Bact. carbon demand (µgC L-1 h-1) 6.23 18.29 31.23 12.61 31.56 50.89 15.09 24.15 37.95 14.09 32.38 46.84
Bact. specific growth rate (d-1) 0.21 0.55 1.14 0.23 0.49 0.95 0.13 0.39 1.00 0.07 0.47 1.58
54
55
56
57
Fig. 5. Mean and standard deviation of the main biotic variables among reservoirs by sampling month. A: bacterial production; B: bacterial respiration; C: bacterial growth efficiency; D: bacterial carbon demand
58
Significant correlations between bacterial abundance or metabolism and environmental variables are listed in Table 2. BP were positively correlated to Chla and carbohydrates and inversely correlated to residence time. Being part of the seston, bacterial abundance was correlated to POC, PON and all sestonic elemental ratios. BP was also correlated to temperature. The only variable that correlated to BR was DOC (negative correlation).
59
The selected multiple regression models (Table 3) indicated variations in bacterial metabolism that were explained by distinct environmental variables. A model with Zeu and temperature as predictive variables explained 61% of BP variance. Both BR and BDC had DOC as the main environmental driver, accounting alone for 35% and 34% of their variation, respectively. The best predictors for BGE were Chla, nitrate and temperature, and the model explained 47% of its variance. According to the regression coefficients, temperature had relatively low or no influence on BP and BGE, respectively (Table 2 and Table 3).
60
61
Table 2. Correlation matrix and significance values between environmental parameters and bacterial metabolism variables (* <0.05; ** <0.001; *** <0.0001; log transformed data, excepting BGE; outlaier removed Barra Bonita reservoir from March 2016).
Bacterial abundance BP BR BGE SGR
Bacterial abundance - 0.70*** 0.56**
BP 0.70*** - 0.79*** 0.86***
BR -
BGE 0.56** 0.79*** - 0.70***
SGR 0.86*** 0.70*** -
Temperature 0.44*
Residence time -0.43* -0.54**
Average influx 0.44* 0.45*
Zeu -0.61** -0.46* -0.52*
Chlorophyll a 0.73*** 0.52*
Carbohydrates 0.45* 0.47* 0.46*
DOC -0.59**
C:P 0.45*
N:P 0.49*
POC 0.65***
PON 0.67*** 0.46*
Table 3. Multiple regressions coefficients (ß)and intercept (ß0) of the best models for bacterial respiration
(BR), bacterial production (BP), bacterial growth efficiency (BGE) and bacterial carbon demand (BCD).
Best model ßlogD OC ßlogZ eu ßlogC hla ßlogNitr ate ßTe
mp ß0 r² p
F
statistic AIC Log
BR logDOC -1.29 2.38 0.35 3.08 x 10⁻³ (2,21) 11.18 -6.78
Log
BP logZeu, Temp
-1.21 0.0 8 -1.54 0.6 2 4.28 x 10⁻³ 16.87 (2,21) 16.8 9
BGE logChla, logNitrate, Temp 2.04 1.92 0.55 12.3 -7
0.4 7
4.37 x
10-3 (2,21) 5.99 118.12
62
Discussion
A large number of studies related bacterial metabolism with environmental variables, however, most of them were carried out in mid-high latitudes and analyzed a restricted number of variables, or only one metabolic parameter (only BP or only BR) (Amado et al. 2013). In this study we followed bacterial metabolism during one complete year cycle, contrasting with most reports that cover a specific period of the year, usually mid latitude summer, when aquatic systems are thermally stratified (e.g. Cimbleris e Kalff, 1998; Chróst et al., 2000; Cammack et al., 2004; Smith e Prairie, 2004; Kritzberg et al., 2005).
All variables (environmental and biotic) confirmed the trophic state gradient formed by the cascading reservoirs, from the most eutrophic BB (higher Chla, lower Zeu, and higher DOC) to the oligotrophic TI (lower Chla, higher Zeu, and lower DOC) (Table 1). Despite this clear trophic state gradient, dissolved inorganic nutrients (nitrate and soluble reactive phosphorus) remained low in all reservoirs throughout the year (Table 1).
63
Adams et al., 2010). Our study period covered the most severe drought in 50 years in this region followed by a strong El Niño (Wmo, 2016) that caused extreme flooding towards the end of the study, early 2016 (Fig. 2).
BP and BGE responded primarily to variables related to the trophic state (Zeu and Chla). Moreover, both BP and BGE were lower in oligotrophic systems, supporting the hypothesis that trophic state affects strongly bacterial metabolism, as already pointed out in temperate lakes (Chróst et al., 2000). Several studies found significant relationships between BP and Chla, suggesting a high efficiency of heterotrophic bacteria in using organic compounds derived from phytoplankton (e.g. Simon e Tilzer, 1987; Robarts e Wicks, 1990; Tulonen, 1993). In our study, BP was negatively correlated to water transparency reaching maximal values in reservoirs with highest Chla (which was inversely correlated to Zeu, data not shown). Most reports available in the literature (from temperate regions) found similar results (e.g. Bergstrom e Jansson, 2000, Bertilsson et al. 2007, Adams et al. 2010, Ram et al. 2016), indicating BP is enhanced by autochthonous carbon.
On the other hand, BR was constantly high throughout the year cycle. Moreover, BR accounted for most of the BCD, indicating that carbon is predominantly allocated in catabolic metabolism. BR was particularly high in the oligotrophic reservoir (TI), where P limitation was more frequent (Fig. 7). More productive reservoirs (such as BB) had no nutrient limitation and also lower BR, certainly allocating more carbon into biomass production, channeling carbon to other heterotrophs in the food web or removing it from the system (Biddanda et al., 2001).
64
towards a frequent P limitation, especially in less productive reservoirs (Fig. 7). This nutrient limitation associated to high temperature and high light conditions (inherent to tropical regions) intensified the degree of environmental hostility (Carlson et al., 2007; Sarmento et al. 2015), and the proportion of the energy devoted to cell maintenance as well as BR increased, resulting in lower BGE.
Overall, average BGE ranged between 2.36 and 6.26% (Table 1), which fits within as expected values from temperate lakes (Del Giorgio e Cole, 1998). Our dataset indicated a strong dependency of BGE from Chla, which might suggest high incorporation rates of autochthonous carbon into bacterial biomass (Kritzberg et al., 2005) or a facilitation of allochthonous DOC uptake (Guillemette et al., 2016). In addition to resource availability (bottom-up control), other factors that may have affected BGE is top-down control (grazing by heterotrophic nanoflagellates and viral lysis) (Bergstrom e Jansson, 2000; Ram et al., 2013; Ram et al., 2015; Domingues et al., 2016), however, the influence of biotic interactions was not evaluated in our study.
65
in temperate lakes, morphometry and physical processes govern nutrients loading, and temperature is a major controller of planktonic metabolism. Because of high temperatures in tropical regions that enhance metabolic rates, phytoplankton and heterotrophic bacteria rapidly assimilate dissolved nutrients, and nutrient limiting conditions are rapidly imposed (Lewis, 1987; Sarmento, 2012; Amado et al., 2013). As a consequence, phytoplankton dissolved primary production excreted compounds accumulates at higher rates in tropical lakes (Morana et al., 2014). The fact that most studies in temperate region found carbon related variables as environmental drivers of BGE, and that in our study DOC was not a good predictor for BGE, reinforces the idea that temperate systems might be often carbon limited while in tropical systems nutrient limitation might be more frequent. This hypothesis had already been raised in a literature review but with little support from field data (Amado et al., 2013). An experimental study carried out in tropical lagoons also support this view, as BR increased in response to nutrients additions, even in lagoons with the lowest DOC concentration (Scofield et al., 2015).
66
Conclusões
67
References
ABRIL, G. et al. Amazon River carbon dioxide outgassing fuelled by wetlands. Nature, v. 505, n. 7483, p. 395-8, 2014.
ADAMS, H. E.; CRUMP, B. C.; KLING, G. W. Temperature controls on aquatic bacterial production and community dynamics in arctic lakes and streams.
Environmental Microbiology, v. 12, n. 5, p. 1319-33, 2010.
AMADO, A. M. et al. Tropical freshwater ecosystems have lower bacterial growth efficiency than temperate ones. Frontiers in Microbiology, v. 4, p. 1-8, 2013.
ANA. Agência Nacional das Águas. 2016.
APPLE, J. K.; DEL GIORGIO, P. A.; KEMP, W. M. Temperature regulation of bacterial production, respiration, and growth efficiency in a temperate salt-marsh estuary. Aquatic Microbial Ecology, v. 43, p. 243-254, 2006.
AUFDENKAMPE, A. K. et al. Riverine coupling of biogeochemical cycles between land, oceans, and atmosphere. Frontiers in Ecology and the Environment, v. 9, n. 1, p. 53-60, 2011.
AZAM, F. et al. The ecological role of water-column microbes in the sea. Marine Ecology Progress Series, v. 10, n. 3, p. 257-263, 1983.
BARBOSA, F. A. R. et al. The cascading reservoir continuum concept (CRCC) and its application to the river Tiete-basin, São Paulo state, Brazil. Theoretical
Reservoir Ecology and its Applications, 425-437, 1999.