virus
Resistance on Microbial Community Diversity and
Enzyme Activity in Rhizosphere Soil
Jirong Wu1,2,3., Mingzheng Yu1,2,3., Jianhong Xu1,2,3
, Juan Du1,2,3, Fang Ji1,2,3, Fei Dong1,2,3, Xinhai Li4*, Jianrong Shi1,2,3*
1Institute of Food Safety and Detection, Jiangsu Academy of Agricultural Sciences, Nanjing, China,2Key Lab of Food Quality and Safety of Jiangsu Province—State Key Laboratory Breeding Base, Nanjing, China,3Jiangsu Center for GMO evaluation and detection, Nanjing, China,4Institute of Crop Sciences, Chinese Academy of Agricultural Sciences, Beijing, China
Abstract
The transgenic wheat line N12-1 containing theWYMV-Nib8gene was obtained previously through particle bombardment, and it can effectively control the wheat yellow mosaic virus (WYMV) disease transmitted byPolymyxa graminisat turngreen stage. Due to insertion of an exogenous gene, the transcriptome of wheat may be altered and affect root exudates. Thus, it is important to investigate the potential environmental risk of transgenic wheat before commercial release because of potential undesirable ecological side effects. Our 2-year study at two different experimental locations was performed to analyze the impact of transgenic wheat N12-1 on bacterial and fungal community diversity in rhizosphere soil using polymerase chain reaction-denaturing gel gradient electrophoresis (PCR-DGGE) at four growth stages (seeding stage, turngreen stage, grain-filling stage, and maturing stage). We also explored the activities of urease, sucrase and dehydrogenase in rhizosphere soil. The results showed that there was little difference in bacterial and fungal community diversity in rhizosphere soil between N12-1 and its recipient Y158 by comparing Shannon’s, Simpson’s diversity index and evenness (except at one or two growth stages). Regarding enzyme activity, only one significant difference was found during the maturing stage at Xinxiang in 2011 for dehydrogenase. Significant growth stage variation was observed during 2 years at two experimental locations for both soil microbial community diversity and enzyme activity. Analysis of bands from the gel for fungal community diversity showed that the majority of fungi were uncultured. The results of this study suggested that virus-resistant transgenic wheat had no adverse impact on microbial community diversity and enzyme activity in rhizosphere soil during 2 continuous years at two different experimental locations. This study provides a theoretical basis for environmental impact monitoring of transgenic wheat when the introduced gene is derived from a virus.
Citation:Wu J, Yu M, Xu J, Du J, Ji F, et al. (2014) Impact of Transgenic Wheat withwheat yellow mosaic virusResistance on Microbial Community Diversity and Enzyme Activity in Rhizosphere Soil. PLoS ONE 9(6): e98394. doi:10.1371/journal.pone.0098394
Editor:Newton C M Gomes, University of Aveiro, Portugal
ReceivedJanuary 3, 2014;AcceptedMay 2, 2014;PublishedJune 4, 2014
Copyright:ß2014 Wu et al. This is an open-access article distributed under the terms of the Creative Commons Attribution License, which permits unrestricted use, distribution, and reproduction in any medium, provided the original author and source are credited.
Funding:This work was supported by the National Special Transgenic Project (2014ZX08011-003), Natural Science Foundation of Jiangsu Province, China (BK20130721) and Jiangsu Agriculture Science and Technology Innovation Fund [cx(11)4064]. The funders had no role in study design, data collection and analysis, decision to publish, or preparation of the manuscript.
Competing Interests:The authors have declared that no competing interests exist. * E-mail: [email protected] (XL); [email protected] (JS)
.These authors contributed equally to this work.
Introduction
Since the first successful genetically engineered (GE) plant was reported in 1983 [1], the planting area of transgenic crops has increased rapidly [2]. The global area cultivated commercially with transgenic crops has increased from 1.7 million ha in 1996 to 170.3 million ha in 2012 [3]. With the continued release and use of transgenic crops, there is a growing concern about their impact on the biota and soil microbial processes, such as nutrient cycling, and the potential risk of gene transfer from transgenic crops to indigenous soil microbes [4–5]. The microbes in rhizosphere soil play an important role in plant growth and development [6–7]. Transgenic crops planted in soil will inevitably interact with microorganisms such as bacteria, fungi, and actinomycetes [8–10]. Thus, transgenic crops may affect soil microbial population structure and quantity [11–13]. Additionally, root exudates have marked effects on soil microbial diversity and spatial distribution
[14–15]. At this time, most studies of environmental risk assessment focused on transgenic Bt crops such as transgenic cotton, rice and maize containing the Bt gene [16–18]; these studies provided basic methods for environmental risk assessment for other crops.
enzyme activity when performing environmental safety risk assessments.
The first report of transgenic plants with virus resistance, expressing the coat protein of the tobacco mosaic virus(TMV) and delaying the development of disease, appeared in 1986 [22]. The same strategy was subsequently used to create resistance to a range of other viruses [23–24]. The exogenous genes of the transgenic virus-resistant crops are generally derived from the virus itself, including genes encoding coat protein and replicase [22–24]. Sequences derived from the genomes of plant viruses have been used to generate viral resistance in transgenic crop plants, but potential safety issues have been raised due to the environmental risks of transgenic plants with virus resistance, including hetero-encapsidation, virus recombination, gene flow, synergism and effects on non-target organisms [25,26].
Wheat yellow mosaic disease, caused by the wheat yellow mosaic virus (WYMV) at turngreen stage, is a serious illness affecting wheat in the middle and lower reaches of the Yangtze River region in China [27–28]. Disease-resistant variety breeding is one of the most cost-effective ways to control this disease through conventional wheat breeding. In recent years, conven-tional wheat breeding in combination with genetic engineering techniques has been applied to address wheat yellow mosaic disease, and some disease-resistant wheat lines have been cultivated. Using the particle bombardment method, genes from WYMV encoding replicase WYMV-Nib8 were transferred to the sensitive variety Yangmai158 (Y158), and the disease-resistant transgenic wheat line named N12-1 was obtained by successive backcross with Y158 [29]. N12-1 showed stable and effective resistance to wheat yellow mosaic disease in a previous study [30].
Considering the above risks, transgenic virus-resistant wheat may affect the microbial community diversity in rhizosphere soil and change the population structure. Exogenous insertion of genes may also cause changes in the metabolic pathways of genetically modified crops and alter the composition of root exudates, resulting in changes in soil enzyme activity [31]. Thus, further studies on the impact on soil microbial community diversity and enzyme activities should be performed. In this study, environ-mental risk assessment of N12-1 was performed during 2 consecutive years of wheat cultivation under field conditions at two different experimental stations. The research involved primarily: (i) differences in soil microbial (bacterial and fungal) diversity in rhizosphere soil between N12-1 and Y158 using polymerase chain reaction–denaturing gradient gel electrophoresis (PCR-DGGE) and (ii) the activity of enzymes (urease, sucrase and dehydrogenase) in rhizosphere soil. In this report, we provide a theoretical basis for environmental transgenic wheat monitoring.
Materials and Methods Ethics statement
In our study, the research samples were rhizosphere soils in the presence of transgenic and non-transgenic wheat. This presented no ethical issue.
Plant materials and field trial
Transgenic wheat line N12-1 and its recipient Yangmai158 (Y158) provided by the Chinese Academy of Agricultural Sciences (CAAS) were applied in this study. N12-1, which contains the
WYMV-Nib8gene from wheat yellow mosaic virus, can effectively control the WYMV disease transmitted by Polymyxa graminis at turngreen stage. Y158 was one of the most popular varieties in the middle and lower reaches of the Yangtze River region in China.
However, it is sensitive to WYMV disease and the yield decreased significantly due to effects of this severe disease.
This study was performed at Luhe experimental station for transgenic crop, Jiangsu Academy of Agricultural Sciences (Luhe) and Xinxiang experimental station for transgenic crop, Henan Academy of Agricultural Sciences (Xinxiang). The physical and chemical properties of the soil are provided in Table 1. pH value, water content, available nitrogen, phosphorus potassium and organic matter content were determined by potentiometry method, alkali solution diffusion method, sodium bicarbonate method, ammonium acetate extraction method, potassium dichromate method, respectively [32]. The experiment was conducted in two successive growth seasons of wheat (October 2010-June 2011 and October 2011-June 2012) in the same field in which transgenic crops had never been planted. Each variety (line) had four blocks, each of which was 1066 m. The materials were planted in a row with a row length of 6 m and row spacing of 0.3 m. Distance between plants was 3 cm within a row. Completely random design was applied to arrange the experiment performed in the field, and the wheat was subjected to conventional field management, that was 375 kg/ha of compound fertilizer (N:P2O5:K2O = 1:0.4:1) as base fertilizer and 225 kg/ha
of urea as topdressing at seedling stage.
Soil sampling
Rhizosphere soil samples were collected in both years at Luhe and Xinxiang at four growth stages [seeding stage (SS), turngreen stage (TS), grainfilling stage (GS), maturing stage (MS)]. Rhizo-sphere soil was defined as the soil still attached to the roots after the roots were shaken by hand. For each sampling site, five wheat plants were selected to collect rhizosphere soil and each block contains five sampling site. Rhizosphere soil from the five sampling sites per block was mixed as a composite rhizosphere soil sample. The soil samples were sieved using a 20-mesh sieve and then stored at 4uC until further use, usually within one month before DNA extraction.
Soil DNA extraction
Total community DNA was extracted from 0.5 g of rhizosphere soil using an UltraClean Soil DNA Isolation Kit (MoBio Lab, USA). DNA extraction was performed according to the manufac-turer’s protocol.
PCR amplification of 16S and18S rDNA fragments for DGGE analysis
The 16S rDNA fragments of bacteria were amplified by using the primer pair GC338f (59 -CGCCGCGCGCGGCGGGCG- GGGCGGGGGCACGGGGGGACTCCTACGGGAGGCAGC-AG-39, the sequence underlined was the GC clamp) and 518r (59 -ATTACCGCGGCTGCTGG -39) as described by Bakke et al. [33]. High fidelity polymerase of KOD-Plus-Neo (Toyobo, Japan) was applied to perform PCR amplification and avoid mutations in the PCR product. Briefly, the reaction mixture consisted of 1ml of
template DNA (1–5 ng), 5ml 106PCR Buffer, 5ml of 2 mM
dNTPs, 3ml of 25 mM MgSO4, 0.5ml of 10mM forward primer,
0.5ml of 10mM reverse primer, and 1 U of DNA polymerase,
after which ddH2O was added to a final volume of 50ml. The
The 18S rDNA fragments of fungi were amplified by using the primer pair (GC-Fungi: 59 -CGCCCGCCGCGCCCCGCGCCC- GGCCCGCCGCCCCCGCCCCATTCCCCGTTACCCGTT-G-39; NS1: 59- GTAGTCATATGCTTGTCTC -39, the sequence underlined was the GC clamp) as described by Das et al. [34]. The protocol for PCR amplification was similar as above. All products were purified before electrophoresis using a Cycle Pure Kit (Omega, USA).
PCR-DGGE
DGGE analysis for 16S rDNA and 18S rDNA products was performed with the DCode System (Bio-Rad, USA). Polyacryl-amide gels were composed of a denaturing gradient of 50–65% (bacteria) and 30–38% (fungi) urea, 0.17% (vol/vol) TEMED, 0.047% (wt/vol) ammonium persulfate, 6% acrylamide-N,N_-methylenebisacrylamide (37.5:1) and 16TAE. PCR products (up to 50ml) were applied to the gel. DGGE was performed at 50 V in
16TAE at 60uC for 12 h (bacteria) and at 50 V in 16TAE at 60uC for 20 h (fungi), respectively. A silver staining method was used for the detection of DNA in DGGE gels.
Migration and intensity of DGGE bands were analyzed using Quantity One according to the manual. The bands that shared identical migration positions were considered to be the same species. Shannon’s diversity index (H) of bacterial and fungal DGGE profiles was calculated with the following formula [35]:
H~{X
S
i~1
ni
Nln ni
N
Simpson’s diversity index (D) was calculated with the following formula:
D
~
X
S
i~1
ni
N h i2
Evenness (E) was calculated with the following formula:
E~ H lnS Table 1.Main physical and chemical properties of the soil from two experiment locations before planting.
Experiment station Physical and chemical properties
pH water (%)
available nitrogen (mg/kg)
available phosphorus (mg/kg)
available potassium
(mg/kg) organic matter (%)
Luhe 5.8 20.55 110.16 90.81 857.99 1.44
Xinxiang 8.5 4.92 70.39 28.26 863.69 0.68
doi:10.1371/journal.pone.0098394.t001
Figure 1. DGGE profiles of 16S rDNA and 18S rDNA fragments amplified from DNA extracted from rhizosphere soil of N12-1 and Y 158 at turngreen stage from Luhe experiment station in 2011.A: bacteria; B: fungus.
doi:10.1371/journal.pone.0098394.g001
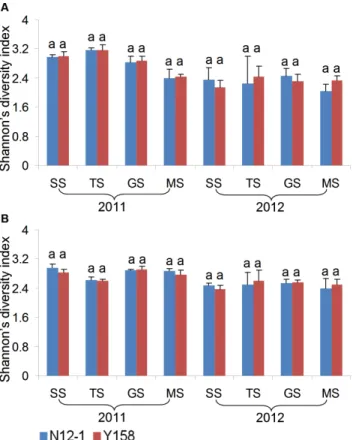
Figure 2. Shannon’s index of bacterial communities at different growth stages.Error bars indicate standard errors (n = 4). Different letters above bars denote a statistically significant difference between the means of the fields. A: Luhe; B: Xinxiang. SS: seeding stage; TS: turngreen stage; GS: grainfilling stage; MS: maturing stage.
nirepresented the square of individual peaks detected by Quantity One; Nrepresented the square of all peaks in the same lane; S
represented the number of bands in the same lane.
Band sequencing
Visible bands in the fungi DGGE gel were picked with sterile tips and transferred into a 200ml tube. Sterile ddH2O (50ml) was
added to the tube and the gel was pounded to pieces. The tubes with broken gels were incubated at room temperature overnight and then centrifuged at 12000 rpm for 5 min. The supernatant solution was used as the template for PCR, which was performed as described above or for fungi using primers without GC-clamps. The PCR products were purified (Omega, USA), ligated into pM19-T vector (Takara, Japan) and transformed into competent cells (E coliDH5a, Takara, Japan) according to the instructions of the manufactures and plated on LB solid medium with ampicillin. Positive clones were selected by PCR with primer pair of NS1 and Fungi (GC-Fungi without GC-clamps) and plasmids were extract-ed for sequencing (Invitrogen, Shanghai). All the sequences that have been sequenced successfully were submitted to GenBank (Accession numbers: KJ755390-KJ755404).
Enzyme activity analysis
Activities of urease, sucrose and dehydrogenase were analyzed in this study. Urease and sucrose activities in soil were assayed using the method of Guan [36]: urease activity was determined by measuring the release of NH3as mg.(g.d)21, and sucrose activity
was determined based on 3,5-dinitrosalicylic acid colorimetry as mg.(g.d)21. Dehydrogenase activity was determined based on the reduction of triphenyltetrazolium chloride (TTC) to triphenylfor-mazan (TPF), as described by Serra-Wittling et al. [37] with minor modifications, which was expressed asmg.(g.d)21. The data were
subjected to analysis of variance, and the means and standard deviations of four replicates were calculated.
Figure 3. Shannon’s index of fungi communities at different growth stages.Error bars indicate standard errors (n = 4). Different letters above bars denote a statistically significant difference between the means of the fields. A: Luhe; B: Xinxiang. SS: seeding stage; TS: turngreen stage; GS: grainfilling stage; MS: maturing stage.
doi:10.1371/journal.pone.0098394.g003
Table 2.Simpson’s index and Evenness of bacterial community.
Experiment station Growth stage Variety(line) Simpson’s index Evenness
2011 2012 2011 2012
Luhe SS N12-1 0.0460.00a 0.1060.00a 0.9560.01a 0.8860.01a
Y158 0.0460.00a 0.1260.00b 0.9560.01a 0.8660.02a TS N12-1 0.0360.00a 0.0960.01a 0.8460.01a 0.9260.03a Y158 0.0360.00a 0.0860.02a 0.9560.01a 0.9360.01a GS N12-1 0.0360.00a 0.0460.01a 0.9560.00a 0.9360.01a Y158 0.0360.00b 0.0560.01a 0.9660.01a 0.9360.02a MS N12-1 0.0460.00a 0.0660.02a 0.9960.10a 0.9360.03a Y158 0.0460.00a 0.0760.00a 0.9560.01a 0.9060.02a Xinxiang SS N12-1 0.0560.01a 0.0660.01a 0.9360.03a 0.9860.01a Y158 0.0560.01a 0.0660.01a 0.9560.01a 1.0060.01a TS N12-1 0.0460.01a 0.0760.01a 0.9360.02a 0.9360.02a Y158 0.0460.00a 0.0760.01a 0.9360.00a 0.9460.02a GS N12-1 0.0360.00a 0.1160.02a 0.9560.01a 0.9260.03a Y158 0.0360.00a 0.0860.01b 0.9560.01a 0.9660.01a MS N12-1 0.0460.01a 0.0760.00a 0.9360.02a 0.9060.01a Y158 0.0360.00a 0.0760.01a 0.9660.01b 0.8960.02a
Table 3.Simpson’s index and Evenness of fungi community.
Experiment station Growth stage variety(line) Simpson’s index Evenness
2011 2012 2011 2012
Luhe SS N12-1 0.0660.01a 0.1160.03a 0.9260.02a 0.9460.02a
Y158 0.0660.01a 0.1460.02a 0.9460.01a 0.9160.03a TS N12-1 0.0560.00a 0.0460.06a 0.9260.00a 0.7860.23a Y158 0.0560.01a 0.1160.05a 0.9160.01a 0.9760.08a GS N12-1 0.0760.01a 0.1060.02a 0.9360.01a 0.9560.02a Y158 0.0760.01a 0.1160.03a 0.9360.01a 0.9360.02a MS N12-1 0.1260.02a 0.1660.03a 0.8860.03a 0.8660.04a Y158 0.1160.01a 0.1260.02b 0.8960.04a 0.9260.04a Xinxiang SS N12-1 0.0660.01a 0.1060.01a 0.9360.03a 0.8760.02a Y158 0.0760.00b 0.1060.01a 0.9360.01a 0.8660.03a TS N12-1 0.0860.01a 0.0960.03a 0.9560.01a 0.9760.02a Y158 0.0860.00a 0.0860.02a 0.9560.01a 0.9760.00a GS N12-1 0.0760.00a 0.0860.01a 0.9460.02a 0.9660.01a Y158 0.0760.01a 0.0860.01a 0.9360.01a 0.9660.01a MS N12-1 0.0760.01a 0.1260.04a 0.8960.03a 0.8860.04a Y158 0.0760.01a 0.1060.02a 0.9160.02a 0.8960.03a
SS: seeding stage; TS: turngreen stage; GS: grainfilling stage; MS: maturing stage. The alphabets after the value represented the significance level of the index. doi:10.1371/journal.pone.0098394.t003
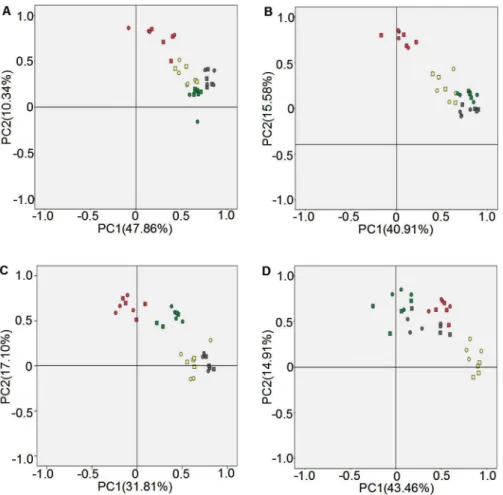
Figure 4. Principal component analysis of bacterial community diversities in rhizosphere soil.A: Luhe in 2011; B: Luhe in 2012; C: Xinxiang in 2011; D: Xinxiang in 2012. Square: N12-1; Round: Y158. Gray: seeding stage; Green: turngreen stage; Red: grainfilling stage; Yellow: maturing stage. Band position and presence (presence/absence) were used to carry out PCA analyses.
Statistical analysis
SPSS 16.0 was applied to determine whether the indices and enzyme activities differed between years, varieties and growth stages by ANOVA. PCA analyses were carried out based on band position and presence (presence/absence), and then the correlation matrix principal component analysis was performed by SPSS 16.0 [35]. Microsoft Excel 2003 was used to construct column diagrams.
Results
Impact of transgenic wheat on bacterial and fungal community diversity
One of the DGGE profiles of 16S rDNA and 18S rDNA fragments amplified from DNA extracted from rhizosphere soil was presented as figure 1. Three diversity indices (Shannon’s, Simpson’s, evenness) were used to analyze the bacterial and fungal DGGE profiles of the soil samples from Luhe and Xinxiang at four different growth stages in 2011 and 2012. For bacteria, the effect of wheat line on DGGE diversity indices was insignificant, except GS stage in 2011, SS in 2012 at Luhe and GS stage in 2012 at Xinxiang for Shannon’s diversity index (Fig. 2). The Simpson’s diversity index showed the same results as Shannon’s diversity index (Table 2). For evenness, only one difference was found at the MS stage at Xinxiang in 2011 (Table 2). For fungi, the effect of wheat line on DGGE diversity indices was insignificant, except for
SS in 2011 at Xinxiang and MS in 2012 at Luhe for Simpson’s index (Fig. 3; Table 3).
Principal component analysis of bacterial community diversity
Principal components analysis (PCA) using both band position and presence/absence as parameters were performed to further analyze DGGE fingerprint profiles. For experiments conducted at Luhe, the contribution rates of the two principal components were 47.86% and 10.34% in 2011 (Fig. 4A) and 40.91% and 15.58% in 2012 (Fig. 4B), respectively. Different growth stages showed a distinct separation along the principal components axes, whereas different replications of experimental materials formed a cluster at the same growth stage. This was consistent with the result of Shannon’s diversity analysis. In 2011, the first principal compo-nent axis clearly separated the GS and SS stage (Fig. 4A), but separated the GS and MS stage in 2012 (Fig. 4B). The second principal component axis clearly distinguished the GS stage in 2011 (Fig. 4A) and the GS stage in 2012 (Fig. 4B).
For experiments conducted at Xinxiang, the contribution rates of the two principal components were 31.81% and 17.10% in 2011 (Fig. 4C) and 43.46% and 14.91% in 2012 (Fig. 4D), respectively. Different growth stages also showed a distinct separation along the principal components axes, whereas different replications of experimental materials clustered together at the same growth stage. In 2011, the first principal component axis
Figure 5. Principal component analysis of fungi communities diversity in rhizosphere soil.A: Luhe in 2011; B: Luhe in 2012; C: Xinxiang in 2011; D: Xinxiang in 2012. Square: N12-1; Round: Y158. Gray: seeding stage; Green: turngreen stage; Red: grainfilling stage; Yellow: maturing stage. Band position and presence (presence/absence) were used to carry out PCA analyses.
clearly separated the four growth stages (Fig. 4C), but separated the MS stage from the other three stages in 2012 (Fig. 4D). The second principal component axis clearly distinguished the TS and GS stages from the SS and MS stages in 2011 (Fig. 4C), and distinguished the MS stage in 2012 (Fig. 4D).
These PCA analysis results showed that growth stage played an important role in bacterial community diversity, rather than the presence of transgenic and non-transgenic wheat.
Principal component analysis of fungal community diversity
For experiments at Luhe, the contribution rates of the two principal components were 36.93% and 19.45% in 2011 (Fig. 5A) and 27.22% and 16.31% in 2012 (Fig. 5B), respectively. Different sampling times showed a distinct separation along the principal components axes, whereas different replications of experiment materials formed a cluster at the same sampling time. In 2011, the first principal component axis clearly separated the four growth stages (Fig. 5A), but separated SS and TS from GS and MS in 2012 (Fig. 5B). The second principal component axis clearly distinguished the TS stage in 2011 (Fig. 5A), and the SS and TS stage in 2012 (Fig. 5B).
For experiments at Xinxiang, the contribution rates of the two principal components were 30.78% and 19.17% in 2011 (Fig. 5C) and 39.95% and 17.10% in 2012 (Fig. 5D). Different sampling times also showed a distinct separation along the principal components axes, whereas different replications of experimental materials formed a cluster at the same sampling time. In 2011, the first principal component axis clearly separated the SS and TS stages (Fig. 5C), but separated the SS and MS stages in 2012 (Fig. 5D). The second principal component axis could not clearly Figure 6. PCR-DGGE gel profile of fungi communities used for
band sequencing. The numbers means different bands picked for sequencing.
doi:10.1371/journal.pone.0098394.g006
Table 4.Blast results of the bands from the DGGE gels of fungl community analysis.
No. of bands Accession No. Blast result identity
1 GU214699.1 Septoria dysentericaestrain CPC 12328 18S ribosomal RNA gene 100% 2 GQ330624.1 UnculturedMucoralesclone PR3 4E 28 18S ribosomal RNA gene 95%
3 Cannot be amplified
4 AJ515922.1 Uncultured soil ascomycete partial 18S rDNA gene 100%
5 EU120944.1 UnculturedCystofilobasidiales(aff. Guehomyces) clone Y9 18S ribosomal RNA gene 100%
6 AJ515941.1 Uncultured soil ascomycete partial 18S rDNA gene 99%
7 Cannot be amplified
8 AY789390.1 Peziza variastrain ZW-Geo94-Clark 18S small subunit ribosomal RNA gene 99% 9 FJ176814.1 Saccobolus dilutellusisolate AFTOL-ID 1299 18S small subunit ribosomal RNA gene 97% 10 FO181499.1 Balen uncultured eukaryote partial 18S ribosomal RNA 80% 11 AY771600.1 Polyozellus multiplex isolate AFTOL-ID 677 18S small subunit ribosomal RNA gene 99% 12 GU190186.1 Cochliobolussp. Enrichment culture clone NJ-F5 18S small subunit ribosomal RNA gene 100%
13 Cannot be amplified
14 AJ515948.1 Uncultured soil ascomycete partial 18S rDNA gene 99%
15 Cannot be amplified
16 AJ301992.1 Myrothecium leucotrichym18S RNA gene 99%
17 JX159444.1 UnculturedFilobasidiumclone Cegs 957 18S ribosomal RNA gene 99% 18 KC171701.1 Uncultured fungus isolate DGGE gel band f10 18S ribosomal RNA gene 100%
19 Cannot be amplified
20 Cannot be amplified
21 EU120947.1 UnculturedAscobolusclone Y12 18S ribosomal RNA gene 99%
distinguish any growth stage in 2011 (Fig. 5C), but could distinguish the MS and GS stages from the SS and TS stages in 2012 (Fig. 5D).
These PCA analysis results showed that fungal communities exhibited marked diversity at different growth stages, rather than between the transgenic line and non-transgenic wheat recipient.
Band sequencing
A total of 21 visible bands from the DGGE gel of fungi from Luhe in 2011 were subjected to sequencing (Fig. 6), and 15 were sequenced successfully. Using NCBI BLAST, we found that most of the sequenced bands represented uncultured fungi. Others were partial 18S rRNA sequences of Septoria dysentericae, Peziza varia,
Saccobolus dilutellus, Polyozellus, Cochliobolus, and Myrothecium leuco-trichym(Table 4).
Enzyme activity analysis
Urease, sucrase, and dehydrogenase activities in rhizosphere soil were applied as indicators for environmental risk assessment of transgenic wheat N12-1 in this study.
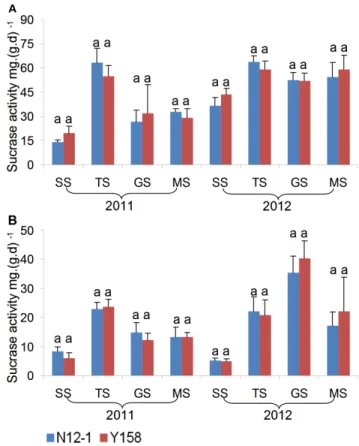
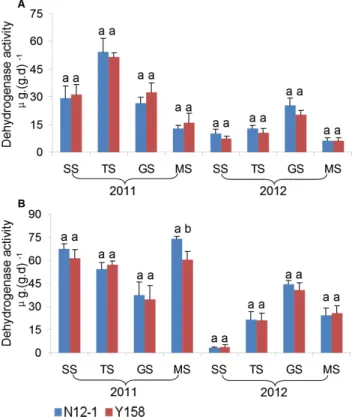
In general, there was no consistent significant difference in the enzyme activity between soils of transgenic wheat N12-1 and its recipient Y158 within the same growth stage during the 2 years. Only one significant difference in activity was observed; for dehydrogenase at the MS stage at Xinxiang in 2011. In 2011, the dehydrogenase activity in soil of N12-1 was significantly (p,0.05) higher than in soil of its recipient Y158 (Figs. 7–9). Significant differences were observed between years (p,0.01) and among
growth stages (p,0.001) at both Luhe and Xinxiang, with the exception of dehydrogenase among growth stages at Xinxiang (p, 0.25) (Table 5). These results showed that N12-1 had a minor impact on soil enzyme activities.
Discussion
With the cultivation of more varieties of virus-resistant transgenic plants and large-scale planting, environmental impact monitoring after commercial release has attracted increasing attention from the scientific community and public [38,39]. In soil, there are high microbial population densities and large numbers of microbial species that interact with the plants and surrounding environment and have an effect on the function of the soil ecosystem, such as the enzyme activity and physicochemical properties.
Soil microbial analysis has been used widely to evaluate the impact of various exogenous chemical or environmental pollutants (such as herbicides, fertilizers, heavy metals, et al.) on soil fertility and crop yields [7]. Therefore, monitoring changes in soil microbial populations will increase our understanding of the potential risks of introduction of exogenous genes to soil [4,7]. In our study, two years and two locations of field research was performed to compare the impact of transgenic wheat with genes encoding replicase from WYMV on microbial population diversity in agricultural systems. One of the major outcomes was that transgenic insertion did not significantly alter bacterial or fungal population diversity at each growth stage; however, growth stage and planting year had important effects on microbial diversity. Figure 7. Urease activity in rhizosphere soil at different growth
stages. Error bars indicate standard errors (n = 4). Different letters above bars denote a statistically significant difference between the means of the fields. A: Luhe; B: Xinxiang. SS: seeding stage; TS: turngreen stage; GS: grainfilling stage; MS: maturing stage.
doi:10.1371/journal.pone.0098394.g007
Figure 8. Sucrase activity in rhizosphere soil at different growth stages.Error bars indicate standard errors (n = 4). Different letters above bars denote a statistically significant difference between the means of the fields. A: Luhe; B: Xinxiang. SS: seeding stage; TS: turngreen stage; GS: grainfilling stage; MS: maturing stage.
This result was similar to the findings of Meyer et al. [40]. In that study, the authors found that the effects of GM wheat on plant-beneficial root-colonizing microorganisms are minor and not of ecological importance. Lupwayi et al. reported that glyphosate-resistant wheat–canola rotations under low-disturbance direct seeding and conventional tillage did not affect the functional diversity of rhizosphere soil bacteria in 18 of 20 site-years [20]. The observation that certain growth stages (mainly SS and GS) showed differences between transgenic and non-transgenic wheat may be due to inconsistencies in the soil at seeding time, and at later growth stages the temperature and humidity increased rapidly. The differences between years and growth stages indicated that the diversity of bacteria and fungi might be affected by various environmental factors, such as temperature, humidity, and light. In studies of GM crops against virus, there was no significant difference between microbial communities with transgenic or non-transgenic watermelon resistant or cucumber green mottle mosaic virus (CGMMV), but significant changes in the microbial community were observed during the growing season [41]. Transgenic tomato resistant to cucumber mosaic virus (CMV) had no effect on the variation of soil microbial communities, in which soil position and environmental factors played more dominant roles [42]. Also, non-environmental factor, such as root exudates, may also play an important role for diversity changes of bacteria and fungi between years and growth stages [14–15]. Fang et al. thought that bacterial communities differed due to changes in root exudates quantity and composition by developing corn plant, which select different bacterial groups during root colonization [43]; Donegan et al. have speculated that the reason for the different in the communities of genetically modified plants is due to differences in the root exudates patterns of these plants [44]. However, Wei et al. reported the opposite result [45]. In a transgenic alfalfa study performed using the cultivation-dependent plating method, statistically significant differences in densities of rhizospheric bacteria between transgenic and non-transgenic
Table 5.Generalized Linear Mixed Model results for overall effects on enzyme activity.
Location Enzyme Effect F Value pValue
Luhe Urease Years 282.21 0.00
Growth stage 36.89 0.00
Variety (Line) 0.01 0.91
Sucrase Years 74.66 0.00
Growth stage 33.54 0.00
Variety (Line) 0.05 0.83
Dehydrogenase Years 82.20 0.00
Growth stage 16.23 0.00
Variety (Line) 0.03 0.87
Xinxiang Urease Years 6.38 0.01
Growth stage 7.97 0.00
Variety (Line) 0.103 0.75
Sucrase Years 11.45 0.00
Growth stage 23.67 0.00
Variety (Line) 0.10 0.75
Dehydrogenase Years 73.88 0.00
Growth stage 1.40 0.25
Variety (Line) 0.11 0.74
doi:10.1371/journal.pone.0098394.t005
alfalfa clones were observed for ammonifying bacteria, cellulolytic bacteria, rhizobial bacteria, denitrifying bacteria and Azotobacter
spp. [46]. These results indicated that transgenic crops containing a viral gene conferring resistance to viral disease had little effect on soil microbial diversity (excluding a small number of studies) compared with non-transgenic crops. Transgenic wheat also had no adverse effects on soil biological indicators, such as Folsomia candida[47] and earthworm [48]. Duc et al. found that GM wheat with race-specific antifungal resistance against powdery mildew (Pm3b), and two with nonspecific antifungal resistance, had no impact on the soil fauna community (mites, springtails, annelids, and diptera). However, sampling date and location significantly influenced the soil fauna community and decomposition processes [49].
Soil enzymes in the soil nutrient cycle and energy transfer play an important role in soil ecology, and are derived mainly from soil microbial populations. Many studies have used soil enzymes as indicators of soil microbial activity and fertility [50–52]. In our study, urease, sucrase and dehydrogenase were used as indicators of the impact of transgenic wheat on soil quality. The results showed no significant difference in enzyme activity in rhizosphere soil between transgenic and non-transgenic wheat at each growth stage at two locations in 2 years, excluding dehydrogenase during the maturing stage at Xinxiang in 2011. In other studies of transgenic crops, there was no consistent significant difference in soil enzymes between transgenic and non-transgenic plants, but there were differences among seasons and crop varieties [53–54]. These results are consistent with our study. In other studies, some enzymes showed significant differences between transgenic and non-transgenic plants [11,20–21]. There have been no previous studies of soil enzyme activities of transgenic wheat. Thus, our results should be confirmed in future studies and at more experimental locations. Additionally, other types of transgenic wheat, such as insect-resistant and stress-tolerant varieties, should be used to perform risk assessments.
Due to the complexity of DGGE profiles, several bands can be difficult to identify visually, and different bands represent different microbes. These issues make it difficult to compare varieties. Thus, the combination of DGGE and cloning sequencing methods is often used to investigate the impact of transgenic plants on microorganisms in rhizosphere soil [55,56]. In our study, most of the bands from fungi DGGE gels represented uncultured fungal taxa. This is in agreement with the fact that only,1% of microbes
in soil can be artificially cultured and identified [57].
With the development of sequencing technology, the way we study microbial communities has been changed. Traditionally, the
study of genes from natural environments included cloning DNA into a vector, inserting that vector into a host, screening, and Sanger sequencing. Sequence-by-synthesis methods provide faster, cheaper, and simpler methods for (meta)genome sequence that bypass the PCR amplification bias, cloning bias and labor-intensive Sanger method [58]. Currently, massively parallel high-throughput pyrosequencing methods can process hundreds of thousands of sequences simultaneously [59]. Fierer et al. used metagenomic and small subunit rRNA analyses to study the genetic diversity of bacteria, archaea, fungi, and viruses in soil [60]; Uroz et al. used functional assays and metagenomic analyses to reveal difference between the microbial communities [61]. Li et al. analyzed the impact on bacterial community in midguts of the asian corn borer larvae by transgenic Trichoderma strain overexpressing a heterologous chit42 gene with chitin-binding domain by using 16s rRNA library. All above studies have used the next generation sequencing technology [62]. Now, this technology is being adopted to study the microbial community in rhizosphere soil of transgenic plants gradually [62].
In conclusion, our study has produced weak evidence for the effect of virus-resistant transgenic wheat on soil microbial community diversity and enzyme activities. The community structure was markedly affected by natural variations in the environment related to wheat growth stage and planting year. Little difference was observed in bacterial and fungal communities in the presence of the wild-type Y158 or the transgenic line N12-1. This requires further investigation using extended field observa-tions involving more varieties for more years. Based on this information, we can determine whether the altered composition is attributable to the presence of transgenic crops, or is simply part of the variation driven by the presence of different genotypes [63]. These studies should also involve more soil types and longer-term monitoring to account for the variability of the natural environ-ment.
Acknowledgments
We thank everyone that helped with the fieldwork and Dr. YZ from CAAS for providing seeds of transgenic and non-transgenic wheat.
Author Contributions
Conceived and designed the experiments: JW MY JX XL JS. Performed the experiments: JW MY JX JD FJ FD. Analyzed the data: JW MY. Wrote the paper: JW MY JS.
References
1. Horsch RB, Fraley RT, Rogers SG, Sanders PR, Lloyd A, et al. (1984) Inheritance of functional foreign genes in plants. Science 223: 496–498 2. Vauramo S, Pasonen HL, Pappinen A, Seta¨la¨ H (2006) Decomposition of leaf
litter form chitinase transgenic birch (Betula pendula) and effects on decomposer populations in a field trial. Appl Soil Ecol 32: 338–349.
3. James C (2013) Global Status of Commercialized Biotech/GM Crops: 2012. ISAAA Brief No. 44. ISAAA, Ithaca, New York.
4. McGregor AN, Turner MA (2000) Soil effects of transgenic agriculture: biological processes and ecological consequences. NZ Soil News 48(6):166–169 5. Sengeløv G, Kristensen KJ, Sørensen AH, Kroer N, Sørensen SJ (2001) Effect of genomic location on horizontal transfer of a recombinant gene cassette between Pseudomonas strains in the rhizosphere and spermosphere of barley seedlings. Cur Microbiol 42:160–167
6. Gyaneshwar P, Naresh Kumar G, Parekh LJ, Poole PS (2002) Role of soil microorganisms in improving P nutrition of plants. Plant Soil 245: 83–93 7. Kent AD, Triplett EW (2002) Microbial communities and their interactions in
soil and rhizosphere ecosystems. Annu Rev Microbiol 56:211–236
8. O’Callaghan M, Glare TR. (2001) Impacts of transgenic plants and microorganisms on soil biota. New Zeal Plant Prot 54: 105–110.
9. Andow DA, Zwahlen C (2006) Assessing environmental risks of transgenic plants. Ecology Letters 9:196–214
10. Liu B, Zeng Q, Yan F, Xu H, Xu C (2005) Effects of transgenic plants on soil microorganisms. Plant Soil 271:1–13
11. Chen ZH, Chen LJ, Zhang YL, Wu ZJ (2011) Microbial properties, enzyme activities and the persistence of exogenous proteins in soil under consecutive cultivation of transgenic cottons (Gossypium hirsutumL.). Plant Soil Environ, 57: 67–74
12. Blackwood CB, Buyer JS (2004) Soil microbial communities associated with Bt and non-Bt corn in three soils. J Environ Qual 33:832–836
13. Donegan KK, Palm CJ, Fieland VJ, Porteous LA, Ganio LM, et al. (1995) Changes in levels, species and DNA fingerprints of soil microorganisms associated with cotton expressing theBacillus thuringiensisvar.kurstaki endotoxin. Appl Soil Ecol 2:111–124
14. Bais HP, Weir TL, Perry LG, Gilroy S, Vivanco JM (2006) The role of root exudates in rhizosphere interactions with plants and other organisms. Annu Rev Plant Biol 57:233–266
16. Raybould A, Higgins LS, Horak MJ, Layton RJ, Storer NP, et al. (2012) Assessing the ecological risks from the persistence and spread of feral populations of insect-resistant transgenic maize. Transgenic Res 21:655–664
17. Devarc MH, Jones CM, Thies JE (2004) Effect of Cry3Bb transgenic corn and tefluthrin on the soil microbial community: biomass, activity, and diversity. J Environ Qual 33: 837–843
18. Lu H, Wu W, Chen Y, Zhang X, Devare M, et al. (2010) Decomposition ofBt
transgenic rice residues and response of soil microbial community in rapeseed– rice cropping system. Plant Soil 336: 279–290
19. Burns RG (1982) Enzyme activity in soil: Location and a possible role in microbial ecology. Soil Biol Biochem 14: 423–427
20. Lupwayi NZ, Hanson KG, Harker KN, Clayton GW, Blackshaw RE, et al. (2007) Soil microbial biomass, functional diversity and enzyme activity in glyphosate-resistant wheat–canola rotations under low-disturbance direct seeding and conventional tillage. Soil Biol Biochem 39: 1418–1427
21. Sun CX, Chen LJ, Wu ZJ, Zhou LK, Shimizu H (2007) Soil persistence of
Bacillus thuringiensis(Bt) toxin from transgenic Bt cotton tissues and its effect on soil enzyme activities. Biol Fertil Soils 43: 617–620
22. Abel PP, Nelson RS, De B, Hoffman N, Rogers SG, et al. (1986) Delay of disease development in transgenic plants that express the tobacco mosaic virus coat protein. Science 232, 738–43.
23. Beachy RN, Loesch-Fries S, Tumer NE (1990) Coat-protein mediated resistance against virus infection. Annu Rev Phytopathol 28, 451–474.
24. Fuchs M, Gonsalves D (2007) Safety of virus-resistant transgenic plants two decades after their introduction: lessons from realistic field risk assessment studies. Annu Rev Phytopathol 45: 173–202
25. Tepfer M (2002) Risk assessment of virus-resistant transgenic plants. Annu Rev Phytopathol 40: 467–491
26. Robinson DJ (1996) Environmental risk assessment of release of transgenic plants containing virus-derived inserts. Transgenic Res 5: 359–362
27. Chen J (1993) Occurrence of fungally transmitted wheat mosaic viruses in China. Ann Appl Biol 123: 55–61
28. Han C, Li D, Xing Y, Zhu K, Tian Z, et al. (2000)Wheat yellow mosaic viruswidely occurring in wheat (Triticum aestivum) in China. Plant Dis 84: 627–630 29. Xu H, Pang J, Ye X, Du L, Li L, et al. (2001) Study on the gene transferring of
Nib8 into wheat for It’s resistance to the yellow mosaic virus by bombardment. Acta Agronomica Sinica 27: 688–693 (in Chinese with English abstract) 30. Wu H, Zhang B, Gao D, Xu H, Cheng S (2006) Disease resistance test of
transgenic wheat lines withWYMV-Nib8gene and their application in breeding. J Triticeae Crops 26: 11–14 (in Chinese with English abstract)
31. Conner AJ, Glare TR, Nap J (2003) The release of genetically modified crops into the environment. Part II. Overview of ecological risk assessment. The Plant J 33: 19–46
32. Lu RK (1999) Methods of Soil Agrochemical analysis. Beijing: China Agricultural Science and Technology Press
33. Bakke I, Schryver PD, Boon N, Vadstein O (2011) PCR-based community structure studies of bacteria associated with eukaryotic organisms: a simple PCR strategy to avoid co-amplification of eukaryotic DNA. J Microbiol Meth 84: 349–351
34. Das M, Royer TV, Leff LG (2007) Diversity of fungi, bacteria, and actinomycetes on Leaves decomposing in a stream. Appl Environ Microbiol 73: 756–767
35. Liu W, Lu HH, Wu W, Wei QK, Chen YX, et al. (2008) Transgenic Bt rice does not affect enzyme activities and microbial composition in the rhizosphere during crop development. Soil Biol Biochem 40: 475–486
36. Guan SY (1986) Soil Enzyme and Its Research Methods. Beijing: China Agricultural Press, 62–142
37. Serra-Wittling C, Houot S, Barriuso E (1995) Soil enzymatic response to addition of municipal solid-waste compost. Biol Fert Soils 20: 226–236 38. Graef F, Zu¨ghart W, Hommel B, Heinrich U, Stachow U, et al. (2005)
Methodological scheme for designing the monitoring of genetically modified crops at the regional scale. Environ Monit Assess 111: 1–26
39. Zu¨ghart W, Benzler A, Berhorn F, Sukopp U, Graef F (2008) Determining indicators, methods and sites for monitoring potential adverse effects of genetically modified plants to the environment: the legal and conceptional framework for implementation. Euphytica 164: 845–852.
40. Meyer JB, Song-Wilson Y, Foetzki A, Luginbu¨hl C, Winzeler M, et al. (2013) Does wheat genetically modified for disease resistance affect root-colonizing pseudomonads and arbuscular mycorrhizal fungi? PLoS ONE, 8(1): e53825. doi:10.1371/journal.pone.0053825
41. Yi H, Kin H, Kim C, Harn CH, Kim HM, et al. (2009) Using T-RFLP to assess the impact on soil microbial communities by transgenic lines of watermelon rootstock resistant to cucumber green mottle mosaic virus (CGMMV). J Plant Biol 52: 577–584
42. Lin C, Pan T (2010) PCR-denaturing gradient gel electrophoresis analysis to assess the effects of a genetically modified cucumber mosaic virus-resistant tomato plant on soil microbial communities. Applied Environ Microbiol 76: 3370–3373
43. Fang M, Kremer RJ, Motavalli PP, Davis G (2005) Bacterial diversity in rhizospheres of nontransgenic and transgenic corn. Appl Environ Microb 71:4132–4136
44. Donegan KK, Seidler RJ, Doyle JD, Porteous LA, Digiovanni G, et al. (1999) A field study with genetically engineered alfalfa inoculated with recombinant
Sinorhizobium meliloti: effects on the soil ecosystem. J Appl Ecol 36:920–936 45. Wei XD, Zou HL, Chu LM, Liao B, Ye CM, et al. (2006) Field released
transgenic papaya affects microbial communities and enzyme activities in soil. Plant Soil 285:347–358
46. Faragova N, Gottwaldova K, Farago J (2011) Effect of transgenic alfalfa plants with introduced gene for alfalfa mosaic virus coat protein on rhizosphere microbial community composition and physiological profile. Biologia 66: 768– 777
47. Romeis J, Battini M, Bigler F (2003) Transgenic wheat with enhanced fungal resistance causes no effects on Folsomia candida (Collembola: Isotomidae). Pedobiologia 47: 141–147
48. Lindfield A, Nentwig W (2012) Genetically engineered antifungal wheat has no detrimental effects on the key soil speciesLumbricus terrestris. The Open Ecology J 5:45–52
49. Duc C, Nentwig W, Lindfeld A (2011) No adverse effect of genetically modified antifungal wheat on decomposition dynamics and the soil fauna community – a field study. PLoS ONE 6(10): e25014. doi:10.1371/journal.pone.0025014 50. Weaver RW, Angle JS, Bottomiey PS (1994) Methods of soil analysis. Part 2.
Microbiological and Biochemical properties, No. 5. Soil Sci Soc Am, Madison 51. Alef K, Nannipieri P (1995) Methods in Applied Soil Microbiology and
Biochemistry. San Diego, CA: Academic Press
52. Dick RP, Breakwel DP, Tureo RF (1996) Soil enzyme activities and biodiversity measurements as integrating microbiological indicators. In: Doran JW, Jones AJ. ed. Methods for Assessing Soil Quality. Soil Sci Soc Am, Madison, WI, 247–272 53. Icoz I, Saxena D, Andow DA, Zwahlen C, Stotzky G (2008) Microbial populations and enzyme activities in soil In Situ under transgenic corn expressing Cry proteins fromBacillus thuringiensis. J. Environ. Qual 37: 647–662 54. Shen RF, Cai H, Gong WH (2006) Transgenic Bt cotton has no apparent effect on enzymatic activities of functional diversity of microbial communities in rhizosphere soil. Plant Soil 285:149–159
55. Tan F, Wang J, Feng Y, Chi G, Kong H, et al. (2010) Bt corn plants and their straw have no apparent impact on soil microbial communities. Plant Soil 329: 349–364
56. Weiner N, Meincke R, Gottwald C, Radl V, Dong X, Schloter M, et al. (2010) Effects of genetically modified potatoes with increased zeaxanthin content on the abundance and diversity of rhizobacteria with in vitro antagonistic activity do not exceed natural variability among cultivars. Plant Soil 326:437–452 57. Kowalchuk GA, Bruinsma M, Van Veen JA (2003) Assessing responses of soil
microorganisms to GM plants. Trends Ecol and Evol 18: 403–410
58. Cardenas E, Tiedje JM (2008) New tools for discovering and characterizing microbial diversity. Curr Opin Biotech 19: 544–549
59. Hirsch PR, Mauchline TH, Clark IM (2010) Culture-independent molecular techniques for soil microbial ecology. Soil Bio Biochem 42: 878–887 60. Fierer N, Breitbart M, Nulton J, Peter S, Lozupone C, et al. (2007) Metagenomic
and small-subunit rRNA analyses reveal the genetic diversity of bacteria, archaea, fungi, and viruses in soil. Appl Environ Microbiol 73: 7059–7066 61. Uroz S, Ioannidis P, Lengelle J, Ce´bron A, Morin E, et al. (2013) Functional
assays and metagenomic analyses reveals differences between the microbial communities inhabiting the soil horizons of a Norway spruce plantation. PLoS ONE 8(2): e55929. doi:10.1371/journal.pone.0055929
62. Li Y, Fu K, Gao S, Wu Q, Fan L, et al. (2013) Impact on bacterial community in midguts of the asian corn borer larvae by transgenic Trichoderma Strain overexpressing a heterologous chit42 gene with chitin-binding domain. PLoS ONE 8(2): e55555. doi:10.1371/journal.pone.0055555