DANIEL NEGREIROS
ESTRATÉGIAS ECOLÓGICAS DE PLANTAS
DE CAMPO RUPESTRE
Belo Horizonte
Universidade Federal de Minas Gerais Instituto de Ciências Biológicas
Pós-Graduação em Ecologia, Conservação e Manejo da Vida Silvestre
ESTRATÉGIAS ECOLÓGICAS DE PLANTAS
DE CAMPO RUPESTRE
Daniel Negreiros
Tese de Doutorado apresentada ao Instituto de Ciências Biológicas da Universidade Federal de Minas Gerais como requisito parcial à obtenção do titulo de Doutor em Ecologia, Conservação e Manejo da Vida Silvestre.
Orientador:
Prof. Dr. G. Wilson Fernandes
Belo Horizonte
Apoio inotitucional
AGRADECIMENTOS
Ao meu orientador e amigo G. Wilson Fernandes por desde o primeiro dia ter me apoiado incondicionalmente, por ter sempre acreditado em mim, por ter me provido de tudo que precisei nas diversas fases do meu trabalho e por ser um cara muito legal, que sabe ser sério e brincalhão nas horas certas. Também por ter me apresentado o fascinante e maravilhoso mundo dos campos rupestres;
À Soizig pela extrema generosidade de me prover com diversas bases de dados brutos da sua Tese de doutorado e pelas várias ajudas nas coletas em campo. Digo com convicção que sem seu apoio este trabalho não teria sido possível;
Ao meu camarada Henrique pela sua inestimável ajuda e ativa participação nos trabalhos em campo e laboratório;
Ao meu eterno revisor e parceiro Lele, pelas várias revisões críticas e por ter me ensinado e estimulado a trabalhar com a ecofilogenia;
À minha amada esposa Jussara pela compreensão, apoio e estimulo ao longo de todo este estudo, além das várias ajudas nos trabalhos de campo. Também por aceitar que eu tenha me dedicado tão intensamente a esta tese;
À minha filha Iana por me animar a sempre progredir e avançar;
Aos meus pais Luiz e Icléia pelo apoio total e irrestrito, e especialmente pela confiança inabalável em mim;
À minha tia Sônia pelo grande apoio ao longo dessa tese;
À minha irmã Heloisa por ter me apoiado fortemente no início da minha formação acadêmica, e às suas filhas Maia e Sofia por torcerem por mim;
Ao meu grande amigo Ângelo pelos longos meses me ajudando no trabalhoso experimento de propagação e plantio de mudas em área degradada;
Ao meu amigo Newton por ter me ensinado a trabalhar no R;
Ao Mateus, Bárbara, Lélis, Michel, Rosa, Cassiano e Clarissa pelo apoio nos trabalhos de campo e laboratório;
Meus profundos agradecimentos ao professor S. Pierce por compartilhar suas perspectivas e gentilmente responder a inúmeras questões sobre a teoria CSR;
Aos professores e pesquisadores J.R. Pirani, P.L. Viana, B. Loeuille, R. Mello-Silva, L. Echternacht, N.O.M. Furtado e F.A.O. Silveira pelas identificações das espécies;
Aos meus co-autores Daniela Esteves, Yumi Oki, Marcelo Vichiato, Clarissa Chalub e Ricardo Berbara por toda ajuda no estudo do Baccharis;
Aos colegas do LEEB por terem pacientemente suportado minha espaçosa coleta de dados no laboratório;
Ao meu estimado Sensei Shikanai por me lapidar constantemente e me ajudar a manter a saúde em todos os aspectos;
Aos muitos dias em que tive a felicidade de estar respirando o ar do campo rupestre e enchendo meus olhos com sua exuberante e misteriosa beleza natural;
Ao apoio logístico provido pela Reserva Natural Vellozia;
SUMÁRIO
Apresentação ... 1
CAPÍTULO I. Adaptive strategies in highly diverse and harsh neotropical grasslands: the connection between environment and community traits ... 3
Abstract ... 4
Introduction... 5
Materials and Methods... 7
Results ... 13
Discussion... 19
References... 21
Supporting Information ... 26
CAPÍTULO II. Espelhamento da estrutura filogenética e funcional em dois habitats de campo rupestre ricos em espécies... 37
Resumo ... 38
Abstract ... 39
Introdução ... 40
Material e Métodos ... 43
Resultados ... 51
Discussão ... 59
Referências Bibliográficas ... 64
CAPÍTULO III. Trade-off entre crescimento e sobrevivência de arbustos nativos e
endêmicos plantados em campo rupestre degradado ... 84
Resumo ... 85
Abstract ... 86
Introdução ... 87
Material e Métodos ... 90
Resultados ... 96
Discussão ... 104
Referências Bibliográficas... 108
CAPÍTULO IV. Growth-survival tradeoff in the widespread tropical shrub Baccharis dracunculifolia (Asteraceae) in response to a nutrient gradient ... 114
Abstract ... 115
Introdução ... 115
Material e Métodos ... 118
Resultados ... 123
Discussão ... 125
APRESENTAÇÃO
O ramo da ecologia funcional de plantas tem crescido muito nas ultimas décadas, e
vem ganhando mais força com o advento de novas e instigantes ferramentas estatísticas, além
da disponibilidade de protocolos padronizados para amostragem de atributos de “fácil”
medição que são altamente relacionados com importantes processos ecossistêmicos. Estudos
em larga escala têm revelado a existência de eixos de especialização comuns na flora mundial
que refletem estratégias adaptativas e trade-offs em atributos relacionados com a história de
vida das espécies. Nesse sentido, a vegetação dos campos rupestres da Cadeia do Espinhaço
oferece um amplo horizonte de possibilidades para estudos empíricos e observacionais, pois
abriga uma flora e fauna altamente diversa e um rico mosaico de habitats com distintas
variações microambientais. Por outro lado as crescentes ameaças que esse ecossistema vem
sofrendo invoca um sério esforço aplicado com o fim de entendermos melhor os fatores que
governam e mantêm o equilíbrio nesse ambiente e assim oferecer subsídio para embasar
decisões de programas de conservação, manejo e restauração dos complexos rupestres de
altitude.
Neste estudo abordamos alguns aspectos das estratégias ecológicas das plantas que
ocorrem nos campos rupestres da Serra do Cipó, MG. No capítulo 1 aplicamos pela primeira
vez nos trópicos o esquema de estratégias ecológicas CSR (competitivo, estresse-tolerante e
ruderal) e observamos uma convergência funcional em resposta ao alto estresse ambiental.
Encontramos uma conexão significativa entre os atributos da vegetação e a estrutura do
habitat, evidenciando o papel dos filtros ambientais na determinação da diversidade e caráter
funcional das plantas nesses habitats. No capítulo 2 unimos funcionalidade e filogenia para
investigar a estrutura de comunidades nos campos arenosos e pedregosos de campo rupestre
em vários níveis da escala taxonômica (de todas as plantas encontradas nas parcelas até nível
de família ou tribo) e com isso contribuir para o entendimento das forças que moldam a
quanto inesperado de espelhamento da estrutura funcional e filogenética do campo pedregoso
em relação ao arenoso, que ressalta a importância da escala ecológica (i.e., distinções
microambientais nos ecossistemas) na determinação do padrão observado. No capítulo 3
propagamos e plantamos mudas de 11 espécies nativas e endêmicas de campo rupestre em
área degradada com substrato quartzítico. O monitoramento do crescimento e sobrevivência
das plantas evidenciou o clássico trade-off entre crescimento e sobrevivência previamente
relatado como um dos mecanismos chave na coexistência de espécies em formações arbóreas
limitadas primariamente pela disponibilidade luminosa. Finalmente, no capítulo 4 estudamos
uma espécie pioneira extremamente plástica e intrigante, Baccharis dracunculifolia
(Asteraceae) que ocorre tanto em áreas degradadas ou naturais com baixa fertilidade, quanto
em áreas agriculturáveis altamente férteis. O desempenho dessa espécie em um gradiente de
disponibilidade de nutrientes novamente indicou um trade-off entre crescimento e
sobrevivência, porém dessa vez em um contexto intra-específico. Este resultado sugere que a
plasticidade “estratégica” dessa espécie deve estar relacionada ao amplo espectro de situações
Capítulo I
Adaptive strategies in highly diverse and harsh neotropical grasslands:
the connection between environment and community traits
Daniel Negreiros1, Soizig Le Stradic1, 2, G. Wilson Fernandes1, *
1
Ecologia Evolutiva e Biodiversidade/DBG, CP 486, ICB/Universidade Federal de Minas Gerais, 30161-970. Belo Horizonte, MG, Brazil.
2
UMR CNRS/IRD 7263/237 IMBE - Institut Méditerranéen de Biodiversité et d'Ecologie – Université d’Avignon et des Pays de Vaucluse, IUT, Agroparc, BP 61207, 84 911 Avignon cedex 9, France
* Correspondence author. E-mail: gw.fernandes@gmail.com
Running headline: CSR strategies in neotropical grasslands
Abstract:
The classification of plant species according to the CSR ecological strategy scheme (competitive, stress tolerant and ruderal) has been proposed as a common language that allows comparison among species, communities and floras. Although several studies conducted on the European continent have demonstrated a strong association between these strategies and key ecosystem processes, studies of this type are still lacking in other ecoregions worldwide. For the first time the CSR strategy scheme is applied in a tropical plant community. In a grassland ecosystem characterised by high biodiversity associated with high environmental stress, we sampled various functional traits of 48 herbaceous species composing two distinct communities (stony and sandy grasslands) and evaluated the relationship of the CSR strategies and functional traits with several environmental parameters. The majority of the species in these two habitats had a proportion of stress tolerance above 50%. The low representativity of the C and R strategies indicates a functional convergence in response to high environmental stress, supporting the predictions of the CSR theory. The environmental peculiarities that distinguish these two habitats favoured distinct strategies. Considering the 19 categories of CSR strategies, category “S” corresponded to more than half of the total abundance in the stony grassland, whereas in the sandy grassland, there was a more equal distribution of abundance among the dominant strategies (S, S/SC and S/CSR). We found a significant connection between the vegetation traits and habitat structure. The strong association of stress tolerance and competitiveness with the environmental gradient showed the role of environmental filters in determining the functional diversity in these grasslands. The opposition between stress tolerance and competitiveness reflected both leaf economics and size spectra, previously recognised as the two main axes of plant specialisation worldwide. The coexistence of a large number of predominantly stress tolerant species in the habitats surveyed suggests a weaker role of competition on the structure of grasslands under high levels of environmental stress.
Introduction
The classification of plant species into functional types reflects the need for a common
language to establish comparisons between different types of flora, regions and scales
(Weiher et al. 1999; Duckworth, Kent & Ramsay 2000). A long series of studies led to the
identification of a set of traits that are often closely correlated to key functional properties of
plants (e.g., relative growth rate, leaf-decomposition rate, leaf life span and reproductive
investment), facilitating the quantification of these traits in a large number of species
(Cornelissen et al. 2003). According to the ecological strategy scheme known as CSR (C:
competitive; S: stress-tolerant; R: ruderal; Grime 1974, 1977, 2001; Grime & Pierce 2012),
sets of functional traits define plant survival strategies, representing trade-offs between the
ability to compete with neighbours (strategy C), tolerate stresses (strategy S), or survive
partial destruction of biomass (strategy R). According to this scheme, plants can exhibit
different proportions of the characteristics associated with each of the three primary
strategies: plants with greater stature due to investment in growth and the rapid uptake of
resources (C); plants with reduced stature and high longevity due to investment in durable and
well-defended structures (S); and small-sized plants with short longevity and a high
reproductive investment (R). The method of CSR classification proposed by Hodgson et al.
(1999) uses seven easily measured traits to calculate the relative importance of these three
primary strategies in herbaceous (i.e., non-woody) species. This method has been used in
several studies and applied to more than 1,000 species from diverse environments in Europe
(Caccianiga et al. 2006; Pierce et al. 2007a,b; Massant, Godefroid & Koedam 2009;
Cerabolini et al. 2010a,b; Navas et al. 2010), in general revealing a strong connection with
key ecosystem processes. The application of this classification in other types of vegetation
worldwide has the potential to improve the understanding of the underlying hypotheses of the
information for the development of conservation, management and restoration programs
targeting these plant communities.
Rupestrian grasslands are a unique ecosystem that occurs mainly at the peaks and
crests of mountains that make up the Espinhaço mountain range in the southeastern and
northeastern regions of Brazil. This ecoregion has a great conservation value due to its
enormous plant and animal biodiversity composed of a large number of endemic species
(Lara & Fernandes 1996; Giulietti, Pirani & Harley 1997; Echternacht et al. 2011; Carvalho et
al. 2012). In general, the physiognomy of rupestrian grasslands is characterised by the
presenceof herbs interspersed with small evergreen sclerophyllous shrubs (Giulietti, Pirani &
Harley 1997). The vegetation associated with this ecosystem is under high environmental
stress because of its highly infertile soils, which are of quartzite and sandstone origin and
have high levels of aluminium (Benites et al. 2007; Negreiros, Moraes & Fernandes 2008; Le
Stradic 2012) and a pronounced seasonal drought, intense light exposure, frequent fires and
strong and constant winds. Despite its apparent physiognomic homogeneity, this ecosystem
can be best defined as a mosaic of environments conditioned mainly by the particle-size
composition of the substrate (Carvalho et al. 2012; Le Stradic 2012), which varies from soils
with finer textures, such as in peat bogs and the crevices of rocky outcrops, to soils where
sand and gravel predominate (sandy and stony grasslands, respectively). The plant
communities of the sandy and stony grasslands of the Serra do Cipó were recently
characterised regarding their phytosociology and environmental parameters (Le Stradic 2012).
Although these two grassland types occur side by side, stony grasslands contain sparser
vegetation cover than sandy grasslands, with a larger proportion of bare rocky substrate, but
with greater nutrient levels relative to sandy grasslands. Therefore, these two distinct habitats
of rupestrian grasslands represent an ideal natural system to test the hypothesis that predicts a
direct relationship between the environmental characteristics of a habitat and the functional
the CSR classification of plant strategies in a tropical plant community. To the best of our
knowledge, there have been no reports of the application of the CSR classification (sensu
Hodgson et al. 1999) in the Southern Hemisphere, although some studies use a general
approach employing concepts that underlie the CSR theory (e.g., Mcg King & Wilson 2006;
Saporetti-Junior et al. 2012).
In this study, we aimed to evaluate the relative importance of C, S and R strategies in
two habitats typical of rupestrian grasslands by classifying a representative sample of
herbaceous species and evaluating the proportion of these strategies (among the 19 possible
categories) in these two communities. It was expected that in both habitats there would be a
predominance of the stress tolerance strategy and, in general, of traits that maximise the
conservation and protection of acquired resources (conservative type; Díaz et al. 2004;
Wright et al. 2004) because of indications that chronically unproductive environments favour
species with traits typical of stress resistance syndrome (Chapin, Autumn & Pugnaire 1993;
Grime et al. 1997; Aerts & Chapin 2000). In addition, we tested the hypothesis that stony and
sandy grasslands present distinct functional characteristics with a relationship between the
biological traits of the species within these habitats and the environmental peculiarities of
each habitat. Although both communities share a large number of the same species (Le
Stradic 2012), it is expected that the different environmental filters in these two habitats
favour distinct functional strategies and features (Pierce et al. 2007a,b).
Materials and Methods
Study area and species sampled
This study was carried out in the Reserva Natural Vellozia (19°17’46”S, 43°35’28”W,
altitude of approximately 1,200 m asl) and surrounding areas located in the Morro da Pedreira
Environmental Protection Area, Serra do Cipó, southern portion of the Espinhaço mountain
classification) and markedly seasonal, with two well-defined seasons: one rainy and hot
(between November and April) and the other dry and cold (between May and October). The
region has an annual precipitation of 1,370 mm and a mean annual temperature of 21.2°C
(Madeira & Fernandes 1999).
The phytosociological data obtained by Le Stradic (2012) were used in this study. The
floristic samples were collected in five areas of each habitat (i.e., stony and sandy), measuring
15 plots (1×1 m) in each area, totalling 75 plots per habitat. There was a minimum distance of
800 m between the areas in the same habitat. The abundance of each species within the plots
was measured as a number of sub-plots (20×20 cm) where a species occurred, ranging from 0
to 25 sub-plots per m2. A total of 48 herbaceous (non-woody) species were selected for the
measurements of functional traits. The selection was made to include the species with the
greatest abundance in each habitat, although rarer species were also sampled to obtain a
greater representativity of the functional description of the two communities studied. The
species sampled (42 in each habitat) corresponded to 76.31% and 75.97% of the total species
abundance in the stony and sandy grasslands, respectively. The remaining abundance not
sampled corresponded to 114 and 111 species in the stony and sandy grasslands, respectively
(Le Stradic 2012). Among the 36 species that occurred in both habitats, 21 species of greater
abundance were collected separately in each habitat. The 15 remaining species were collected
in the habitats where they occurred with greater abundance (see Table S1 in Supporting
Information).
Functional traits and CSR classification
Functional traits of recognised importance in ecosystem processes (Grime et al. 1997;
Weiher et al. 1999; Díaz et al. 2004) and widely used in studies of functional ecology (e.g.,
Cerabolini et al. 2010a; Batalha et al. 2011) were sampled. All measurements followed the
February (2010-2012), at the peak of the rainy season (i.e., the period considered most
favourable for plant growth in rupestrian grasslands; Silveira et al. 2012), ten healthy adult
individuals of each species were sampled from the surrounding locations of the areas where
the phytosociological measurements were taken.
The relative importance of the C, S and R strategies was calculated using seven
relatively easy to measure traits. Four traits were sampled in situ: the canopy height (from the
soil surface to the crown top), lateral spread (six categories related to the architecture and
clonality of the plant; see Hodgson et al. 1999), flowering period (normal duration of
flowering period) and month of the flowering start (obtained over two years of observation;
Le Stradic 2012). To determine the three leaf traits necessary for the calculations of the CSR
strategies (specific leaf area, leaf dry matter content and leaf dry weight), whole ramets were
collected in the field (e.g., bulbs or tussocks), preferably with a portion of the root system to
avoid the desiccation of the leaf material. The period of strongest sunlight (10:00-15:00) was
avoided during sampling. The ramets collected were immediately saturated with water using a
spray bottle, packed in moist paper bags, sealed in plastic bags and stored in a thermal box
until they were transported to the laboratory. The plant material collected was kept in a fridge
at 4°C for a minimum of 12 h to achieve complete turgidity. Measurements were taken from
two leaves (including the petiole) per individual up to 48 h after field collection. Only fully
expanded and hardened young leaves without signs of pathogens, herbivory, or malformation
were sampled, following Cornelissen et al. (2003). The leaf area was obtained with the use of
a desktop scanner and the Leaf Area Measurement software (A.P. Askew 2003, The
University of Sheffield, UK). Curved leaves were cut into fragments and positioned so that
they were in complete contact with the surface of the scanner. The leaf fresh weight was
obtained from the turgid leaves previously dried with soft paper towel and the leaf dry weight
was determined with an analytic scale (with a precision of 0.01 mg) after 96 h of drying in an
toughness and width were determined. The leaf toughness was measured using a digital
penetrometer (Chatillon modelo DFE-010, Largo, Florida, USA) coupled to a cone-shaped tip
(modelo SPK-FMG-009A), according to Silva & Batalha (2011). The values of leaf toughness
were standardised using leaf thickness (obtained with the use of a digital micrometer,
Mitutoyo series 293, with a precision of 0.0001 mm), according to Marquiz, Diniz, & Morais
(2001). The leaf width was obtained using a digital calliper (Mitutoyo 500-144B, with a
precision of 0.01 mm), measuring the leaf blade width in the position equidistant between the
base and the apex of the leaf. The level of endemism was determined based on geographic
distribution data for the species (Le Stradic 2012).
The classification of the species into categories of CSR strategies (among the 19
possible types) was carried out using a spreadsheet provided by Hodgson et al. (1999). The
percentage of importance of each CSR strategy was calculated using the method of Hodgson
et al. (1999), with the coordinates of the axes C, S and R adapted for ternary plots (after
Caccianiga et al. 2006) using the Excel spreadsheet provided by Pierce et al. (2007b). The
trait flowering start was used only in the calculations of non-graminoid species corresponding
to ten species: nine dicots and one Orchidaceae (see Table S1). Because this study was
performed in the Southern Hemisphere, a correction of six months was made to the values of
the month of flowering start to calculate the strategies (see Weiher et al. 1999). For a detailed
discussion of the validity of applying the CSR classification in the present study, please see
Appendix S1. In order to assess the relative importance of the C, S and R strategies in the
stony and sandy grasslands, the sampled species were represented in a triangular space
containing all the possible strategies (with each coordinate varying from 0 to 100%, following
Caccianiga et al. 2006). In addition, dominance-diversity curves (sensu, Whittaker 1965;
Grime 1998) were made using both the species sampled in the two communities and the
of the CSR strategies using colours was performed by converting the C, S and R coordinates
into red, green and blue, respectively, following Pierce et al. (2007b).
Relationship between the biological and environmental traits
To test the hypothesis that the functional traits of species are associated to the
characteristics of the habitat, an RLQ (R-mode linked to Q-mode) analysis using
simultaneously three matrices (floristic, biological and environmental) was performed. The
RLQ analysis was developed to study environmental filters in ecological communities by
assessing the combination of biological traits of maximum covariance with a given
combination of environmental parameters (Dolédec et al. 1996). In the floristic matrix (L), the
rows correspond to the areas (5 replicates × 2 habitats) and the columns correspond to the 48
species, with each cell containing the absolute abundance value of the species in the area. In
the biological matrix (Q), the rows corresponded to the species and the columns corresponded
to the functional traits. Mean values were used for the species that were sampled in both the
habitats (see Table S1). In the environmental matrix (R), the rows corresponded to the areas
and the columns corresponded to the environmental parameters. The data utilised in the
environmental matrix were obtained from the study of Le Stradic (2012). The soil pH,
percentage of organic carbon, aluminium saturation, sum of bases (K + Ca2+ + Mg2+),
phosphorus and nitrogen contents were determined according to Silva et al. (1999) from three
replicates per area in the dry and rainy seasons. The percentages of fine soil (fraction of soil
with particles smaller than 2 mm) and fine sand were determined according to EMBRAPA
(1999) from three replicates per area. The percentage of plant cover, litter cover and woody
species cover were estimated in each plot of 1×1 m used in the phytosociological survey (n =
15 replicates per area). For all the environmental parameters, the mean values of each area
were considered for the analyses. The sampling methodology and a detailed environmental
normality assumptions, the following traits were log-transformed: canopy height, flowering
period, specific leaf area, leaf dry weight, leaf toughness, leaf width, sum of bases, organic
carbon, nitrogen and phosphorus contents. The ordinal variables (lateral spread, flowering
start and endemism) were ranked and henceforth treated as quantitative variables. To conduct
the RLQ analysis, a correspondence analysis was used for the floristic matrix, while a
principal component analysis (PCA) was used for the biological and environmental matrices.
In the biological PCA, the species species were weighted by their overall relative abundance
over both habitats, while in the environmental PCA, the areas were weighted by the relative
number of plants observed (Dolédec et al. 1996; Dray & Dufour 2007; Pavoine et al. 2011).
Both analyses were carried out in the R (R Development Core Team, 2012) software with the
“ade4” package (Chessel, Dufour & Thioulouse 2004; Dray & Dufour 2007) and some
Results
In both communities, there was a clear predominance of the stress-tolerant strategy,
with the majority of species showing a proportion of S above 50% (Fig. 1a,b). The species
with the greatest abundance in the stony grassland was Mesosetum exaratum, which exhibited
an extremely stress-tolerant strategy (C:S:R = 18.8:81.2:0.0%), followed by Tatianyx
arnacites (25.9:74.1:0.0), which also exhibited a high ratio of stress tolerance (Fig. 1a,c). The
species with the greatest abundance in the sandy grassland was Paspalum erianthum
(23.7:76.3:0.0), with a high ratio of stress tolerance (Fig. 1b,d), followed by T. arnacites and
Homolepis longispicula (48.1:51.9:0.0), a species with a similar ratio of C and S. An
inspection of the dominance/diversity curve of the CSR strategies confirms this trend of
higher representativity of essentially stress-tolerant categories (e.g., S, S/SC and S/CSR) in
both habitats (Fig. 1e,f). However, in the stony grassland, there was a greater predominance
of stress tolerance, with the sum of species abundance fitting into the “S” category
corresponding to 51.0% of the total (Fig. 1e), while in the sandy grassland, there was a trend
toward more equal partitioning of abundance between dominant strategies (Fig. 1f).
Considering the 19 possible categories of strategies in the CSR space (Fig. 2), the
predominance of strategies close to the stress-tolerant corner of the triangle stands out (Fig.
3a-d). Although there was a strong resemblance between the two habitats regarding the
representativity of the CSR categories, the comparison based on abundance highlighted the
Fig. 1. Species sampled in two herbaceous communities of rupestrian grassland in Serra do Cipó, MG,
Brazil. (a) and (b): CSR classification showing the relative importance of the C (competitiveness), S (stress-tolerant) and R (ruderalism) axes in stony and sandy grasslands, respectively. The species were represented in grayscale according to their respective abundances; (c) and (d): dominance-diversity curve (sensu, Whittaker 1965) of the stony and sandy grasslands, respectively, ranking both communities by component species abundance; (e) and (f): dominance-diversity curve of the categories of the CSR strategies in the stony and sandy grasslands, respectively, showing the sum of the species abundance in each category. The numbering indicated in Figs a-d corresponds to the species shown in Table S1. The nomenclature of the CSR categories followed Hodgson et al. (1999).
Fig. 2. Denominations, coordinates and colour representation of the 19 categories of the CSR
Fig. 3. Categories of the CSR strategies and their representativity in two herbaceous communities of
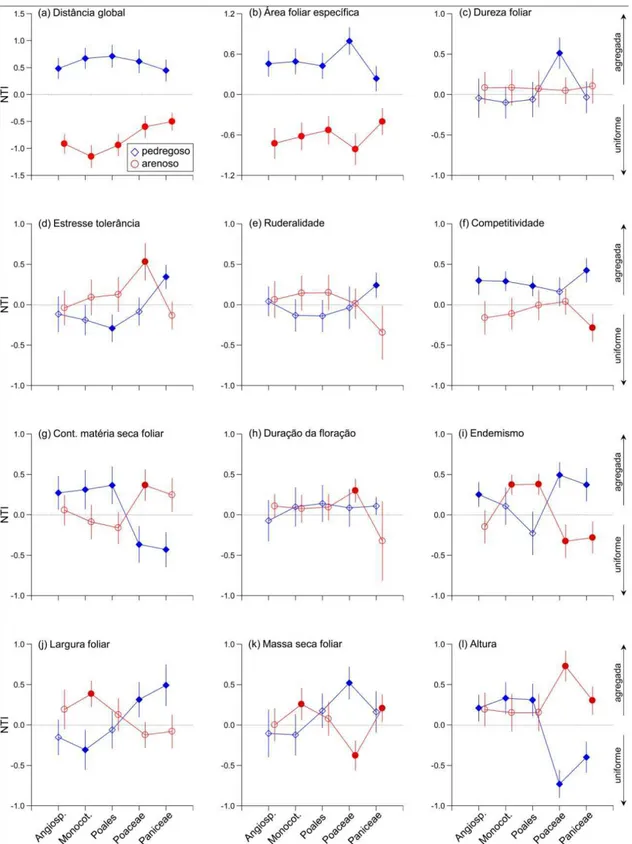
The overall association between the species traits and the habitat structure was
significant (p = 0.010) according to the test based on the total co-inertia of the RLQ analysis
(Monte-Carlo with 100,000 permutations). Axis 1 of the RLQ analysis accounted for 90.1%
of the total variation. The positive side of this axis corresponded to the areas with a greater
proportion of fine soil (particle size < 2 mm) with greater aluminium saturation, greater plant
cover, less acidic pH, greater proportion of fine sand, lower levels of nutrients and organic
carbon and less coverage by woody species (Fig. 4a). The species with greater importance in
these areas shared similar traits, showing wider geographic distributions, less stress tolerance,
greater competitiveness, greater stature and leaves that were larger and wider with less
toughness and sclerophylly (i.e., with greater specific leaf area and lower leaf dry matter
content; Fig. 4b). In contrast, the negative side of this axis represented areas with
predominantly stony soils (particle size > 2 mm) with greater levels of nutrients and organic
carbon and greater acidity, although with less aluminium saturation, less plant cover and
greater woody species cover (Fig. 4a). The species with greater importance in this area
generally exhibited a more restricted geographic distribution, greater stress tolerance, lower
competitiveness, smaller stature and leaves that were smaller and narrower with greater
toughness and sclerophylly (i.e., lower specific leaf area and higher leaf dry matter content;
Fig. 4b). The environmental parameter of litter cover and the biological traits flowering start,
flowering period, ruderalism and lateral spread showed low correlation with the main axis of
Fig. 4. Relationships between environmental and biological traits of the vegetation in stony and sandy
Discussion
The present study evaluated in situ functional characteristics of two herbaceous
communities in a neotropical mountain under heavy environmental stress, showing the role of
environmental filters in the determination of plant functional diversity in these habitats. The
greatest importance of stress tolerance in both habitats confirmed the expectation that
chronically unproductive environments favour species with traits typical of stress resistance
syndrome (Chapin, Autumn & Pugnaire 1993; Grime et al. 1997; Aerts & Chapin 2000) and,
in general, traits that maximise the conservation of acquired resources (Díaz et al. 2004;
Wright et al. 2004). Predominantly ruderal species were not found in either of the habitats and
the few species with a greater level of competitiveness had a low relative abundance, showing
a functional convergence in response to high environmental stress, corroborating the
predictions of the CSR theory (Grime 1974, 1977, 2001; Grime & Pierce 2012). On the other
hand, the environmental peculiarities that differentiate these habitats favoured distinct
strategies. In this sense, the comparison between the two habitats showed a relatively greater
abundance of the “S” category in the stony grassland and of the “SC” category in the sandy
grassland. Therefore, there are indications that the CSR classification is sufficiently sensitive
to detect differences in plant strategies even when comparing communities apparently
subjected to similar environmental conditions and sharing a majority of species.
The RLQ analysis indicated a strong association of stress tolerance and
competitiveness with the environmental gradient in the surveyed areas. This fact highlights
the validity of the CSR classification proposed by Hodgson et al. (1999) and adapted by
Caccianiga et al. (2006) in studies of ecological filters. The opposition between stress
tolerance and competitiveness reflected both leaf economics and size spectra, previously
recognised as the two main axes of plant specialisation worldwide, considering the
established phase of plant life cycles (Wright et al. 2004; Díaz et al. 2004; Cerabolini et al.
regenerative phase of the lifecycle of plants (the flowering start and flowering period) had a
generally low association with the environmental gradient. Because these two factors are
commonly related to the disturbance regime (Lavorel & Garnier 2002), this pattern could
indicate a minor role of disturbances in structuring these habitats. The areas with a greater
nutrient availability exhibited a greater proportion of species of smaller stature, greater
sclerophylly and greater stress tolerance. This apparently contradictory situation indicates that
in ecological studies of natural vegetation, the parameters used to characterise the habitat
structure should be selected based on the widest scope possible, never considering solely the
nutritional status. In the specific case of the vegetation studied, there are indications that
environmental stress is more associated with factors such as the ratio of bare soil and the
availability of physical space for roots, given that in stony soils the amount of fine soil is on
average only 40% (Le Stradic 2012). In addition, the coarser texture of the soil in the stony
grassland is associated with a lower water-retention capacity compared to the sandy grassland
(Nessim 2008, Saporetti-Junior et al. 2012). The functional spectrum demonstrated by the
opposition between stress tolerance and competitiveness was also related to the endemism of
the species, underlining the conservation value of studies of this nature, given that reduced
population size is frequently cited as one of the main causes of extinction of plant species in
this ecosystem (cf., Mendonça & Lins 2000; Ribeiro & Fernandes 2000).
Implicit in the analyses developed to demonstrate environmental filters in ecological
communities is the attribution of relative weights to species according to their abundance
(Dolédec et al. 1996; Dray & Legendre 2008). This weighting scheme reflects the idea that
dominant species should have a greater influence on ecosystem processes (Grime 1998; Díaz
et al. 2007; Mokany, Ash & Roxburgh 2008; Laughlin 2011; Lavorel et al. 2011). Keeping
sight of the fact that there is currently a long list of easily-measured traits that are highly
correlated to key physiological traits, ecological processes and ecosystem services (Weiher et
vegetation types of high priority for conservation should be sampled to identify their
dominant species with respect to these functional traits, such as those used in the present
study. In this way, valuable information will be made available with relatively little effort,
which may be incorporated into conservation and management programs given the relevance
of this information to understanding the resilience and resistance of these ecosystems to the
impacts of climate and land-use change (Díaz & Cabido 1997; Suding et al. 2008;
Frenette-Dussault et al. 2013).
Although the present study confirms the validity and applicability of the method of
classifying herbaceous species proposed by Hodgson et al. (1999) for a neotropical mountain
vegetation (more details in Appendix S1), we agree with Cerabolini et al. (2010a) that there is
still room to improve the calibration of the equations used in this classification. For example,
58% of the species evaluated by Cerabolini et al. (2010a) had 0.0% stress tolerance and 37%
of species in the present study had 0.0% ruderalism, which makes it clear that a recalibration
based on wider geographic and ecological samples has the potential to increase the precision
and applicability of this tool for functional studies worldwide.
This study demonstrated a strong connection between plant traits and habitat structure.
The coexistence of a large number of predominantly stress-tolerant species in the habitats
surveyed suggests a weaker role of competition (cf. Callaway et al. 2002; Butterfield &
Callaway 2013) on the structure of grasslands under high levels of environmental stress.
References
Aerts, R. & Chapin, F.S. (2000) The mineral nutrition of wild plants revisited: a re-evaluation of processes and patterns. Advances in Ecological Research, 30, 1–67.
Batalha, M.A., Silva, I.A., Cianciaruso, M.V., França, H. & Carvalho, G.H. (2011) Phylogeny, traits, environment, and space in cerrado plant communities at Emas National Park (Brazil). Flora, 206, 949–956.
Benites, V.M., Schaefer, C.E.R., Simas, F.N.B. & Santos, H.G. (2007) Soil associated with rock outcrops in the Brazilian mountain ranges Mantiqueira and Espinhaço. Revista
Butterfield, B.J. & Callaway, R.M. (2013) A functional comparative approach to facilitation and its context dependence. Functional Ecology, doi: 10.1111/1365-2435.12019.
Caccianiga, M., Luzzaro, A., Pierce, S., Ceriani, R.M. & Cerabolini, B. (2006) The functional basis of a primary succession resolved by CSR classification. Oikos, 112, 10–20.
Callaway, R.M., Brooker, R.W., Choler, P., Kikvidze, Z., Lortie, C.J., Michalet, R., Paolini, L., Pugnaire, F.I., Newingham, B., Aschehoug, E.T., Armas, C., Kikodze, D. & Cook, B.J. (2002) Positive interactions among alpine plants increase with stress. Nature, 417, 844–848.
Carvalho, F., Souza, F.A., Carrenho, R., Moreira, F.M.S., Jesus, E.C. & Fernandes, G.W. (2012) The mosaic of habitats in the high-altitude Brazilian rupestrian fields is a hotspot for arbuscular mycorrhizal fungi. Applied Soil Ecology, 52, 9–19.
Cerabolini, B.E.L., Brusa, G., Ceriani, R.M., de Andreis, R., Luzzaro, A. & Pierce, S. (2010a) Can CSR classification be generally applied outside Britain? Plant Ecology, 210, 253– 261.
Cerabolini, B., Pierce, S., Luzzaro, A. & Ossola, A. (2010b) Species evenness affects ecosystem processes in situ via diversity in the adaptive strategies of dominant species.
Plant Ecology, 207, 333–345.
Chapin, F.S., Autumn, K. & Pugnaire, F. (1993) Evolution of suites of traits in response to environmental stress. American Naturalist, 142, 578–592.
Chessel, D., Dufour, A.B. & Thioulouse, J. (2004) The ade4 package-I: one-table methods. R
News, 4, 5–10.
Cornelissen, J.H.C., Lavorel, S., Garnier, E., Díaz, S., Buchmann, N., Gurvich, D.E., Reich, P.B., ter Steege, H., Morgan, H.D., van der Heijden, M.G.A., Pausas, J.G. & Poorter, H. (2003) A handbook of protocols for standardised and easy measurement of plant functional traits worldwide. Australian Journal of Botany, 51, 335–380.
Díaz, S. & Cabido, M. (1997) Plant functional types and ecosystem function in relation to global change. Journal of Vegetation Science, 8, 463–474.
Díaz, S., Hodgson, J.G., Thompson, K., Cabido, M., Cornelissen, J.H.C., et al. (2004) The plant traits that drive ecosystems: evidence from three continents. Journal of Vegetation
Science, 15, 295–304.
Díaz, S., Lavorel, S., de Bello, F., Quétier, F., Grigulis, K. & Robson, T.M. (2007) Incorporating plant functional diversity effects in ecosystem service assessments.
Proceedings of the National Academy of Sciences, 104, 20684–20689.
Dolédec, S., Chessel, D., ter Braak, C.J.F. & Champely, S. (1996) Matching species traits to environmental variables: a new three-table ordination method. Environmental and
Ecological Statistics, 3, 143–166.
Dray, S. & Dufour, A.B. (2007) The ade4 package: implementing the duality diagram for ecologists. Journal of Statistical Software, 22, 1–20.
Duckworth, J.C., Kent, M. & Ramsay, P.M. (2000) Plant functional types: an alternative to taxonomic plant community description in biogeography? Progress in Physical
Geography, 24, 515–542
Echternacht, L., Trovó, M., Oliveira, C.T. & Pirani, J.R. (2011) Areas of endemism in the Espinhaço Range in Minas Gerais, Brazil. Flora, 206, 782–791.
Empresa Brasileira de Pesquisa Agropecuária - EMBRAPA (1997) Manual de Métodos e
Análises de Solo. 2a ed. EMBRAPA/CNPSO, Rio de Janeiro, Brazil.
Frenette-Dussault, C., Shipley, B., Meziane, D. & Hingrat, Y. (2013) Trait-based climate change predictions of plant community structure in arid steppes. Journal of Ecology, 101, 484–492.
Giulietti, A.M., Pirani, J.R. & Harley, R.M. (1997) Espinhaço range region, eastern Brazil.
Centres of Plant Diversity: A Guide and Strategy for their Conservation. (eds S.D.
Davis, V.H. Heywood, O. Herrera-MacBryde, J. Villa-Lobos & A.C. Hamilton), pp. 397–404. WWF/IUCN, Cambridge, UK.
Grime, J.P. (1974) Vegetation classification by reference to strategies. Nature, 250, 26–31. Grime, J.P. (1977) Evidence for the existence of three primary strategies in plants and its
relevance to ecological and evolutionary theory. The American Naturalist, 111, 1169– 1194.
Grime, J.P. (1998) Benefits of plant diversity to ecosystems: immediate, filter and founder effects. Journal of Ecology 86: 901–910.
Grime, J.P. (2001) Plant Strategies, Vegetation Processes and Ecosystem Properties, 2nd edn. Wiley, Chichester, UK.
Grime, J.P. & Pierce, S. (2012) The Evolutionary Strategies that Shape Ecosystems. Wiley-Blackwell, Chichester, UK.
Grime, J.P., Thompson, K., Hunt, R., Hodgson, J.G., Cornelissen, J.H.C., et al. (1997) Integrated screening validates primary axes of specialisation in plants. Oikos, 79, 259– 281.
Hodgson, J.G., Wilson, P.J., Hunt, R., Grime, J.P. & Thompson, K. (1999) Allocating C-S-R plant functional types: a soft approach to a hard problem. Oikos, 85, 282–294.
Lara, A.C.F. & Fernandes, G.W. (1996) The highest diversity of galling insects: Serra do Cipó, Brazil. Biodiversity Letters, 3, 111–114.
Laughlin, D.C. (2011) Nitrification is linked to dominant leaf traits rather than functional diversity. Journal of Ecology, 99, 1091–1099.
Lavorel, S., Grigulis, K., Lamarque, P., Colace, M.-P., Garden, D., Girel, J., Douzet, R. & Pellet, G. (2011) Using plant functional traits to understand the landscape-scale distribution of multiple ecosystem services. Journal of Ecology, 99, 135–147.
Le Stradic, S. (2012) Composition, phenology and restoration of campo rupestre mountain grasslands - Brazil. PhD Thesis, Université d’Avignon et des Pays de Vaucluse, Avignon, FR & Universidade Federal de Minas Gerais, Belo Horizonte, Brazil.
Madeira, J. & Fernandes, G.W. (1999) Reproductive phenology of sympatric taxa of
Chamaecrista (Leguminosae) in Serra do Cipó. Journal of Tropical Ecology, 15, 463–
479.
Marquis, R.J., Diniz, I.R. & Morais, H.C. (2001) Patterns and correlates of interspecific variation in foliar insect herbivory and pathogen attack in Brazilian cerrado. Journal of
Tropical Ecology, 17, 127–148.
Massant, W., Godefroid, S. & Koedam, N. (2009) Clustering of plant life strategies on meso-scale. Plant Ecology, 205, 47–56.
Mcg King, W. & Wilson, J.B. (2006) Differentiation between native and exotic plant species from a dry grassland: fundamental responses to resource availability, and growth rates.
Austral Ecology, 31, 996–1004.
Mendonça, M.P. & Lins, L.V. (2000) Lista Vermelha das Espécies Ameaçadas de Extinção
da Flora de Minas Gerais. Biodiversitas & Fundação Zoo-Botânica de Belo Horizonte.
Belo Horizonte, Brazil.
Mokany, K., Ash, J. & Roxburgh, S. (2008) Functional identity is more important than diversity in influencing ecosystem processes in a temperate native grassland. Journal of
Ecology, 96, 884–893.
Navas, M.L., Roumet, C., Bellmann, A., Laurent, G. & Garnier, E. (2010) Suites of plant traits in species from different stages of a Mediterranean secondary succession. Plant
Biology, 12, 183–196.
Negreiros, D., Moraes, M.L.B. & Fernandes, G.W. (2008) Caracterização da fertilidade dos solos de quatro espécies de leguminosas de campos rupestres, Serra do Cipó, MG, Brasil. Revista de la Ciencia del Suelo y Nutrición Vegetal, 8, 30–39.
Nessim, R. (2008) Influência das condições edáficas sobre a arquitetura aérea de
Lychnophora salicifolia Mart. Dissertação de Mestrado, Universidade Federal de Minas
Gerais, Belo Horizonte, Brazil.
Pavoine, S., Vela, E., Gachet, S., de Bélair, G. & Bonsall, M.B. (2011) Linking patterns in phylogeny, traits, abiotic variables and space: a novel approach to linking environmental filtering and plant community assembly. Journal of Ecology, 99, 165– 175.
Pierce, S., Ceriani, R.M., De Andreis, R. & Cerabolini, B. (2007a) The leaf economics spectrum of Poaceae reflects variation in survival strategies. Plant Biosystems, 141, 337–343.
Pierce, S., Brusa, G., Sartori, M. & Cerabolini, B. (2012) Combined use of leaf size and economics traits allows direct comparison of hydrophyte and terrestrial herbaceous adaptive strategies. Annals of Botany, 109, 1047–1053.
R Development Core Team (2012) R: a language and environment for statistical computing. Version 2.15.1. R Foundation for Statistical Computing, Vienna, Austria. http://www.r-project.org.
Ribeiro, K.T. & Fernandes, G.W. (2000) Patterns of abundance of a narrow endemic species in a tropical and infertile montane habitat. Plant Ecology, 147, 205–218.
Saporetti-Junior, A.W., Schaefer, C.E.G.R., Souza, A.L., Soares, M.P., Araújo, D.S.D. & Meira-Neto, J.A.A. (2012) Influence of soil physical properties on plants of the Mussununga ecosystem, Brazil. Folia Geobotanica, 47, 29–39.
Silva, F.C., Eira, P.A., Van Raij, B., Silva, C.A., Abreu, C.A., Gianello, C., Pérez, D.V., Quaggio, J.A., Tedesco, M.J., Abreu, M.F. & Barreto, W.O. (1999) Análises químicas para a avaliação da fertilidade do solo. Manual de Análises Químicas de Solos, Plantas
e Fertilizantes. (ed F.C. Silva), pp. 75–169. EMBRAPA, Brasília, Brazil.
Silva, D.M. & Batalha, M.A. (2011) Defense syndromes against herbivory in a cerrado plant community. Plant Ecology, 212, 181–193.
Silveira, F.A.O., Ribeiro, R.C., Oliveira, D.M.T., Fernandes, G.W. & Lemos-Filho, J.P. (2012) Evolution of physiological dormancy multiple times in Melastomataceae from Neotropical montane vegetation. Seed Science Research, 22, 37–44.
Suding, K.N., Lavorel, S., Chapin, F.S., Cornelissen, J.H.C., Díaz, S., Garnier, E., Goldberg, D., Hooper, D.U., Jackson, S.T. & Navas, M.L. (2008) Scaling environmental change through the community-level: a trait-based response-and-effect framework for plants.
Global Change Biology, 14, 1125–1140.
Weiher, E., van der Werf, A., Thompson, K., Roderick, M., Garnier, E. & Eriksson, O. (1999) Challenging Theophrastus: a common core list of plant traits for functional ecology.
Journal of Vegetation Science, 10, 609–620.
Whittaker, R.H. (1965) Dominance and diversity in land plant communities. Science, 147, 250–260.
Supporting Information
Table S1. Biological traits of 48 herbaceous species sampled in the stony and sandy grasslands of the Serra do Cipó, MG, Brazil.
Table S1. Biological traits of the herbaceous species sampled in the stony and sandy grasslands in Serra do Cipó, MG, Brazil. The values refer to the mean of ten replicates per species (species marked with “*” were collected separately in each habitat, with the mean of the two habitats shown). #: species code in Figs 1 and S2; Stony abund. and Sandy abund.: mean abundance as the sum of the 20×20 cm sub-squares where a species occurred in the stony and sandy grasslands, respectively; CSR category: categories of strategies according to Hodgson et al. (1999); C: competitiveness (%); S: stress tolerance (%); R: ruderalism (%); FS: flowering start (six ordinal categories, 1: July to September; 2: October; 3: November; 4: December; 5: January; 6: February to May); FS: duration of flowering period (months); LS: lateral spread (six ordinal categories, see Hodgson et al. 1999); CH: maximum canopy height considering only the vegetative portion (mm); LDW: leaf dry weight (mg); SLA: specific leaf area (mm2.mg-1); LDMC: leaf dry matter content (%); Leaf tough.: leaf toughness per thickness (gF.mm-1); Leaf width (mm); End.: endemism (five ordinal categories, 1: wide distribution; 2: Brazil; 3: Minas Gerais; 4: Espinhaço mountain range; 5: Serra do Cipó). Nomenclature follows the Lista de Espécies da Flora do Brasil 2010: http://floradobrasil.jbrj.gov.br/2010/
Family Species # abund. Stony abund. Sandy category CSR C S R FS FP LS CH LDW SLA LDMC Leaf
tough.
Leaf
width End.
Asteraceae Calea coronopifolia Sch.Bip.
ex Krasch. 1 0 6 SC/CSR 30.4 39.2 30.4 2 2 2 239 11.5 8.9 30.5 259.7 2.8 3
Asteraceae Richterago polymorpha
(Less.) Cabrera 2 0 11 C/SC 66.9 33.1 0.0 1 2 3 153 412.7 6.9 33.4 431.7 34.7 4
Asteraceae Richterago arenaria (Baker)
Roque 3 124 94 C/CR 63.9 18.1 18.0 6 3 3 117 628.5 6.2 31.3 415.8 36.3 2
Convolvulaceae Evolvulus lithospermoides
Mart. 4 3 1 SR/CSR 24.1 34.5 41.4 11 6 2 175 6.6 14.9 30.2 130.8 5.7 3
Orobanchaceae Agalinis brachyphylla (Cham.
& Schltdl.) D'Arcy 5 15 0 SC/CSR 32.4 36.0 31.5 4 1 2 220 5.3 6.0 27.0 244.4 3.8 4
Lamiaceae Eriope arenaria Harley 6 9 31 S/SC 29.2 60.6 10.3 12 2 4 77 3.1 11.8 33.4 356.2 4.0 3
Amaranthaceae Gomphrena incana Mart. 7 36 22 C/CR 54.1 16.8 29.1 12 5 4 139 205.3 7.5 29.2 150.0 21.9 1
Polygalaceae Polygala glochidata Kunth. 8 0 28 SR 19.3 40.4 40.3 5 1 1 128 0.6 12.7 28.0 74.3 0.8 4
Melastomataceae Siphanthera arenaria (DC.)
Cogn. 9 36 0 S/SC 29.8 70.2 0.0 11 2 5 176 1.4 7.5 50.2 148.5 3.0 2
Poaceae Homolepis longispicula
(Döll) Chase* 10 475 1163 SC 48.1 51.9 0.0 12 1 6 402 226.5 4.9 38.5 745.4 3.9 4
Poaceae Tatianyx arnacites (Trin.)
Poaceae Mesosetum exaratum (Trin.)
Chase* 12 1395 580 S 18.8 81.2 0.0 12 1 3 99 14.1 3.7 45.5 482.2 0.7 1
Poaceae Mesosetum loliiforme
(Hochst.) Chase* 13 37 82 S/SC 26.0 64.1 9.9 2 1 2 191 50.7 15.2 34.5 285.2 7.9 1
Poaceae Axonopus sp.* 14 293 212 S 25.9 74.1 0.0 1 1 3 195 21.7 5.3 36.3 788.2 0.8 1
Poaceae Echinolaena inflexa (Poir.)
Chase* 15 11 60 S/SC 37.6 56.0 6.4 1 2 5 330 37.0 11.1 36.8 308.9 7.5 1
Poaceae Paspalum erianthum Nees ex
Trin. * 16 742 1380 S/SC 23.5 76.5 0.0 1 1 2 196 109.7 7.5 35.9 344.3 6.0 1
Poaceae Paspalum pectinatum Nees ex
Trin. 17 142 17 S 23.0 77.0 0.0 11 1 2 239 84.2 7.5 38.8 430.1 5.7 1
Poaceae Panicum cyanescens Nees 18 31 271 S/SC 39.8 52.5 7.6 2 1 5 356 14.4 12.7 42.2 279.3 5.0 1
Poaceae Schizachyrium tenerum
Nees* 19 418 213 S 24.6 70.4 4.9 2 2 3 258 14.8 6.3 44.0 664.6 0.8 1
Poaceae Trachypogon spicatus (L.f.)
Kuntze* 20 559 318 S/SC 34.0 66.0 0.0 1 2 3 495 57.1 3.5 51.7 511.1 0.6 2
Poaceae Aulonemia effusa (Hack.)
McClure 21 5 0 SC 50.0 50.0 0.0 2 1 5 1011 1079.3 4.7 52.2 1137.8 40.6 5
Xyridaceae Xyris melanopoda L.B.Sm. &
Downs 22 168 16 S 25.4 72.5 2.1 1 3 3 137 59.1 6.0 43.7 577.3 4.3 3
Xyridaceae Xyris minarum Seub. 23 615 9 S 10.8 69.2 20.0 1 4 2 99 4.6 7.3 44.4 459.5 0.5 4
Xyridaceae Xyris nubigena Kunth 24 105 448 S/CSR 25.7 55.9 18.4 2 4 3 135 37.2 12.1 26.7 337.0 5.4 2
Xyridaceae Xyris obtusiuscula
L.A.Nilsson* 25 448 192 S 24.9 71.2 3.9 2 3 3 117 32.8 5.3 45.5 851.8 2.0 5
Xyridaceae Xyris pilosa Kunth* 26 343 83 S 25.5 73.0 1.4 4 3 3 129 64.3 5.8 38.9 462.7 3.1 4
Eriocaulaceae Paepalanthus geniculatus
Kunth* 27 180 173 S/SR 14.3 64.2 21.5 12 4 3 48 11.4 10.2 23.6 243.3 3.3 4
Eriocaulaceae Paepalanthus nigrescens
Silveira 28 185 0 S/CSR 17.8 62.5 19.6 4 4 3 76 29.8 11.5 22.6 280.6 9.8 4
Eriocaulaceae Leiothrix crassifolia (Bong.)
Ruhland 29 9 117 S/CSR 17.4 55.3 27.3 3 4 4 42 11.2 17.5 25.8 288.1 4.4 5
Eriocaulaceae Syngonanthus cipoensis
Ruhland* 30 73 209 S 20.2 70.2 9.6 6 5 2 106 76.3 5.9 38.0 751.0 3.5 4
Cyperaceae Rhynchospora riedeliana
C.B. Clarke* 31 265 474 S/CSR 17.6 49.0 33.4 10 12 3 159 48.5 9.4 41.6 417.9 3.9 4
Cyperaceae Rhynchospora ciliolata
Cyperaceae Rhynchospora terminalis
(Nees) Steud. * 33 393 345 S/SR 9.0 57.7 33.3 11 12 2 61 22.0 4.0 37.9 637.1 3.0 1
Cyperaceae Rhynchospora tenuis subsp.
austrobrasiliensis T. Koyama* 34 345 619 S/CSR 18.1 62.0 19.9 6.5 4 3 121 7.0 9.9 42.0 460.8 0.6 1
Cyperaceae Bulbostylis eleocharoides
Kral & M.T. Strong 35 0 1 S 25.9 74.1 0.0 2 2 3 247 70.1 6.4 47.4 548.6 1.0 1
Cyperaceae Bulbostylis emmerichiae T.
Koyama 36 19 325 S/SC 22.6 70.1 7.2 11 2 2 163 11.5 6.4 29.1 442.6 0.9 5
Cyperaceae Bulbostylis lombardii Kral &
M.T.Strong 37 205 5 S/CSR 28.3 59.6 12.2 8 3 5 69 5.2 6.6 36.3 504.1 1.1 1
Cyperaceae Bulbostylis paradoxa
(Spreng.) Lindm.* 38 133 94 S/SC 31.9 60.0 8.1 9 2 5 104 7.0 7.0 50.4 758.4 0.5 4
Cyperaceae Lagenocarpus tenuifolius
(Boeck.) C.B.Clarke* 39 789 724 S/CSR 22.2 51.8 26.0 1 12 3 295 98.8 4.8 57.0 523.5 2.7 4
Cyperaceae Lagenocarpus alboniger
(A.St.-Hil.) C.B.Clarke* 40 130 28 S/CSR 20.1 57.5 22.4 1 12 3 282 268.7 3.3 55.6 594.5 1.6 4
Cyperaceae Lagenocarpus velutinus Nees 41 0 41 S 23.3 66.6 10.1 7 6 3 209 195.8 6.8 46.1 490.1 4.0 4
Rapateaceae Cephalostemon riedelianus
Körn. 42 0 3 S/SC 41.3 58.7 0.0 2 2 3 558 630.6 7.0 21.8 595.4 6.2 1
Orchidaceae Cyrtopodium parviflorum
Lindl. 43 1 0 C/SC 77.4 22.6 0.0 9 1 2 286 223.0 13.3 28.0 148.2 18.8 4
Velloziaceae Vellozia caruncularis Mart. ex
Seub.* 44 318 15 S/SC 31.3 68.7 0.0 5 1 4 198 85.9 7.3 41.5 411.0 5.7 3
Velloziaceae Vellozia resinosa Mart. 45 408 2 S/SC 37.2 62.8 0.0 5 1 5 231 466.7 4.7 39.7 585.7 16.1 1
Velloziaceae Vellozia variabilis Mart. ex
Schult. f. 46 25 5 S/SC 34.0 66.0 0.0 2 1 3 516 1135.6 4.5 46.4 1095.6 20.0 4
Velloziaceae Vellozia epidendroides Mart.
ex Schult. & Schult.f.* 47 273 281 S 25.9 74.1 0.0 3 2 3 180 82.2 4.3 52.4 546.9 3.6 5
Appendix S1. Validation of the CSR classification for tropical grassland vegetation.
The CSR method of classification applied to herbaceous vegetation developed by
Hodgson et al. (1999) was calibrated using 43 British species representative of diverse
habitats with contrasting ecological conditions. Although the sample of herbaceous species
used by Hodgson et al. (1999) had a relatively restricted geographic scope, recent studies
throughout Europe in diverse climatic and biogeographic zones confirmed the applicability
and validity of this classification in broader contexts (Caccianiga et al. 2006; Pierce et al.
2007a,b; Massant, Godefroid & Koedam 2009; Cerabolini et al. 2010a,b; Navas et al. 2010).
Because the CSR classification (sensu Hodgson et al. 1999) is being applied for the first time
in the tropics in the present study, we describe below the correlations between the CSR
coordinates and the biological traits used in the calculations of the strategies, in addition to
some other biological traits of interest (Table S2).
In general, the correlations between the coordinates of the C, S and R strategies and
the traits followed the predictions of the CSR theory (Table S2). The C axis had a positive
correlation with the traits related to the size spectrum (canopy height, lateral spread, leaf dry
weight and leaf width) and a negative correlation with the flowering period. The S axis was
mainly associated with the leaf economics spectrum, having a positive correlation with
sclerophylly (lower specific leaf area and greater leaf dry matter content and toughness) and a
negative correlation with leaf width. The R axis showed a correlation pattern exactly inverse
to that observed for the C and S axes: the R axis correlated negatively with the size spectrum
and sclerophylly and positively with the flowering period. The trait flowering start was not
correlated with any strategy. The abundance of species in the areas surveyed correlated
Table S2. Pearson’s correlation (n = 48 species) between the coordinates of the CSR strategy and biological traits in grassland vegetation from stony and sandy grasslands in Serra do
Cipó, MG, Brazil. The traits used in the calculations of the CSR strategies are marked in bold.
The following traits were log-transformed to meet normality assumptions: specific leaf area,
leaf dry weight, canopy height, flowering period, leaf toughness, leaf width and abundance.
For the ordinal traits (lateral spread and flowering start), the Spearman’s rank correlation was
used. The significance is denoted by *: p < 0.05; **: p < 0.01; ***: p < 0.001; NS:
non-significant
C (competitiveness) S (stress tolerance) R (ruderalism)
Specific leaf area NS -0.315* 0.337*
Leaf dry matter content NS 0.395** -0.306*
Lead dry weight 0.532*** NS -0.433**
Canopy height 0.417** NS -0.352*
Lateral spread 0.445** NS -0.301*
Flowering period -0.373** NS 0.616***
Flowering start NS NS NS
Leaf toughness NS 0.470** -0.459**
Leaf width 0.633*** -0.461** NS
Abundance -0.446** 0.469** NS
Some studies recently conducted in Europe investigated the validity of the CSR
classification in their samples based on correlations between the CSR coordinates and the
main axes of variation obtained by multivariate analyses using matrices of species by traits
(Caccianiga et al. 2006; Pierce et al. 2007b; Cerabolini et al. 2010a). To confirm the
suitability of applying the CSR classification (in its present form) in a tropical grassland, we
& Keough 2002). The PCA was performed considering a matrix with 48 species and nine
traits, with seven variables used to calculate the CSR strategies and two additional variables
related to the leaf economics and size spectrum (leaf toughness and width, respectively). The
transformations of the variables were the same as those cited in Table S2. A varimax
(orthogonal) rotation of the eigenvectors was employed to facilitate the interpretation and
simplify the structure of the principal components retained by the PCA. We report below the
correlations between each PCA axes with i) the CSR coordinates (i.e., percentage of
importance of the C, S and R strategies in each species) and ii) the biological traits considered
Fig. S2. Principal component analysis of the herbaceous samples from stony and sandy grasslands of Serra do Cipó, MG, Brazil. Arrows indicate the traits, and circles indicate
species (n = 48). Pearson’s correlations between the PCA axes and both the CSR coordinates
and the biological traits used in the analysis are shown. For the ordinal traits (lateral spread
and flowering start), the Spearman’s correlation was used. The significance of the correlations
is denoted by *: p < 0.05; **: p < 0.01; ***: p < 0.001. The numbering in the circles
corresponds to the species shown in Table S1.
The two main components of the PCA corresponded to 54.6% of the total variation of
the data. In summary, the opposition of stress tolerance and ruderalism evident in the PCA
axis 1 was related both to the leaf economics spectrum (stress tolerant species have more
sclerophyllous leaves than ruderal species, i.e., with lower specific leaf area, greater leaf dry
matter content and greater toughness) and to the size spectrum (more stress tolerant species
exhibit greater canopy height and leaf dry weight than ruderal species; Fig. S2). On the other
hand, the PCA axis 2 represented the oposition between competitiveness and ruderalism,
associated with the traits related to the size spectrum and reproduction (competitive species
possess greater canopy height, along with larger and wider leaves, in addition to exhibiting
shorter flowering period and later flowering start relative to the ruderal species; Fig. S2).
The results shown in Table S2 and Fig. S2 indicate that, at least in this tropical
grassland, this classification generally operates according to the original predictions of the
CSR theory. The association between the CSR strategies and the functional traits evident in
the present study corroborates the patterns observed in other grassland vegetation in temperate
regions (e.g. Caccianiga et al. 2006; Pierce et al. 2007a,b; Cerabolini et al. 2010a),
reinforcing the universality of the theory of CSR adaptive strategies (Grime & Pierce 2012;