Genetic parameters and predicted gains with
selection of interspecific hybrids of
Paspalum
for seed production
Rodrigo Ramos Lopes
1*, Lucia Brandão Franke
1, Cleber Henrique
Lopes de Souza
1, Patricia Bertoncelli
1, Larissa Arnhold Graminho
1and Emerson André Pereira
2Abstract: The aim of this study was to estimate the genetic parameters and
predicted gains with selection of interspecific hybrids of Paspalum in relation to seed production traits Data were analyzed in randomized block design, with 23 genotypes arranged into ten blocks, according to the methodology of mixed models by the REML/BLUP procedure. The traits considered in the study were: number of total tillers/plant, number of reproductive tillers/plant, number of racemes/inflorescence, number of seeds/inflorescence, weight of a thousand seeds and seed production. Variability among genotypes, high heritability (>0.50), except total tillers (0.44) and number of racemes (0.36), and high accuracy (>0.90) were identified for all traits. The hybrids 10E5052, 10E4026, 10E507, 10E4025 and 10E40104 are among the top ten because they have high genetic values in three or more traits, indicating that these genotypes should be recommended for direct use in planting or potential parents to be used in new crosses.
Keys words: Paspalum plicatulum, Paspalum lepton, REML/BLUP, heritability,
selective accuracy.
Crop Breeding and Applied Biotechnology 18: 284-291, 2018 Brazilian Society of Plant Breeding. Printed in Brazil http://dx.doi.org/10.1590/1984-70332018v18n3a42 ARTICLE
*Corresponding author:
E-mail: [email protected]
Received: 10 October 2017 Accepted: 08 May 2018
1 Universidade Federal do Rio Grande do Sul
(UFRGS), Departamento de Plantas Forragei-ras e Agrometeorologia, 91.501-970, Porto Alegre, RS, Brazil
2 Universidade Regional do Noroeste do
Estado do Rio Grande do Sul (UNIJUÍ), Depar-tamento de Estudos Agrários, 98.700-000, Ijuí, RS, Brazil
INTRODUCTION
The Paspalum genus has a large number of species considered as excellent
forages, not only because of its ecological, productive, and bromatological quality, but also because of its great heterogeneity: apomixis, polyploidy, and interspecific hybridization (Sartor et al. 2011).
The improvement of apomictic species, totally or highly sexual plants are necessary, so that it is possible to perform crosses, thus releasing genetic variability (Savidan et al. 1989). According to Sartor et al. (2009), the discovery of sex diploid plants in natural populations of P. plicatulum made it possible to obtain a sexual tetraploid plant, called 4c-4x, by inducing polyploidy with colchicine. From crosses with compatible species, new interspecific hybrids were obtained, producing new genetic combinations, permanently fixing a heterozygous progeny for immediate evaluation such as F1 varieties potencies (Aguilera et al. 2011, Pereira et al. 2017).
agronomic characteristics and the potential capacity to produce viable seeds are crucial for the wide dissemination of new cultivars (Lopes and Franke 2011). In this context, genetic improvement depends on the correct selection of the best individuals as parents of the next generations, in order to reduce efforts and shorten the time needed to obtain superior genetic material through apomixia (Sartor et al. 2009).
According to Resende (2016), the success of breeding programs depends on precise estimates of genetic parameters, including reliable predictions of breeding values. Restricted Maximum Likelihood (REML) followed by the Best Linear Unbiased Prediction (BLUP) is the standard procedure in quantitative genetics and selection in perennial plants, allowed enables to achieve maximum genetic gain in selected breeding populations (Resende and Duarte 2007). The principle of REML/BLUP procedure lies in interative maximization of a likelihood function to estimate genetic variances through REML that are then employed by BLUP procedures in order to predict individual breeding values (Lynch and Walsh 1998). BLUP is considered a preferred procedure because it offers more precision for various experimental conditions, and it maximizes the correlation between the true and predicted genotypic values and the predicted genotypic value relative to other methodologies, which is essential for the breeder (Resende 2002). The objective of this study was to estimate the genetic parameters and predicted gains with selection, based on the production seed traits of interespecif hybrids P. plicatulum × P. lepton.
MATERIAL AND METHODS
The experiment was conducted in the 2013/2014 and 2014/2015 growing seasons in Eldorado do Sul (Rio Grande do Sul state, RS), located in the Central Depression region (lat 30º 05’ 52” S, long 51º 39’ 08” W, and alt 32 m asl). The climate is type Cfa, according to the Köppen classification system, with annual rainfall of 1440 mm (monthly average of 120 mm). The soil is dystrophic Argisoil (Rhodustults, PVd) (Santos et al. 2013), with the following chemical characteristics: pH (H2O) = 5.6; SMP index = 6.1; P = 4.5 mg dm-3; K = 80 mg dm-3; organic matter (OM) = 1.2%; Al3+ = 0.0 cmol dm-3; Ca2+
= 2.9 cmolc dm-3; Mg2+ = 1.4 cmolc dm-3; and cation exchange capacity (CEC) = 8.4 cmolc dm-3. The experimental area
(11.0 m × 28.0 m = 308.0 m2) was corrected with 2215 kg ha-1 of lime on July 7, 2013. In October 2013, 250 kg ha-1 of
5-20-20 fertilizer completed the demand for potassium. This recommended amount was supplemented with 100 kg ha-1 of N (urea) and 125.5 kg ha-1 of P
2O5 (triple superphosphate), meeting the needs of perennial warm-season grasses
(CQFS-RS/SC 2016). In the second year, 25 kg ha-1 of N (urea) and 65 kg ha-1 of P
2O5 (replenishment dose) were applied.
Twenty-three apomictic genotypes of Paspalum were used (10E6086, 10E5052, 10E4071, 10E5023, 10E4026, 10E507,
10E4025, 10E40104, 10E6084, 10E6069, 10E4076, 10E4077, 10E5017, 10E6024, 10E6088, 10E6022, 10E4099, 10E4087, 10E40177, 10E50150, 10E4039, 10E6058 and 10E6047), belonging to Universidade Federal do Rio Grande do Sul, originated from artificial crosses between P. lepton (male genitor; native genotype from Rio Grande do Sul state), and P. plicatulum 4c-4x (female genitor), from Botanical Institute of the Northeast (IBONE, Argentina), with the objective of get promising combinations related to forage production. The male genitor (P. lepton) stood out in preliminary studies for greater forage production (Pereira et al. 2011, Pereira et al. 2012).
Seedlings were kept in a greenhouse during the winter until the time for planting in the field (Oct. 24, 2013). In the second year, rejuvenation pruning was performed on all the genotypes (Sept. 26, 2014), leaving 0.15 m of residue.
a precision scale (expressed in g).
The experimental design was a randomized block design, with the genotypes arranged individually in ten blocks. The experiment consisted of 230 experimental units (spacing on the row and interrow of 1.0 m), corresponding to the twenty-three genotypes in ten replications. The data were analyzed using the mixed model methodology, using the SELEGEN software (Resende 2016), obtaining the estimate for genetic parameter and the predicted genotypic values, using the REML/BLUP procedure, for the genotype ordering. The genetic-statistical model used considered the randomized block design in one location and two harvest, according to the model below (Resende 2007):
y = Xm + Zg + Wp + e
In which, y is the data vector; m is the vector for the effects of the measurement-repeat combinations (assumed as
fixed) added to the general mean; g is the vector of the genotypic effects (assumed to be random); p is the vector of
the permanent environment effects (experimental units) (random); e is the vector of errors or residuals (random). The
capital letters (X, Z and W) represent the incidence matrices for the said effects (m, g and p, respectively).
The structures of means and variances associated with the model are described by the following:
y | m, V ~ N(Xm, V)
g | A, σ 2g ~ N(0, Aσ 2g) p | σ 2
p ~ N(0, Iσ 2
p)
e | σ 2res ~ N(0, Iσ 2res)
In which, V is the phenotypic covariance matrix; I is an identity matrix; σ 2g , σ 2
e and σ 2
res are the genotypic, environment
and residual variances, respectively.
The covariance between all of the random effect models was assumed by the following: Cov(g,p') = 0; Cov(g,e') = 0 andCov(p,e') = 0
The assumed distributions and mean structures (S) and variance (Var) were:
S
[
y g p e]
=[
Xm 0 0 0]
; Var
[
yg
p e
]
=
[
V ZG WC R GZ' G 0 0 CW' 0 C 0
R 0 0 R
]
in wich
G = Aσ 2g,R = Iσ 2p,C = Iσ 2e; and: V = ZAσ 2g Z' + W Iσ 2p W' + Iσ 2e = ZGZ' + WCW' + R
The system of linear equations [mixed model equations (MMEs)] that were used to obtain the solutions of the model were:
[
X'X X'Z X'WZ'X Z'Z + A–1λ
1 Z'W
W'X W'X W'W + Iλ1
]
–1
[
m̂ĝ p̂
]
=[
X'y
Z'y
W'y
]
in wichλ1 = σ̂ 2res σ̂ 2
g
= 1 – h 2g – c2
h 2g ; λ2 =
σ̂ 2
res σ̂ 2
p
= 1 – h 2g – c2
c 2
The estimates of variances and genetic parameters are given as follows: genotypic variance (σ̂ 2
g); environment
variance (σ̂ 2
e); residual variance (σ̂ 2
res); phenotypic variance (σ̂ 2p = σ̂ 2
g + σ̂ 2e + σ̂ 2
res); individual heritability in the broad sense
(h 2g = σ̂ 2g /σ̂ 2g + σ̂ 2e + σ̂ 2res); genetic variation coefficient CVg = σ 2̂g. 100/X̅ ; residual variation coefficient (CVres = σ̂ 2res. 100/
X̅ ); relative variation coefficient (CVr= CVg/CVres); overall mean (X̅)andgenetic accuracy in genotype selection (Acgen) (Resende and Duarte 2007):
Acgen =
[
b h2g1 + (b – 1) h2g
]
In which, b is number of blocks considering randomized complete block design.
The significance of the random effects was obtained through Deviance Analysis, using the REML method (Restricted Maximum Likelihood), via LRT (Likelihood Ratio Test). The deviances were obtained as described by Resende (2016), using the model with and without the respective effects, subtracting the deviance obtained in the complete model, of the model without the effect, and compared to the value of the Chi-square (χ²) at 1% probability, with one degree of freedom. The factor block, considered as fixed effect, was tested by the F test of Snedecor.
RESULTS AND DISCUSSION
The highest estimates of the genetic variance (σ̂ 2
g) were for WTS, NSI and RT traits, indicating that, in this germplasm,
there are favorable conditions for selection and improvement of these traits (Table 1). When values are positive and non-zero, there is greater genetic variation and the greater the chances of genetic gains with selection. In Paspalum
species, a large portion of the components linked to seed yield are related to inflorescence (NSI and WTS) and its reproductive tillers (RT) (Lopes and Franke 2011, Lopes et al. 2016) serving as an indicator for breeding programs aimed at the production of forage species seed (Biligetu et al. 2012).
The success with the selection also depends on the environmental variation (σ̂ 2
e), since the present variation in the phenotype is due to the environmental conditions. The estimates of the environmental variance were low when compared to the others, inferring that there was high experimental precision and low environmental interference on the genotypes, confirming the adequate planning for the plot size and number of experiment repetition (Table 1).
It is of great importance that the phenotypic variation (σ̂ 2
p) be composed, for the most part, of variations from the genotype of the selection candidates, since it contributes to higher heritability of the trait in question. We highlight the high phenotypic variation of the WTS and NSI traits, basically composed by the variation of the genotype (Table 1). According to Lopes et al. (2017), WTS and NSI were the most efficient (largest relative contribution) in explaining genetic variability among P. plicatulum × P. lepton hybrids, showing the importance of these variables as a component in the production of seeds and, possibly in the selection of superior genotypes.
Estimates of individual heritability in the broad sense (h 2g) for the evaluated traits revealed values considered
medium (0.15 < h 2g > 0.50) and high (h 2g> 0.50) (Resende 2007) (Table 1). Şeker et al. (2014), when evaluating the seed
production from Dactylis glomerata L. populations, found high values of h 2g (0.64) showing strong genetic control of
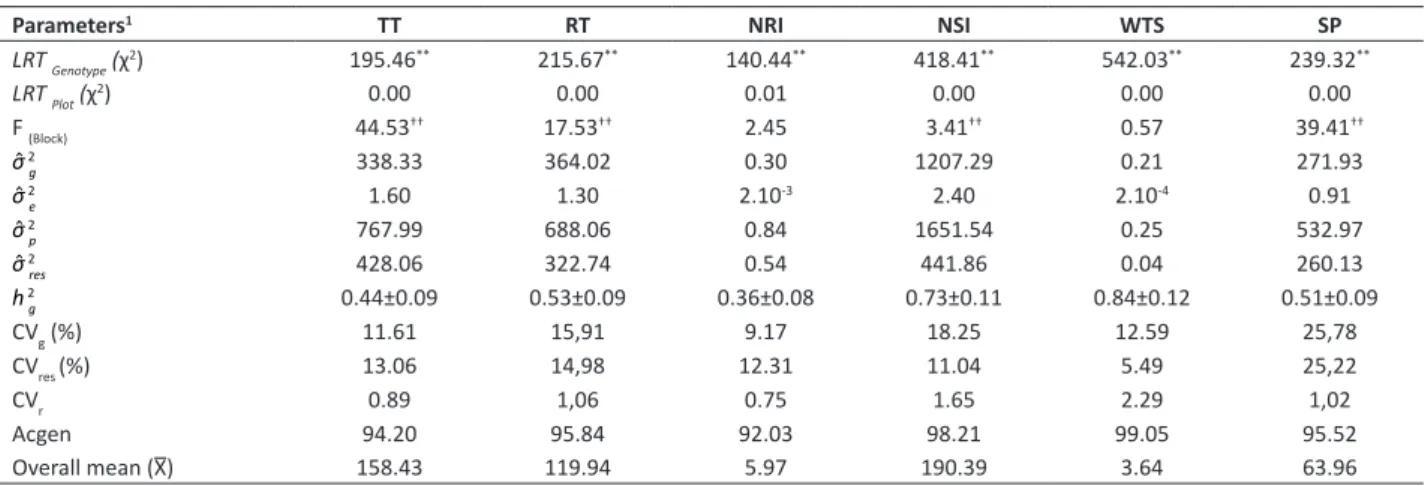
Table 1. Values of verisimilitude (LRT) of deviance analysis (ANADEV) and estimates of genetic parameters (individual REML) for total tillers (TT, in number plant-1), reproductive tillers (RT, in number plant-1), number of racemes per inflorescence (NRI, in number inflorescence-1), number of seeds per inflorescence (NSI, in number inflorescence-1), weight of a thousand seeds (WTS, in g) and seed production (SP, in g plant-1) for interspecific hybrids of Paspalum
Parameters1 TT RT NRI NSI WTS SP
LRT Genotype (χ2) 195.46** 215.67** 140.44** 418.41** 542.03** 239.32**
LRT Plot (χ
2) 0.00 0.00 0.01 0.00 0.00 0.00
F (Block) 44.53†† 17.53†† 2.45 3.41†† 0.57 39.41††
σ̂ 2
g 338.33 364.02 0.30 1207.29 0.21 271.93
σ̂ 2
e 1.60 1.30 2.10
-3 2.40 2.10-4 0.91
σ̂ 2
p 767.99 688.06 0.84 1651.54 0.25 532.97
σ̂ 2
res 428.06 322.74 0.54 441.86 0.04 260.13
h 2g 0.44±0.09 0.53±0.09 0.36±0.08 0.73±0.11 0.84±0.12 0.51±0.09
CVg (%) 11.61 15,91 9.17 18.25 12.59 25,78
CVres (%) 13.06 14,98 12.31 11.04 5.49 25,22
CVr 0.89 1,06 0.75 1.65 2.29 1,02
Acgen 94.20 95.84 92.03 98.21 99.05 95.52
Overall mean (X̅) 158.43 119.94 5.97 190.39 3.64 63.96
1 Description of genetic parameters: genotypic variance (σ̂ 2
g), permanent environment variance (σ̂ 2e), phenotypic variance (σ̂ 2
p), residual variance (σ̂ 2
res), individual heritability
in the broad sense (h 2
g), genetic variation coefficient (CVg), residual variation coefficient (CVres), relative variation coefficient (CVr), genetic accuracy in genotype selection
(Acgen), overall mean (X̅). **Significant at the likelihood ratio test (LRT, 1%= 6.63), considering one degree freedom by the χ2 test. †† Significant at 1% of probability, by the
the traits, suggesting that environmental factors had a small effect on heritability. However, effectiveness of selection depends not only on heritability but also on genetic advance (Pereira et al. 2017). High coefficient of genetic variation together with high heritability provide more information than other parameters alone (Shabanimofrad et al. 2013).
The coefficient of genetic variation (CVg) diverged between the evaluated genotypes, with the highest value regarding the SP trait, followed by NSI and RT (Table 1). According to Oliveira et al. (2015), values above 10.00 allow the breeder a better understanding of the genetic variability and, consequently, of the advances that can be obtained through the selection of a certain traits. Because it is directly proportional to the genetic variance, it allows an information of the relative magnitude of the changes that can be acquired through selection during an improvement program, since the larger the value of the CVg estimate, the greater the probability of releasing genetic variability (Falconer 1987).
In general, the residual coefficients of variation (CVres) showed medium to low magnitude for traits, indicating an acceptable environmental control and satisfactory accuracy of the genetic parameter estimates (Table 1). Since it is a
Table 2. Predicted genotypic effect (g), genotypic value (u+g), genetic gains (gain) and new average (X̅new) for number of total tillers (TT), reproductive tillers (RT), number of racemes per inflorescence (NRI), number of seeds per inflorescence (NSI), weight of a thousand seeds (WTS) and seed production (SP) for interspecific hybrids of Paspalum
TT (number plant-1) RT (number plant-1)
Order Genotype g u+g gain X̅new Order Genotype g u+g gain X̅new
1 10E5052 33.5 192.0 33.5 192 1 10E5052 28.4 148.4 28.5 148
2 10E50150 25.8 184.2 29.7 188 2 10E40104 27.0 147.0 27.7 148
3 10E40104 21.6 180.0 27.0 185 3 10E4025 18.5 138.5 24.7 145
4 10E6047 18.3 176.8 24.8 183 4 10E5017 17.4 137.3 22.8 143
5 10E608 16.9 175.4 23.2 182 5 10E507 14.0 134.0 21.1 141
6 10E5017 15.7 174.0 22.0 180 6 10E6047 12.4 132.4 19.6 140
7 10E4026 15.6 174.0 21.1 180 7 10E402 10.2 130.1 18.3 138
8 10E6086 8.8 167.2 19.5 178 8 10E5023 10.0 129.9 17.3 137
9 10E507 8.6 166.1 18.3 177 9 10E6088 8.1 128.0 16.2 136
10 10E4025 1.6 160.1 16.6 175 10 10E6069 6.6 126.5 15.3 135
NRI (number inflorescence-1) NSI (number inflorescence-1)
Order Genotype g u+g gain X̅new Order Genotype g u+g gain X̅new
1 10E4026 1.3 7.3 1.3 7.3 1 10E5052 96.0 286.4 96.0 286
2 10E4039 0.9 6.9 1.1 7.1 2 10E4071 55.9 256.3 76.0 266
3 10E6088 0.6 6.6 0.9 6.9 3 10E4026 53.2 243.6 68.4 259
4 10E6058 0.6 6.6 0.9 6.8 4 10E6024 46.1 236.5 62.8 253
5 10E6024 0.3 6.3 0.8 6.7 5 10E507 14.4 204.8 53.1 244
6 10E6047 0.3 6.2 0.7 6.6 6 10E6086 12.7 203.1 46.4 237
7 10E4076 0.2 6.2 0.6 6.6 7 10E4099 4.1 194.5 40.4 231
8 10E4077 0.2 6.2 0.6 6.6 8 10E40104 3.3 193.7 35.7 226
9 10E507 0.2 6.1 0.5 6.5 9 10E4025 1.3 191.7 31.9 222
10 10E50150 0.1 6.0 0.5 6.4 10 10E4076 -1.4 189.0 28.6 219
WTS (g) SP (g plant-1)
Order Genotype g u+g gain X̅new Order Genotype g u+g gain X̅new
1 10E4077 1.0 4.7 1.0 4.7 1 10E4071 28.3 92.3 28.3 92
2 10E40177 0.8 4.5 0.9 4.6 2 10E5052 24.9 88.8 26.6 91
3 10E6088 0.7 4.3 0.8 4.5 3 10E4026 21.9 85.8 25.0 89
4 10E6084 0.4 4.1 0.7 4.4 4 10E507 18.6 82.6 23.4 87
5 10E507 0.3 3.9 0.6 4.3 5 10E4025 17.9 81.9 22.3 86
6 10E40104 0.3 3.9 0.6 4.2 6 10E6086 12.1 76.1 20.6 85
7 10E5017 0.1 3.8 0.5 4.2 7 10E40104 10.6 74.5 19.2 83
8 10E4025 0.1 3.7 0.5 4.1 8 10E5017 6.4 70.4 17.6 82
9 10E6047 0.1 3.7 0.4 4.1 9 10E4077 6.0 69.9 16.3 80
question of productivity, a trait strongly influenced by the environment, the SP showed higher value of CVres, because it is results from the performance of all other traits (seed production components) (Nakagawa 2014), accumulating the measurement errors. However, the result of the statistics in this study, are within acceptable limits for agricultural experimentation, providing safety and consistency for this type of data (Pimentel-Gomes 2009).
Another important parameter in defining the best breeding strategy for each trait is the relative variation coefficient (CVr), or variation rate, since this represents the ratio between the CVg and CVres. Therefore, it is not influenced by the trait mean. According to Resende and Duarte (2007), when this rate is close to or greater than 1.0, there is a very favorable situation to obtain gains in the selection of a certain characteristic. Based on this parameter, the relative variation coefficient values, with the exception of the TT and NRI traits, presented a genetic component (CVg) approximate or greater than the residual componente (CVres). The values obtained in this study are in agreement with what was expected in situations of reduced experimental errors, which maximize accuracy.
In the genotypic evaluation context, the parameter known as accuracy (Acgen) refers to the correlation between the true genotypic value of the genetic material and the estimated or predicted value, based on the field experiment information, and also on the efficacy of the inference regarding the genotypic value of the hybrid or its value for cultivation and use (VCU) (Resende and Duarte 2007). In this study, the accuracy values varied between 92.03% and 99.05%, classified as very high, providing evidence that the selection based on the traits under consideration will be safe. According to Resende and Duarte (2007), accuracies above 0.70 are sufficient for a breeding program, but when the objective is to evaluate the VCU, the precision must be greater than 0.90.
When analyzing the effect of treatments, taking them as random, tests of multiple comparisons between averages should not be used, since these tests are derived from an assumption of fixed effects of treatments, and also because they produce inferences about phenotypic averages and not genotypic averages (Resende 2007). The use of more refined analytical procedures, such as the use of mixed linear models, allows a decreasing ordering of genotypes according to their genetic values, corrected and penalized for the occurrence of environmental effects (Duarte and Vencovsky 2001).
Out of the twenty-three genotypes assessed, the best ten for the traits TT, RT, NRI, NSI, WTS and SP were selected through the BLUP methodology and account for 43.5% of the evaluated germplasm (Table 2). Genetic gains were predicted, and the new estimated averages were higher than the overall average for all traits.
The selection based on the genetic value for the TT trait revealed that genotype 10E5052 had the best performance, with genetic gains, which varied between 16.6 and 33.5 tillers per plant (Table 2), raising the new average by 21.2%. It has been observed that many of the same previously selected genotypes were found to also appear in the ordering of the RT trait, especially genotypes 10E5052 and 10E40104. The genetic gain in this trait varied from 15.3 to 28.5 reproductive tillers per plant, raising the new average by 23.7%. Monteiro et al. (2016), selecting interspecific hybrids of B. decumbens, obtained gains with the selection of 73, 114 and 174% (30, 20 and 10% intensity, respectively) with high heritability amounts (0.88) in the RT trait, which may be a parameter to predict the seed production potential in forage species. In another context, Pereira et al. (2017), evaluating the genetic gain for forage traits in apomictic species of the genus Paspalum, low genetic variance and heritability (0.24) was observed for the number of tillers (TT), indicating
difficulty in obtaining a genetic gain in the evaluated populations. A strategy to increase the expression of these traits is the recombination of a sexual parent in the formation of new individuals, increasing the number of heterozygous alleles, maximizing the benefits of hybrid vigor, generating greater stability to phenotypic expression.
For NRI, gains above 7.7% can be obtained with the selection of the ten best genotypes, of which only one (10E4026) is coincident in the other evaluated traits (Table 2). Genetic gains ranged from 0.5 to 1.3 racemes per inflorescence (21.9%) for this trait. According to Lopes et al. (2017), the expression of the variability of the NRI trait was equal in two years of evaluations, emphasizing the same genotype of this study (10E4026). It is worth noting that the P. plicatulum species (female genitor) presents 3-7 racemes per inflorescence and the P. lepton species (male genitor) presents 2-5 racemes per inflorescence (Wunderlin et al. 2017), probably contributing to the variability of this trait after hybridization.
(10E507, 10E40104 e 10E4025). With better performance, genotype 10E4077 was promising in relation to the genetic gains, which varied from 0.4 to 1.0 g 1000 seeds-1 (10.4 to 28.3%, respectively) for the trait. Both traits presented the
highest estimates of individual heritability in the broad sense (0.73 e 0.84, respectivamente) (Table 1), and it should be noted that heritability directly participates in the prediction of genetic gain, regardless of the selection method, and consequently, in decision making during the breeding process (Ramalho et al. 2012).
Genotype 10E5052 stood out in the TT, RT and NSI traits; however, it did not show the same performance in the NRI and WTS traits (Table 2). This fact is explained by the proportional behavior between the traits for seed production, in other words, the increment of one trait leads to the decrease of the other, in view of the plasticity or compensatory capacity of the plant (Nakagawa 2014).
Of course, this order was carried out taking into account the purpose of the program in increasing the expression of the SP trait. The genetic gain, in this trait, varied from 14.8 to 28.3 g seeds-1 (23.2 and 44.3%, respectively) (Table 2). The
genotype 10E4071 presented the best performance (highlighted only in WTS and SP) followed by genotype 10E5052 (higher expression in TT, RT and NSI, second in SP), where these two were the only ones to raise the new average above 40.0% for seed production.
According to the literature, the main components of the production of Paspalum seeds are the TT, RT, NSI and WTS
traits (Lopes and Franke 2011, Lopes et al. 2016, Lopes et al. 2017). The use of these traits favors the choice of superior performance genotypes, through indirect selection in traits of difficult selection and measurement, such as seed production. The structural characteristics of the plant, theoretically the number of tillers that pass to the reproductive stage, can be used to predict the production of seeds before the beginning of flowering.
Thus, the elaboration of a comprehensive record of these traits is not only scientifically interesting, but also an important contribution in guiding the breeding program in forage plants, acting as a facilitator of the selection process.
CONCLUSIONS
The evaluated genotypes presented potential for improvement in view of the high genetic variability, high heritability, and high accuracy for the seed production traits. The hybrids 10E5052, 10E4026, 10E507, 10E4025 and 10E40104 are among the top ten because they have high genetic values in three or more traits, indicating that these genotypes should be recommended for direct use in planting or potential parents to be used in new crosses.
ACKNOWLEDGEMENTS
This work was supported by CAPES (process 007488/2011-35). We thank Dr. Marcos D.V. de Resende (Embrapa Florestas) and Me. Andrei Caíque Nunes (UFV) for offering us the knowledge with the Software SELEGEN-REML/BLUP.
REFERENCES
Aguilera PM, Sartor ME, Galdeano F, Espinoza F and Quarin CL (2011) Interspecific tetraploid hybrids between two forage grass species: sexual Paspalum plicatulum and apomictic P. guenoarum. Crop Science 51: 1544-1550.
Biligetu B, Schellenberg MP, Mcleod JG and Wang Z (2012) Seed yield variation in plains rough fescue (Festuca hallii (Vasey) Piper) populations and its relation with phenotypic characteristics and environmental factors. Grass and Forage Science 68: 589-595.
Brasil (2009) Ministério da Agricultura, Pecuária e Abastecimento: Regras para análise de sementes. MAPA/ACS, Brasília, 399p.
CQFS-RS/SC - Comissão de Química e Fertilidade do Solo RS/SC (2016)
Manual de adubação e de calagem para os estados do Rio Grande
do Sul e Santa Catarina. 11th edn, Núcleo Regional Sul da Sociedade
Brasileira de Ciência do Solo, Porto Alegre, 376p.
Duarte JB and Vencovsky R (2001) Estimação e predição por modelo linear misto com ênfase na ordenação de médias de tratamentos genéticos.
Scientia Agricola 58: 109-117.
Falconer DS (1987) Introdução à genética quantitativa. UFV, Viçosa, 198p. Lopes RR and Franke LB (2011) Produção de sementes de quatro ecótipos de Paspalum nativos do Rio Grande do Sul. Revista Brasileira de Zootecnia 40: 20-30.
Lopes RR, Ost HJ, Souza CHL and Franke LB (2016) Management of consecutive cuts in the production and quality of wintergreen paspalum seeds. Revista Brasileira Zootecnia 45: 587-595.
Lopes RR, Souza CHL, Pereira EA, Gasparetto BF, Dall’Agnol M and Franke LB (2017) Genetic variability of the components of seed yield in interspecific hybrids of Paspalum. Revista Brasileira Zootecnia 46:
This is an Open Access article distributed under the terms of the Creative Commons Attribution License, which permits unrestricted use, distribution, and reproduction in any medium, provided the original work is properly cited.
Lynch M and Walsh B (1998) Genetics and analysis of quantitative traits. Sinauer Associates, Sunderland, 970p.
Monteiro LC, Verzignassi JR, Barrios SCL, Valle CB, Fernandes CD, Benteo GL and Libório CB (2016) Characterization and selection of interspecific hybrids of Brachiaria decumbens for seed production in Campo Grande - MS. Crop Breeding and Applied Biotechnology 16: 174-181.
Nakagawa J (2014) Os componentes da produtividade de sementes.
Informativo Abrates 24: 15-21.
Oliveira NS, Carvalho Filho JLS, Silva DO, Pastoriza RJG, Melo RA, Silva JW and Menezes D (2015) Seleção e parâmetros genéticos de progênies de coentro tolerantes ao calor. Horticultura Brasileira 33: 319-323. Pereira EA, Barros T, Volkmann GK, Battisti GK, Silva JAG, Simioni C and
Dall’agnol M (2012) Variabilidade genética de caracteres forrageiros em Paspalum. Pesquisa Agropecuária Brasileira 47: 1533-1540.
Pereira EA, Dall’agnol M, Nabinger C, Hubber KGC, Montardo DP and Genro TCM (2011) Produção agronômica de uma coleção de acessos de Paspalum nicorae. Revista Brasileira de Zootecnia 40: 498-508.
Pereira EA, Dall’Agnol M, Saraiva KM, Simioni C, Leães APS and Silva JAG (2017) Genetic gain in apomictic species of the genus Paspalum.
Revista Ceres 64: 60-67.
Pimentel-Gomes F (2009) Curso de Estatística Experimental. Fealq, Piracicaba, 451p.
Ramalho MAP, Abreu AFB, Santos JB and Nunes JAR (2012) Aplicações
da genética quantitativa no melhoramento de plantas autógamas.
UFLA, Lavras, 522p.
Resende MDV (2002) Genética, biométrica e estatística: no melhoramento
de plantas perenes. Embrapa Informação Tecnológica, Brasília, 975p.
Resende MDV (2007) Software SELEGEN-REML/BLUP: sistema estatístico
e seleção genética computadorizada via modelos lineares mistos.
Embrapa Florestas, Colombo, 359p.
Resende MDV (2016) Software SELEGEN-REML/BLUP: a useful tool for plant breeding. Crop Breeding and Applied Biotechnology 16:
330-339.
Resende MDV and Duarte JB (2007) Precisão e controle de qualidade em experimentos de avaliação de cultivares. Pesquisa Agropecuária Tropical 27: 182-194.
Santos HG, Almeida JA, Oliveira JB, Lumbreras JF, Anjos LHC, Coelho MR, Jacomine PKT, Cunha TJF and Oliveira VA (2013) Sistema brasileiro
de classificação de solos. 3rd edn, Empresa Brasileira de Pesquisa
Agropecuária, CNPS, Rio de Janeiro, 353p.
Sartor ME, Quarin CL and Espinoza F (2009) Mode of reproduction of colchicine-induced Paspalum plicatulum tetraploids. Crop Science 49: 1270-1276.
Sartor ME, Quarin CL, Urbani MH and Espinoza F (2011) Ploidy levels and reproductive behaviour in natural populations of five Paspalum species. Plant Systematics and Evolution 293: 31-41.
Savidan YH, Jank L, Costa JCG and Valle CB (1989) Breeding Panicum maximum in Brazil - I: genetic resources, modes of reproduction and breeding procedures. Euphytica 41: 107-112.
Şeker H, Yazici A and Uysal P (2014) Analysis of variability, heritability, and genetic advance in seed yield and related traits of orchardgrass
(Dactylis glomerata L.) populations. Turkish Journal of Agriculture
and Forestry 38: 633-643.
Shabanimofrad M, Rafii MY, Megat Wahab PE, Biabani AR, and Latif MA (2013) Phenotypic, genotypic and genetic divergence found in 48 newly collected Malaysian accessions of Jatropha curcas L. Industrial Crops and Products 42: 543-551.