Contents lists available atScienceDirect
Computers in Biology and Medicine
journal homepage:w w w . e l s e v i e r . c o m / l o c a t e / c b m
New developmental stages for common marmosets (
Callithrix jacchus
) using mass and
age variables obtained by K-means algorithm and self-organizing maps (SOM)
Adriano de Castro Leão
a, Adrião Duarte Dória Neto
b, Maria Bernardete Cordeiro de Sousa
a,∗
aLaboratório de Endocrinologia Comportamental, Universidade Federal do Rio Grande do Norte, Natal, RN, BrazilbLaboratório de Ciências da Computação, Universidade Federal do Rio Grande do Norte, Natal, RN, Brazil
A R T I C L E I N F O A B S T R A C T
Article history:
Received 17 May 2007 Accepted 15 May 2009
Keywords:
Classification Weight Age Data mining Common marmosets Ontogeny
This study proposes new developmental stages forCallithrix jacchus, using K-Means algorithm and an arti-ficial neural network–self-organising maps (SOM) as computational tools, based on weight and age. Eight developmental stages are proposed: Infant I, II and III, Juvenile I and II, Sub adult, Young adult and Older adult. This classification is consistent with the first appearance of several behavioural and physiological characteristics and thus may have generality in defining critical developmental periods. It also reveals differences in male and female development and establishes a stage for the onset of the final adult life cycle. This classification is also important to understanding the biology of the ontogenetic development of common marmosets, providing new insights for the management and care of captive animals and improv-ing age estimate indicators when specimens are captured in long term monitorimprov-ing of free rangimprov-ing groups. © 2009 Elsevier Ltd. All rights reserved.
1. Introduction
Biomedical research using the common marmoset (Callithrix jac-chus) continues to grow, mainly in infectious diseases, neuroscience and development, toxicology and drug development, reproductive biology and behavior[19]. The life span of this species is around 11.7 years (Rowe, 1996). A strong preventive medicine health care pro-gram and diagnostic services are critical to maintaining a healthy, robust colony[18]. The use of common marmosets in biomedical re-search started in the early sixties and information about free-ranging groups began to appear in the early seventies. One of the first studies focusing on the ecology and behavior of genusCallithrix[23]using behavioral data identified six developmental months), Adolescent (6–10 months), Sub adult (11–15 months), and Young adult (
>
15 months). Another classification was proposed by Yamamoto [27]based on behavioral data and age, as follows: Infant (0–5 months), Juvenile (5–10 months), Sub adult (10–15 months) and Young adult (
>
15 months). In a study where the weights of captive and wild common marmosets were compared at the different age ranges pro-posed by Yamamoto [27], Araújo et al. [3]found that the profile of both groups increases similarly with no statistical differences∗Corresponding author at: Universidade Federal do Rio Grande Departamento de Fisiologia Caixa Postal, 1511 59078-970 Natal, RN, Brazil. Tel.: +55 84 215 3410; fax: +55 84 211 9206.
E-mail addresses:[email protected],[email protected]
(M.B.C. Bernardete Cordeiro de Sousa).
0010-4825/$ - see front matter©2009 Elsevier Ltd. All rights reserved. doi:10.1016/j.compbiomed.2009.05.009
between age ranges. Recently, Abbott et al. [2], describing some aspects of common marmoset developmental biology, considered the infant stage as ranging from 0 to 3 months, Juvenile from 3 to 12 months, Sub adult from 13 to 18 months and Adult over 18 months.
2 INF2 97.88±26.12 67±20 M=264; F=272
3 INF3 165.38±20.40 118±19 M=319; F=356
1 JUV1 197.68±35.60 190±27 M=391; F=424
2 JUV2 255.43±33.78 259±26 M=153; F=144
1 SAD1 259.54±42.89 343±26 M=150; F=142
2 SAD2 307.97±40.31 408±28 M=343; F=373
1 ADU1 311.00±44.40 829±300 M=1741; F=1523
2 ADU2 374.63±45.03 1534±582 M=1078; F=1058
Fig. 1.Database split into four datasets using the age stages proposed by Yamamoto[26].
computational approaches: K-means algorithm and an artificial neu-ral network–self-organizing maps (SOM).
2. Methods
2.1. Subjects
We used a database with 9,200 weight entries recorded across the ontogenetic development ofC. jacchusfrom 1985 to 2003 (see
Table 1), all data used in this study came from a born captive
mea-surements of weight and age. During this time the number of en-tries over 4-year periods were: 1985–1988:n=991; 1989–1992: n=4, 097; 1993–1996:n=1919; 1997–2000:n=1931 and, in the last three years, 2001=200, 2002=28 and 2003=34. The animals were housed in outdoor cages, at the Núcleo de Primatologia of the Universidade Federal do Rio Grande do Norte (5◦50′S 35◦12′W).
The database was built in templates using ACCESS MS
姠
andimported to JMP statistical software, version 5.0.1a—Copyright
䉷
1989–2002 SAS Institute Inc. All statistical tests, K-means and self-organizing maps were used in the JMP routines. We excluded 761 records related to two situations: (1) when the weight of pregnant females reached 410 g, which corresponds to mean weight plus stan-dard deviation values obtained for the males of the colony; (2) the weight of males and females who experienced chronic weight loss and the weight of dying animals. In this study we used the age in days proposed by Yamamoto[27], as follows: Infant class: 0–150 days; Ju-venile: 151 to 300 days; Sub adult: 301–600 and Adult:>
600 days.2.2. Computational techniques
Clustering is one technique that falls into a group of undirected data mining tools. The goal of undirected data mining is to discover structure in the data as a whole. There is no target variable to be predicted, thus no distinction is made between independent and de-pendent variables. Both K-means algorithm and self-organizing maps
[16]are clustering methods that classify patterns without the need of previous information on data distribution, as occurs in supervised methods. These techniques allow a data mining process that identi-fies stages and sub-stages of the data distribution being used. Thus, these tools are better for modeling and identifying stages in a sample pool and they enable us to visualize data distribution in a two di-mensional space, even when the data form high didi-mensional spaces, i.e. when the input vector is high. These techniques are effective an-alytical tools for extracting information from a large dataset, such as that used in this study, and are more suitable than traditional sta-tistical methods (such as regression) for detecting multivariate data patterns.
2.3. Data mining
The aim of data mining is to extract non-explicit information, that is, patterns that may be labelled as a database class[10,13] Cluster-identifying techniques are useful tools for Cluster-identifying and classifying patterns immersed in a mass of data.
Two techniques were used in this study: the K-means algorithm
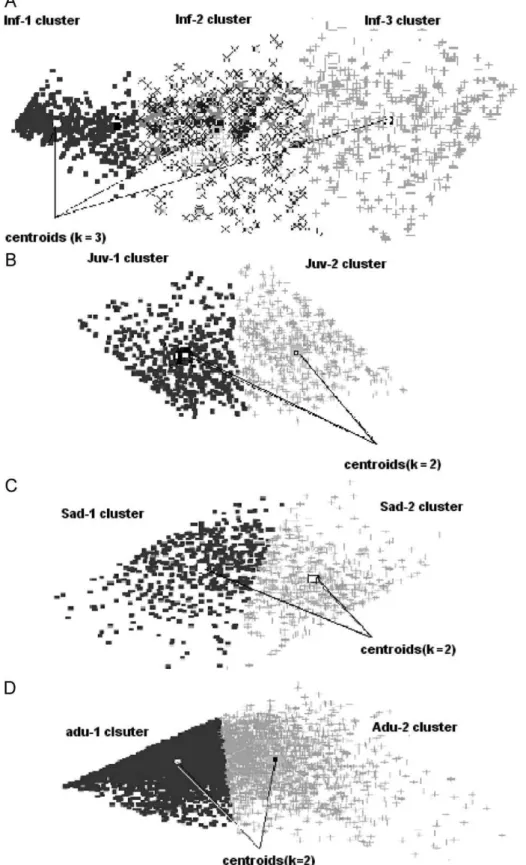
Fig. 2.Classification map calculated for Infantile (A), Juvenile (B), Sub adult (C) and Adult (D) classes showing the clusters and their respectivecentroids(k) for each class. In both distributions, K-means and SOM converged in a similar way.
were chosen in order to approach the problem in two ways and verify if the methods converge to a same solution. Both algorithms (K-means and SOM) are able to accurately find the clusters.
The K-means method introduced by Duda et al.[7] is one of the simplest and most efficient cluster techniques, consisting of a
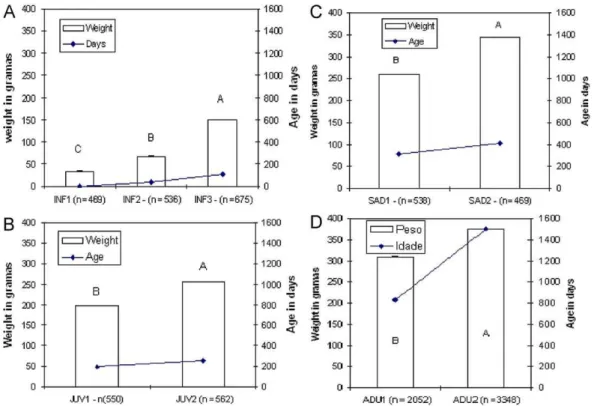
Fig. 3.Developmental stages found using weight and age variables by K-means and SOM analysis for common marmosets, based on classification proposed by Yamamoto
[26]. Bars indicate weight, and the line indicates the age of the individuals. (1A) Three sub-stages were found for the infant stage; (1B) two sub-stages were found for the juvenile stage; (1C) two sub-stages were also found for the sub adult stage and (1D) one stage was found for adult. In all cases, differences between sub-stages were significant using Student'st-test (a,b) or ANOVA (a,b,c,),p<0.001 for both.
able to move towards the pattern (a point in the data space). The process is concluded when each mobile center reaches a position at the center of a cluster. Once the clusters are identified, the labeling process is carried out and the patterns are classified. The process can be seen as a winner-take-all competitive process, which may be implemented as a competitive neural network.
The self-organizing map algorithm is an unsupervised neural net-work developed by Kohonen[16]. This neural network is usually a uni- or bi-dimensional lattice. These neurons receive the input data and compete according to the measure of the distance between their synaptic weights and the input patterns. The weight vector closest to the input vector is chosen as the winning neuron. Each winning neuron establishes a cooperative and selective process with neigh-bouring neurons to form neuron clusters. The process continues un-til neuron distribution in the grid is self-organized. At the end of the process the neuron clusters that reflect the same unknown organi-zation of the input data or input network patterns are identified. From these clusters it is possible to label and classify the patterns.
2.4. Choice of the right number of clusters
If the number of clusterskin the K-means method is not chosen to match the natural structure of the data, the results cannot be accurate. In this study, the proper way to avoid this is to experiment with different values fork. In principle, the suitablekvalue will have the shortest intra-cluster (the distance between two inputs of same cluster) and longest inter-cluster distances (the distance between two inputs of different clusters). Once the clusters are discovered, they have to be interpreted in order to have some value for the data-mining project[13].
To perform this option we develop a heuristic based on the knowl-edge of the intrinsic characteristics of the problem and the number
of clusters chosen matches the biological interpretation of the data. First we test each group, usingkvalues between 2 and 6, and the statistical separation for each. The suitablekvalue that shows the highest statistical separation is chosen.
3. Results
In this study we observed for a same database that the K-means algorithm and the SOM algorithm converged to a same result, en-abling the process of classification by age and weight, thus meeting the objective of this study.
Using the number of age stages proposed by Yamamoto[27], we divided our databank into 4 classes by K-means, as shown inFig. 1. Additionally, the dataset was split using the Yamamoto classification. Within each class, separately, we performed new data mining using the K-means and SOM algorithm.
For the infant group a different number ofkvalues (k=number of possible clusters) was used to find the suitable classification. K-means classification and SOM produced the results that matched biological observations for the infant group (k=3), since the cen-troids(which equal the mean of each cluster), showed three classes, INF1, INF2 and INF3 (INF=cluster—seeTable 1,Fig. 2A) the same mean values forweightandagewere found for the centroids in both K-means and SOM classifications. When a statistical analysis of bivariate distribution routine was used (age and weight) a strong correlation was found between the two variables (weight and age-Pearson,r=0.937,p
<
0.001).The same computational approaches were used to test if dif-ferent knumbers (clusters parameters) were present in the other age ranges: juvenile, sub adult and young adult. In all the three age stages, two sub-classes were found as follows: JUV1 and JUV2
(Fig. 2B), SUB1 and SUB2 (Fig. 2C) and ADU1 and ADU2 (Fig. 2D),
Table 2
New proposed classification for ontogenetic development ofC. jacchus, and first main behavioural manifestation or cessation during ontogenetic development.
New stages Weight (g) Age (days) Age range in months
Behavioural correlates (first manifestation)
Infantile I 40.07+11.79 13+13 0–1 Off episodes; scent marking
Infantile II 97.88+26.12 67+20 1–3 Vocalisation; piloerection-wrestling play with “open mouth face”; independent locomotion; solid ingestion; self feeding
Infantile III 165.38+20.40 118+19 3–4 Social play; complete weaning
Juvenile I 197.68+35.60 190+27 4–7 Onset of puberty in females; social grooming Juvenile II
(adolescent)
255.43+33.78 259+26 7–10 Onset of puberty in males
Sub adult 307.97+40.31 408+28 10–15 Ovulation; copulation Young adult 374.63+45.03 1534+532 15–72 Reproduction
Older adult 352.77+46,61 2116 >72 Hearing loss; cartilage aging; aging
Behavioural information was obtained from Ingram[12], Abbott[1], Yamamoto[27], Ximenes & Sousa[26], Hearn[14], Tardif and Jaquist[22]and Abbott et al.[2].
Fig. 4.Weight prediction curve (WPC) for the ontogenetic development ofC. jacchususing weight and age calculated by SOM and K-means analyses.
variablesweightandageshowed the same increase pattern, but the correlation found using a bivariate statistical test, showed a weak correlation betweenweightandagefor both classes (Pearson, Juve-nile:r=0.466,p
<
0.05; Sub adult:r=0.219,p<
0.05). Weight was highest in the adult stage, and continued to vary with a standard deviation of ±40 g, while age increased steadily until the animal died. The correlation between weight and age using statistical bi-variate distribution was weak (Pearson,r=0.152,p<
0.05) for the adult classification, as illustrated inFig. 3.Table 1shows the class transitions. In spite of what was found,
statistical differences in all classes showed that the JUV2 stage mean (255.43 g) was very similar to that of the SAD1 stage (259.54), as were those between the SAD2 (307.97 g) and ADU1 stages (311.00 g). Since no statistical differences were found between SAD1 and ADU1, they were disregarded, leaving only one class for both stages. The final classification results using SOM and K-means analysis, with eight developmental stages and their range in months, are shown in
Table 2, as well as the behavioral correlates of these stages obtained
from the literature. Using the proposed classification, a prediction
weight curve (PWC) was calculated (Fig. 4), where maximum weight is plotted between the SAD and ADU stages. The PWC corresponds to the weight gain of the animal during ontogenetic development. It was obtained from regression using both weightxage variables. As can be observed, there is a very rapid weight increase in the first 7 months of development, reaching about 75% of adult weight when the individual is in the JUV2 stage. During the adult stage, weight stabilization occurs, with a slight decrease at around four years of age. The older adult stage starts at 72 months.
4. Discussion
ters and knee-to-heel length of long bones, which are also used for ontogenetic classifications[12], will be revised based on these com-putational tools. According to the present findings, it is proposed that inC. jacchus the conventional infant stage should be divided into three sub-stages: Infant 1: 0–30 days of age (1st month), with mean weight of 40 g (SD±11.79 g); Infant II: age greater than 30 and less than 90 days (2nd–3rd months), with mean weight of 98 g (SD±26 g) and Infant III: age greater than 90 and less than 120 days (4th month), with mean weight of 165 g (SD±20 g). The juve-nile stage can be divided into two sub-stages: Juvejuve-nile I: age from 120 to 210 days (5th–7th month), with mean weight of 197.68 g (SD±36 g) and Juvenile II: age between 210 and 300 days (7th–10th month), mean weight of 255.43 g (SD±34 g). The sub adult stage is from day 300 to 450 (11th–15th month), mean weight of 307.97 g (SD±11.79 g). The adult stage begins at 450 days (16th month) and extends up to 2116 days (around 6 years), with mean weight of 374 g (SD±11.79 g). The older adult stage begins at 6 years and ends at death.
This new ontogenetic classification for the common marmoset includes eight stages, based on increased age and weight during the animal's development. It should be pointed out that the classification proposed is similar to others, such as that of Yamamoto[27], since both establish the end of the juvenile and sub adult phases at 10 and 15 months of age, respectively.
Behavioral patterns associated with the development ofC. jac-chusare found in various publications ([1,2,5,14,23,25,26,27]among others). According to these studies, behaviors related to carrying, nursing, feeding, play and agonism appear for the first time during the infant stage. According to the revised developmental classifica-tion proposed in the present study, in which the infant stage has three sub-stages, the first episodes of piloerection coincide with the onset of the infant II stage, and weaning is completed in the tran-sition between the Infant II and Infant III stages[24]. Furthermore, females show increased estradiol during the Juvenile I stage, while the males present increased testicular size and elevated testosterone levels in Juvenile II stage[2]. These results, therefore, allow defini-tion of a more precise and funcdefini-tional developmental scale, since the onset and end of these activities were not clearly associated with any developmental indicators using the conventional scale. For example, the complete weaning that occurs around the 14th week [12,26], approximately five weeks before the end of the infant stage in Yamamoto's[27]classification, now coincides with the end of the Infant III stage. The statistical differences found in the infant and ju-venile stages are explained by the pronounced weight gain of around 75% between the first and tenth months of life when compared to the weight of an adult animal.
Similar results had already been reported forSaguinus fusciollis
[15]. On the other hand, in the sub adult and adult stages, only the final increase to adult weight was observed, with a mean variation of ±40 g until the end of the animal's life. In a study by Abbott[1]on physical, hormonal and behavioural development ofC. jacchus, based on the weight profile of 20 males and 20 females born in captivity, an ascending progression can be observed in weight gain. This coincides with our infant stage period and, to a lesser degree, the Juvenile I and II stages of the present classification. According to Abbott, the captive animals gained the same weight as the wild animals present in the colony (300±6.6 g) at between 500 and 550 days of development (16 to 18 months), which corresponds to the adult stage.
According to Tardif et al.[25]the average lifespan of aC. jacchus that survives infancy is approximately 6 years and the maximum
beginning of aging.
Through the stages found in this study, results show that a pre-diction weight curve (PWC) can be created and successfully used. The use of PWC could be of great value in following the ontoge-netic development ofC. jacchusand in selecting subjects for chronic experiments with greater certainty, since weight profile could indi-cate a tendency for developing Wasting Marmoset Syndrome (WMS), which is a significant cause of death in captive callithrichids[11]. An-imals with the potential for developing WMS generally have weights below the curve, beginning in the juvenile stage. PWC could also be used to classify the age of animals in field studies, in addition to morphometric measures already being used.
5. Summary
Conflict of interest statement
None declared.
Acknowledgments
We would like to thank Antonio B. Silva, Geniberto C. Santos and Ednólia Camara for their help with colony management, and Flavio J.V. Coutinho for veterinary care. We would also like to thank Dr. Allan Medeiros Martins for his helpful comments and constructive criticism. This project was supported by grants from CNPq (Proc. No. 521186/97; 470601/2003-5, 305216/2003 and) to M.B.C. Sousa.
References
[1] D.H. Abbott, The physical, hormonal and behavioural development of the common marmoset,Callithrix jacchus jacchus, in: H. Rothe, H.J. Wolter, J.P. e Hearn (Eds.), Biology and Behavior of Marmosets, Eigenverlag, Gottingen, 1978,¨ pp. 99–106.
[2] D.H. Abbott, D.K. Barnett, R.J. Colman, M.E. Yamamoto, N.J. Shutltz-Darken, Aspects of common marmoset basic biology and life history important for biomedical research, Comp. Med. 53 (2003) 339–350.
[3] A. Araújo, M.F. Arruda, A.I. Alencar, F. Albuquerque, M.C.L. Nascimento, M.E. Yamamoto, Body weight of wild and captive marmosets, Int. J. Primatol. 21 (2000) 317–324.
[4] C. Bessa-Gomes, F. Petrucci-Fonseca, Using artificial neural networks to assess wolf distribution patterns in Portugal, Anim. Conserv. 6 (2003) 221–229. [5] H.O. Box, Quantitative data of the carrying of the young captive monkeys
(Callithrix jacchus) by other members of the family groups, Primates 18 (1977) 475–484.
[6] R. Céréghino, F. Santoul, A. Compin, S. Mastrorillo, Using self-organising maps to investigate spatial patterns of non-native species, Biol. Conserv. 125 (2005) 459–465.
[7] R. Duda, P. Hart, D. Stork, Pattern Classification, second ed., Wiley, New York, 2000.
[8] M. Frize, C.M. Ennett, M. Steveson, H.C.E. Trigg, Clinical decision support systems for intensive care units using artificial neural networks, Med. Eng. Phys. 23 (2001) 217–225.
[9] E.J. Gamito, J. Dayhoff, E.D. Crawford, C. O'Donnell, A. Tewari, A. Errejon, Artificial neural network model to predict extent of tumor in men with clinically localized prostate cancer, in: International Joint Conference on Neural Networks IEEE. Washington, DC, 2001.
[10] V. Guralnik, G. Karypis, in: Workshop on Data Mining in Bioinformatics, 2001, pp. 73–80.
[11] D.M. Ialeggio, A.J. Baker, Results of a preliminary survey into wasting marmoset syndrome in callitrichid collections, in: Proceedings of the First Annual Conference of the Nutrition Advisory Group of the American Zoo and Aquarium Association, 1995, pp. 148–158.
[12] J.C. Ingram, Interactions between parents and infants, and the development of independence in the common marmosets (Callithrix jacchus), Anim. Behavior 25 (1977) 811–827.
[13] J. Han, M. Kamber, Data Mining. Concepts and Techniques, Morgan Kaufmann, New York, 2001.
[14] J.P. Hearn, The common marmoset (Callithrix jacchus), in: J.P. Hearn (Ed.), Reproduction in New World Primates, MTP Press, Lancaster, 1983, pp. 181–215.
[15] R.J. Hoage, Social and physical maturation in captive lion tamarins, Leontopithecus rosalia rosalia (Primates: Callitrichidae), Smithson. Contrib. Zool 354 (1982) 1–56.
[16] T. Kohonen, Self-organised formation of topographically correct feature maps, Biol. Cybern. 43 (1982) 59–69.
[17] P.J.G. Lisboa, A review of evidence of health benefit from artificial neural networks in medical intervention, Neural Networks 15 (2002) 11–39. [18] E. Ludlage, K. Mansfield, Clinical care and diseases of the common marmoset
(Callitrix jacchus), Comp. Med. 3 (2003) 369–382.
[19] K. Mansfield, Marmoset models commonly used in biomedical research, Comp. Med. 53 (2003) 383–392.
[20] K.R.L. Rosenberger, A.L. Kanda, Artificial neural networks and three-dimensional digital morphology: a pilot study, Folia Promatol. 76 (2005) 303–324. [21] C. Salum, S. Morato, A.C. Roque-da-Silva, Anxiety-like behavior in rats: a
computational model, Neural Networks 13 (2000) 21–29.
[22] H. Simon, Redes Neurais: Princípios e Prática, 2aedição, Porto Alegre Bookman, 2001.
[23] M.F. Stevenson, A.B. Rylands, The marmosets, genus Callithrix, in: R.A. Mittermeier, A.B. Rylands, A. Coimbra-Filho, G.A.B. Fonseca (Eds.), Ecology and Behavior of Neotropical Primates, 2, Littera Maciel, Contagem, 1988, pp. 131–222.
[24] S.D. Tardif, C.E. Jaquish, Number of ovulation in the marmoset monkey (Callithrix jacchus): relation to body weight, age and repeatability, Am. J. Primatol. 42 (1997) 323–329.
[25] S.D. Tardif, D.A. Smucny, D.H. Abbott, K. Mansfield, N. Schultz-Darken, M.E. Yamamoto, Reproduction in captive common marmosets (Callithrix jacchus), Comp. Med. 53 (2003) 364–368.
[26] M.F.F.M. Ximenes, M.B.C. Sousa, Family composition and the characteristics of parental care during the nursing phase of common marmosets (Callithrix jacchus), Primates 37 (1996) 175–183.
[27] M.E. Yamamoto, From dependence to sexual maturity: the behavioural ontogeny of Callitrichidae, in: A.B. Rylands (Ed.), Marmosets and Tamarins: Systematics, Behavior and Ecology, Oxford University Press, London, 1993, pp. 235–254. [28] W.J. Walley, M.A. O'Connor, Unsupervised pattern recognition for the
interpretation of ecological data, Ecol. Model. 146 (2001) 219–230.
Adriano de Castro Leãoreceived his M.Sc. and Ph.D. degree in Psychobiology in
the Universidade Federal do Rio Grande do Norte, Brasil in 1990 and and 2000, respectively, Natal, Brazil. He is currently working in the Behavioral Endocrinology group of the Universidade Federal do Rio Grande do Norte, Brazil as Ph.D. student.
Adrião Duarte Dória Netoreceived his M.Sc. and Ph.D. in Electrical Engineering
from the University of Campinas, São Paulo, Brazil in 1982 and Institute National Polytechnique de Toulouse, INPT, France in 1989, respectively. He is currently a Full Professor in the Computational and Automation Engineering in the Universidade Federal do Rio Grande do Norte. His research interests are in Microwave circuits, Neural networks, Numerical methods and Digital signs processing.
Maria Bernardete Cordeiro de Sousa received her M.Sc. and Ph.D. degrees in
![Fig. 1. Database split into four datasets using the age stages proposed by Yamamoto [26] .](https://thumb-eu.123doks.com/thumbv2/123dok_br/15555664.97735/2.892.44.833.121.281/fig-database-split-datasets-using-stages-proposed-yamamoto.webp)