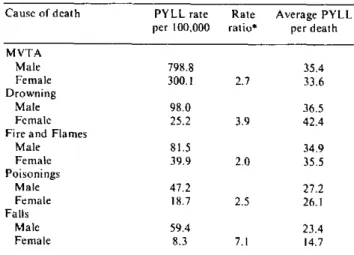
Table 2. PYLL rates per 100,000 population, PYLL rate ratios, and average PYLL per death of the 5 leading causes
of unintentional injury in Canada, by sex, 1985.
Cause of death PYLL rate Rate Average PYLL per 100,000 ratio* per death MVTA
Male 798.8 35.4
Female 300.1 2.7 33.6
Drowning
Male 98.0 36.5
Female 25.2 3.9 42.4
Fire and Flames
Male 81.5 34.9
Female 39.9 2.0 35.5
Poisonings
Male 47.2 27.2
Female 18.7 2.5 26.1
Falis
Male 59.4 23.4
Female 8.3 7.1 14.7
* Male Rate/ Female Rate
injury morbidity and mortality(3). Increased governmental and private support of the activities of the various groups involved in injury prevention should be emphasized.
References
(1) Committee on Trauma Research. Injury' in America.
National Academy Press, Washington, D.C., 1985.
(2) Stickle, G. What Priority Human Life? Am J Public Health
55:1692-8,1965.
(3) Premature Mortality due to Unintentional Injuries -United States, 1983. MMWR 35:353-6,1986.
(Source: Leonard MacWilliam and Louise Fortier. First published in Chronic Diseases in Canada,
Vol. 8, No. 1, June 1987.)
Life Expectancy by Sex, Age, and Income Level
The purpose of this article is to present an updated overview of the variations in life expectancy by income level in Canada. Mortality data for 1984 were retrieved from the Canadian Mortality Data-base of the Vital Statistics Division of Statistics Canada. Income categories were determined using the quintile of the median household income of the census tracts of Canada's census metropolitan areas. The relative risks of death by age and sex for each income level, in reference to the highest income group, were those derived in the initial study by Wigle and Mao(1). Age-sex specific mortality rates for 1984 by income level were calculated by applying the 1984 mortality rate and the relative risk of death to the Bayesian formula(2) and then used to con-struct life tables following a method developed by Chiang(3).
Life expectancy is a hypothetical measure and indicator of current health and mortality condi-tions(4). The life expectancy according to income level can be used to study the association between income and the risk of death due to all causes. The study showed that life expectancy increased mono-tonically with income level. The difference in life expectancy by income level was greater for males than females at all ages. The difference for each sex was greatest at birth, relatively constant up to age 35
and declined rapidly after age 45. For females over 55 and males over 75, this difference was less than one year.
The relationship between income level and life expectancy must be carefully interpreted; an associ-ation should not be confused as a causal relassoci-ation. Income level is correlated with factors such as education, occupation and lifestyle which can independently contribute to the risk of disease. Chronic disease and disability may cause a decline in income level due to loss of employment or a decline injob status and pay; thus, a relatively low income at the time of death can be a result of disease as opposed to a cause(l). The correlation observed from the life table does not imply that income per se directly influences life expectancy. Income should be considered as a socioeconomic status indicator. The results indicate that the residents of high socioeconomic status areas live longer than those of the low socioeconomic status areas.
References
(I) Wigle, D.T.. Mao, Y. Morrality by Income Level in Urban
Canada. Health and Welfare Canada 1980.
(2) Ash, R. B. Basic Probabilit y Theory. John Wiley and Sons, Toronto 1970.
(3) Chiang, C. L. The Life Table and its Applications. Robert E. Krieger Publishing Company, Malabar 1984.
(4) Last. J.M. A Dictionary' of Epidemiology. Oxford Uni-versity Press, Toronto 1983.
(Source: Anne-Marie Ugnat and Elen Mark. Adapted from an article first published in
Chronic Diseases in Canada, Vol. 8, No. 1, June 1987.)
Diseases Subject to the International
Health Regulations
Total cholera, yellow fever, and plague cases and deaths
reported in the Region of the Americas
as of 31 December 1987
Country and Cholera Yellow fever Plague
administrative subdivision cases Cases Deaths cases
BOLIVIA - 5 11 2
La Paz 15 11
Santa Cruz - - 2
BRAZIL - 7 6 3
Amazonas I I
Bahía - - 3
Goiás - 6 5
COLOMBIA - 4 2
Antioquia 2
-Santander 2 2
PERU 156 149
-Ayacucho - 15 15
Cuzco 19 19
-Huánuco - 35 35
Junín 32 29
Loreto - 1 I
Madre de Dios 22 22
Pasco - 1I
San Martín - 27 23
Ucayali - 4 4
UNITED STATES OF AMERICA 5 - 12
Arizona - - 2
Colorado 2
Guam (West Pacific) la
Idaho
Louisiana 4
Montana - - - I
New Mexico - 5b
Oregon I
a Imported case.
b Includes two suspected cases.
in
e
.
I I