Submitted21 June 2016
Accepted 4 September 2016
Published4 October 2016
Corresponding author
Zhiqiang Li, [email protected]
Academic editor
Ilaria Negri
Additional Information and Declarations can be found on page 19
DOI10.7717/peerj.2527
Copyright
2016 Wu et al.
Distributed under
Creative Commons CC-BY 4.0
OPEN ACCESS
Transcriptome response to elevated
atmospheric CO
2
concentration in
the Formosan subterranean termite,
Coptotermes formosanus
Shiraki
(Isoptera: Rhinotermitidae)
Wenjing Wu1, Zhiqiang Li1, Shijun Zhang1, Yunling Ke1and Yahui Hou1,2
1Guangdong Key Laboratory of Integrated Pest Management in Agriculture, Guangdong Public Laboratory of
Wild Animal Conservation and Utilization, Guangdong Institute of Applied Biological Resources, Guangzhou, Guangdong, China
2College of Forestry, Northeast Forestry University, Harbin, Heilongjiang, China
ABSTRACT
Background. Carbon dioxide (CO2) is a pervasive chemical stimulus that plays a critical
role in insect life, eliciting behavioral and physiological responses across different
species. High CO2 concentration is a major feature of termite nests, which may
be used as a cue for locating their nests. Termites also survive under an elevated
CO2 concentration. However, the mechanism by which elevated CO2concentration
influences gene expression in termites is poorly understood.
Methods. To gain a better understanding of the molecular basis involved in the
adap-tation to CO2 concentration, a transcriptome ofCoptotermes formosanusShiraki was
constructed to assemble the reference genes, followed by comparative transcriptomic
analyses across different CO2concentration (0.04%, 0.4%, 4% and 40%) treatments.
Results. (1) Based on a high throughput sequencing platform, we obtained
approx-imately 20 GB of clean data and revealed 189,421 unigenes, with a mean length and an N50 length of 629 bp and 974 bp, respectively. (2) The transcriptomic response of
C. formosanusto elevated CO2levels presented discontinuous changes. Comparative
analysis of the transcriptomes revealed 2,936 genes regulated among 0.04%, 0.4%,
4% and 40% CO2 concentration treatments, 909 genes derived from termites and
2,027 from gut symbionts. Genes derived from termites appears selectively activated
under 4% CO2level. In 40% CO2level, most of the down-regulated genes were derived
from symbionts. (3) Through similarity searches to data from other species, a number of protein sequences putatively involved in chemosensory reception were identified
and characterized inC. formosanus, including odorant receptors, gustatory receptors,
ionotropic receptors, odorant binding proteins, and chemosensory proteins.
Discussion. We found that most genes associated with carbohydrate metabolism,
energy metabolism, and genetic information processing were regulated under different
CO2concentrations. Results suggested that termites adapt to∼4% CO2level and their
gut symbionts may be killed under high CO2 level. We anticipate that our findings
provide insights into the transcriptome dynamics of CO2responses in termites and
SubjectsBioinformatics, Entomology, Molecular Biology, Statistics
Keywords Coptotermes formosanus, Transcriptome, Gene expression, Carbon dioxide response, Next generation sequencing data, Chemosensory receptor
INTRODUCTION
Despite the low concentration of carbon dioxide (CO2) in air, it plays a critical role in insect
life. Insects not only live in the normal atmosphere environment, but are also sometimes
exposed to higher or lower CO2concentrations. Naturally high CO2concentration is likely
to occur in holes under the bark of trees or stumps, in the soil when it is covered by ice
and snow, or inside decomposing organic matter. Fluctuations of atmospheric CO2could
evoke behavioral and physiological responses in insects. On the one hand, CO2acts as an
attractive cue to elicit behavioral responses in many insects, such as seeking food and hosts,
avoiding conspecifics, and locating nests (Guerenstein & Hildebrand, 2008). For example,
mosquitoes depend on CO2to locate human hosts whose volatile emissions contain CO2
(Gillies, 1980;Guerenstein & Hildebrand, 2008). Many moths measure the CO2gradients,
which indicate the floral quality, to find more and better nectar (Guerenstein et al., 2004;
Thom et al., 2004). InDrosophila, high concentrations of CO2elicit an avoidance response
to other individuals (Suh et al., 2004). Social insects such as bees, wasps, ants and termites
may detect CO2concentration to locate their nests, in which CO2concentration is much
higher than the atmospheric concentration (Seeley, 1974). On the other hand, physiological
effects of CO2are diverse. In the nervous system, increasing CO2concentration induce
sub-lethal or lethal effects (Nicolas & Sillans, 1989). In the respiratory and circulatory
system, changes in CO2regulate the opening of the spiracles. In developmental processes,
high CO2may decrease metabolic rates, reduce weight, affect size, or prolong larval life and
growth. In regards to reproduction, CO2may delay or impede mating activity, accelerate
oviposition, or stimulate vitellogenin synthesis (Nicolas & Sillans, 1989).
Termites contribute up to 2% of the natural efflux of CO2from terrestrial sources
(Sugimoto, Bignell & MacDonald, 2000) and 10% from the soil surface (De Gerenyu et al.,
2015). High CO2concentration is a major feature of termite nests. Inside the nests, termite
activity takes place under an elevated CO2concentration (0.3–5%) and occasionally up
to 15%, but outside the nests, termites are exposed to the natural CO2concentration
in air (approximately 0.04%) (Ziesmann, 1996). It is suggested that CO2concentration
may provide information on location of termite nests.Bernklau et al. (2005)reported that
Reticulitermesspp. were attracted to CO2concentrations between 5 and 50 mmol/mol and
CO2could be used as an attractant in baiting systems to elicit termites to an insecticide.
This finding has been commercialized and is used in Ensystex bait systems under the name Focus.
The chemosensory system is usually used by insects to sense odorants, the taste of food, or other chemical stimuli in the environment. Sensory structures for detecting
changes in atmospheric CO2have been identified and described in Lepidoptera, Diptera,
Hymenoptera, and Isoptera (Stange & Stowe, 1999). The structures typically contain
they are located on either the palps (moths, mosquitoes, flies, and beetles) or the antennae
(bees, ants, and termites) (Stange & Stowe, 1999). In termites, study ofSchedorhinotermes
lamanianus showed that sensory cells in the antennal sensilla may be sensitive to both
CO2 and odorant (Ziesmann, 1996). The insect chemosensory proteins are various and
mainly located in the sensory structures, such as odorant receptor (OR), gustatory receptor (GR), ionotropic receptor (IR), odorant binding protein (OBP), and chemosensory protein (CSP) families. Several studies have aimed to elucidate their underlying mechanisms and
functions. The first study on the molecular bases of CO2reception was inDrosophila. Two
GRgenes (GR21aandGR63a) were identified, and co-expression of them was necessary
to confer a CO2 response (Jones et al., 2007;Kwon et al., 2007). Orthologues ofGR21a
andGR63ahave been identified in butterfly, moth, beetle, mosquito, and termite species,
but not in honeybees, pea aphids, ants, locusts and wasps (Xu & Anderson, 2015). These
genomic differences may suggest different chemoreceptors and mechanisms for CO2
detection among different insects.
The objective of this study was to investigate the effects of elevated CO2concentrations
on the Formosan subterranean termite (Coptotermes formosanusShiraki) in artificial, sealed
chambers in the laboratory. Lower termite C. formosanusis among the most destructive
species worldwide and characterized by the dependence on protozoan symbionts for cellulose digestion. In the present study, to enable comprehensive gene expression profiling,
we generated as complete a reference transcriptome as possible forC. formosanus. Pooled
RNA from different developmental stages and castes was used as starting material for
Illumina sequencing. Next, we constructed four libraries of C. formosanus workers at
different CO2concentrations and compared gene expression profiles among them. We
identified differentially expressed genes, analyzed sensitive processes that were involved in
the response to elevated CO2, and screened genes associated with the chemosensory system.
These assembled and annotated transcriptome sequences will facilitate gene discovery in
C. formosanusand functional analysis of expressed genes and deepen our understanding
of the molecular basis of responses to elevated CO2concentrations in termites and other
insects.
MATERIALS & METHODS
Insects and CO2treatments
Colonies ofC. formosanustermites, collected in Guangzhou International Biotech Island
(23◦04′01.71′′N, 113◦21′47.74′′E), Guangdong, China, were kept in the laboratory in
5.0-L covered plastic boxes containing blocks of pine wood in 85 ±5% humidity at
27±1◦C until they were used in experiments. No specific permissions were required for
accessing these locations for sampling activities, and no endangered or protected species were involved in the study.
To comprehensively investigate the differences in gene expression when CO2
concentration was elevated, we performed comparative transcriptome analysis among
worker termites rearing at 0.04% CO2(natural CO2level), 0.4% CO2(low CO2level), 4%
in gastight containers, which rinsed with distilled water. One hundred termite workers and ten soldiers were placed in each container with moistened sterile vermiculite (Hoffman,
Landsville, PA) and a filter paper disc (8 cm in diameter). Different concentrations of CO2,
0.04%, 0.4%, 4% and 40% were achieved by inputting gas mixtures of 0.04%, 0.4%, 4%
and 40% CO2; 21% O2; and the balance N2. CO2concentrations were confirmed using a
CO2sensor (Type-IR- CO2gas tester, Heraeus), with accuracy range of 0–1%±0.05% CO2
absolute; 1–25%±5% CO2of reading; 25–60%±10% CO2of reading. At a substantially
constant temperature (27 ±1◦C) and humidity (85 ±5%), all treatment groups were
exposed for 72 hr and then collected live worker termites.
Sampling and RNA extraction
For collecting samples of RNA, untreated individuals (including the worker, soldier and
reproductive castes) of C. formosanusfrom our laboratory were collected and frozen
immediately in liquid nitrogen and stored in−80◦C freezers until use. The samples
of termites were randomly chosen with development stages, including larva, worker, pre-soldier, and soldier. Each sample containing 50 whole body individuals from each
caste and stage was subjected to RNA isolation. Samples of 50 live workers from each CO2
treatment were also collected and frozen immediately in liquid nitrogen and stored in−80
◦C. Total RNA was extracted using the RNAsimple Total RNA Kit (TIANGEN, Beijing,
China) according to the manufacturer’s instructions. RNA quantity and quality were assessed using the NanoDrop spectrophotometer (Nanodrop Technologies Inc., Rockland, DE, USA) and the Agilent 2100 Bioanalyzer (Santa Clara, CA, USA). The standards applied
were OD260/OD230≥1.8, 1.8≤OD260/OD280≤2.2, and RNA integrity number values
>8.0. RNA samples were used for cDNA library construction and qRT-PCR.
cDNA library construction and sequencing
For reference transcriptome of C. formosanus, equal amounts of RNA from untreated
samples (larva, worker, pre-soldier, soldier, and reproductive) and all CO2-treated samples
were mixed, designated as Cfo. For transcriptomic comparison among CO2treatments,
RNA from 0.04%, 0.4%, 4%, and 40% CO2-treated workers were used, designated as
T1, T2, T3, and T4, respectively. T1 was served as the control group. Finally, five library constructions (Cfo, T1, T2, T3, and T4) and the RNA sequencing were performed by the
Biomarker Biotechnology Corporation (Beijing, China). Approximately, 5µg of total RNA
for each sample was used for the construction of libraries using TruSeq Stranded mRNA Sample Prep Kit (Illumina Inc., San Diego, CA, USA) according to the manufacturer’s
protocol. Sequencing was performed in a v3 flowcell on an Illumina HiSeqTM 2500
sequencer, using the TruSeq PE Cluster Kit v3 (Illumina PE-401-3001) and the TruSeq SBSHS Kit v3 200 cycles (Illumina FC-401-3001).
De novotranscriptome assembly and annotation
Raw reads were filtered by removing the adaptor sequences, empty reads and low quality
sequences (reads with more than 50% of bases withQ-value≤20). The clean reads were
then assembledde novousing the Trinity platform (http://trinityrnaseq.github.io) with
performing pair-end joining and gap filling, contigs were assembled into transcripts, and
the longest copy of redundant transcripts was regarded as a unigene (Grabherr et al., 2011;
Haas et al., 2013).
The obtained unigenes were compared against public databases, including NCBI non-redundant nucleotide sequence (NT) database using BLASTn (version 2.2.14), NCBI non-redundant protein (NR), Swiss-Prot, Kyoto Encyclopedia of Genes and Genomes (KEGG), Clusters of Orthologous Group (COG), euKaryotic Orthologous Group (KOG), and Protein family (PFAM) databases using BLASTx (version 2.2.23) with an E-value
cutoff at 10−5(Kanehisa et al., 2004;Koonin et al., 2004;Tatusov et al., 2000). To identify
Gene Ontology (GO) terms describing biological processes, molecular functions, and cellular components, the Swiss-Prot BLAST results were imported into Blast2GO 3.0.8 (Götz et al., 2008).
Analysis of gene expression and identification of differentially expressed genes (DEGs)
The abundance of all genes was normalized and calculated by RSEM (Li & Dewey, 2011)
and represented by the fragments per kilo base of transcript per million mapped reads
(FPKM) value (Trapnell et al., 2010). We kept transcript isoform predictions whose
FPKM > 0.03. DEGs were identified using EBSeq with conditions of FDR (False
Discovery Rate) <0.01 and fold-change ≥2 (Leng et al., 2013). GO enrichment analysis
of DEGs was implemented by using the Bioconductor package topGO (available at
http://www.bioconductor.org/packages/release/bioc/html/topGO.html). Kolmogorov– Smirnov (KS) test was used to test the enrichment of GO terms with DEGs at a significance
level ofP≤0.05 (Alexa & Rahnenführer, 2009). For the pathway enrichment analysis, we
mapped all DEGs to terms in the KEGG database and looked for significantly enriched KEGG terms compared to the transcriptome database. We used KEGG Automatic
Annotation Server (http://www.genome.jp/tools/kaas/) with the parameters of search
program=‘BLAST,’ GENEs data set=‘for Eukaryotes, including auto-selected organisms
and all insect organisms,’ and assignment method=‘BBH (bi-directional best hit).’
Validation of RNA-Seq data
To confirm the differential expression of genes revealed by RNA-Seq, 10 DEGs were chosen for quantitative real-time PCR (qRT-PCR) validation. qRT-PCR was performed by using
the TaKaRa SYBRR Premix Ex Taq Perfect Real Time qPCR Kit (TaKaRa, Japan) and the
StrataGene Mx3000P QPCR System (Agilent Technologies, Santa Clara, CA, USA). For each gene, 100 ng of total RNA was used as a template in a mixture of specific primers (10µM) (Table S1) and Master Mix to a final volume of 20µL following manufacturer’s
instruction. The qRT-PCR program was set to: 95◦C for 30 s of pre-incubation, 40 cycles
of 95◦C for 5 s, 60 ◦C for 30 s, and 72◦C for 30 s of amplification. The specificity of
the PCR products from each primer pair was confirmed by melting-curve analysis and agarose gel electrophoresis. Three biological replicates of each treatment were tested. All measurements were performed in triplicate. 18S ribosomal RNA was used as a reference
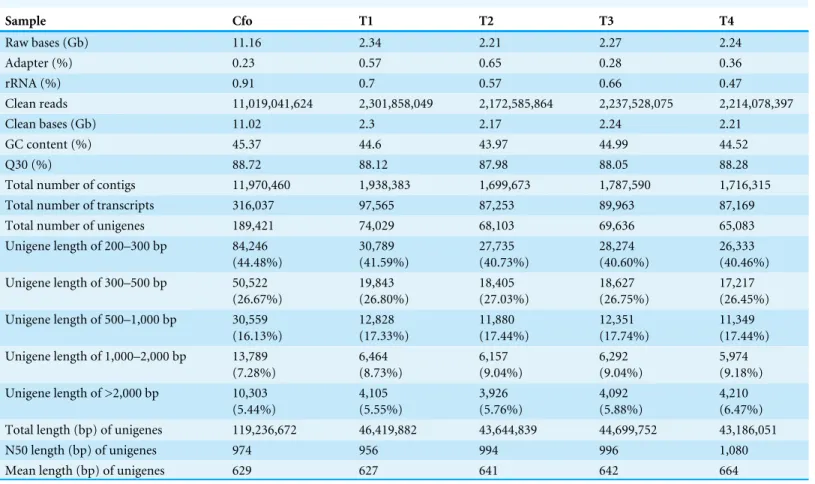
Table 1 Summary of the Illumina sequencing and Trinity assembly.
Sample Cfo T1 T2 T3 T4
Raw bases (Gb) 11.16 2.34 2.21 2.27 2.24
Adapter (%) 0.23 0.57 0.65 0.28 0.36
rRNA (%) 0.91 0.7 0.57 0.66 0.47
Clean reads 11,019,041,624 2,301,858,049 2,172,585,864 2,237,528,075 2,214,078,397
Clean bases (Gb) 11.02 2.3 2.17 2.24 2.21
GC content (%) 45.37 44.6 43.97 44.99 44.52
Q30 (%) 88.72 88.12 87.98 88.05 88.28
Total number of contigs 11,970,460 1,938,383 1,699,673 1,787,590 1,716,315
Total number of transcripts 316,037 97,565 87,253 89,963 87,169
Total number of unigenes 189,421 74,029 68,103 69,636 65,083
Unigene length of 200–300 bp 84,246
(44.48%) 30,789 (41.59%) 27,735 (40.73%) 28,274 (40.60%) 26,333 (40.46%)
Unigene length of 300–500 bp 50,522
(26.67%) 19,843 (26.80%) 18,405 (27.03%) 18,627 (26.75%) 17,217 (26.45%)
Unigene length of 500–1,000 bp 30,559
(16.13%) 12,828 (17.33%) 11,880 (17.44%) 12,351 (17.74%) 11,349 (17.44%)
Unigene length of 1,000–2,000 bp 13,789
(7.28%) 6,464 (8.73%) 6,157 (9.04%) 6,292 (9.04%) 5,974 (9.18%)
Unigene length of >2,000 bp 10,303
(5.44%) 4,105 (5.55%) 3,926 (5.76%) 4,092 (5.88%) 4,210 (6.47%)
Total length (bp) of unigenes 119,236,672 46,419,882 43,644,839 44,699,752 43,186,051
N50 length (bp) of unigenes 974 956 994 996 1,080
Mean length (bp) of unigenes 629 627 641 642 664
addition, the expression of 18S rRNA in RNA-seq and preliminary qPCRs using the
CO2-treated workers was stable (Fig. S1). The 2−11Ctmethod was used to analyze the
qRT-PCR data and assign relative expression differences (Livak & Schmittgen, 2001).
Availability of supporting data
All sequence data have been submitted to GenBank Sequence Read Archive databases
under accession numberSRP068272 andSRP068332, and associated with Bioproject
PRJNA308390andPRJNA308507, respectively. Their accessions areSRR3095926for Cfo
(reference transcriptome ofC. formosanus),SRR3097983for T1, SRR3097984for T2,
SRR3097985for T3, andSRR3097987for T4.
RESULTS
Transcriptome sequencing and assembly
An overview of the sequencing and assembly is outlined inTable 1. After quality control,
the number of clean bases in the reference transcriptome ofC. formosanus, and four CO2
treatments T1, T2, T3, and T4 were 11.02, 2.30, 2.17, 2.24 and 2.21 GB, respectively, with
an average GC content of 44.69% and a Q30 of 88.23% (Table 1). After assembly, 316,037
length between 200–1,000 bp. The mean length and N50 (50% of the transcriptome is in unigenes of this size or larger) length of unigenes were 629 bp and 974 bp, respectively. A larger N50 length and mean length are considered indicative of better assembly (Garg et al., 2011).
Functional annotation and classification
After annotation, the number of unigenes with different length annotated in different
databases and their percentage were counted (Table S2). The NR database (61,407, 32.42%)
had the largest match. The Swiss-Prot (35,633, 18.81%), PFAM (32,444, 17.13%), and KOG (30,531, 16.12%) shared similar quantities. Unigene length over 1,000 bp annotated more
successfully than length less than 1,000 bp (Table S2).
Totally 16,552 unigenes were annotated into 55 sub-categories belonging to three main GO categories: biological process (BP), cellular component (CC), and molecular
function (MF) (Fig. S2). There were 20, 19, and 16 sub-categories in BP, CC, and MF,
respectively. The top sub-categories were metabolic process (10,208 unigenes), cell part (4,100 unigenes), and catalytic activity (9,975 unigenes) in BP, CC, and MF, respectively. By KOG classifications, 30,531 unigenes were classified functionally into 25 categories. The cluster of ‘signal transduction mechanisms’ was the largest group, which had 6,631 unigenes. Pathway analyses were also performed on all assembled unigenes to understand the biological functions of genes and how these genes interact. A total of 16,444 unigenes
were functionally classified into five KEGG categories (Fig. S3): genetic information
processing (5,403 unigenes, 788 enzymes), metabolism (2,169 unigenes, 487 enzymes), cellular processes (2,146 unigenes, 358 enzymes), environmental information processing (1,235 unigenes, 218 enzymes), and organismal systems (548 unigenes, 90 enzymes). Among 19 sub-categories, ‘translation,’ ‘transport and catabolism,’ and ‘folding, sorting and degradation’ were the top three sub-categories.
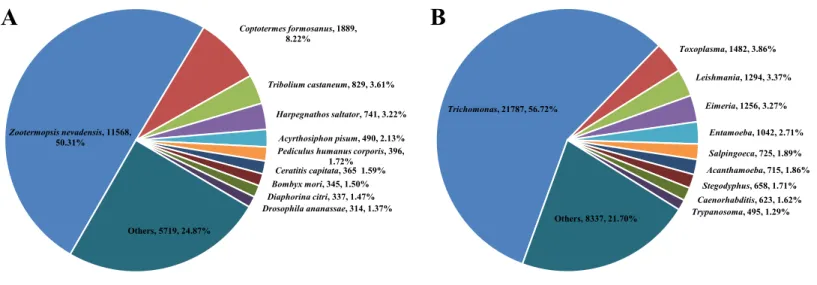
Because we made RNA-seq from whole termites containing guts, the transcriptome included host termite and symbiont genes. According to the NR species distribution result, there were 22,993 (37.44%) unigenes derived from insect species, which may be supposed to be termite genes, and 38,414 (62.55%) from protozoan symbionts. The distribution
result was similar to the study byZhang et al. (2012). Among termite genes, the majority
of the sequences (50.31%) had strong homology withZootermopsis nevadensis, followed
byC. formosanus(8.22%),Tribolium castaneum(3.61%),Harpegnathos saltator (3.22%),
Acyrthosiphon pisum (2.13%) and the remaining species were less than 2% (Fig. 1A). Among symbiont genes, the majority of the sequences (56.72%) had strong homology
with genusTrichomonas, followed by genusToxoplasma(3.86%) andLeishmania(3.37%)
(Fig. 1B).
Transcriptome profiles of worker termites at different CO2
concentrations
Gene expression of all unigenes in T1, T2, T3, and T4 were estimated as FPKM. Genes
with FPKMs ≤ 1 were considered not to be expressed or to be present at very low
Zootermopsis nevadensis, 11568, 50.31%
Coptotermes formosanus, 1889, 8.22%
Tribolium castaneum, 829, 3.61%
Harpegnathos saltator, 741, 3.22%
Acyrthosiphon pisum, 490, 2.13%
Pediculus humanus corporis, 396, 1.72%
Ceratitis capitata, 365 1.59%
Bombyx mori, 345, 1.50%
Diaphorina citri, 337, 1.47%
Drosophila ananassae, 314, 1.37%
Others, 5719, 24.87%
Trichomonas, 21787, 56.72%
Toxoplasma, 1482, 3.86%
Leishmania, 1294, 3.37%
Eimeria, 1256, 3.27%
Entamoeba, 1042, 2.71%
Salpingoeca, 725, 1.89%
Acanthamoeba, 715, 1.86%
Stegodyphus, 658, 1.71%
Caenorhabditis, 623, 1.62%
Trypanosoma, 495, 1.29% Others, 8337, 21.70%
A
B
Figure 1 Species distribution from BLASTx matches against the NR protein database (cut-off value E<10−5).(A) Species distribution of genes
derived from termites and the proportions for each species. (B) Species distribution of genes derived from symbionts and the proportions for each species.
Table 2 Distribution of gene expression in each CO2treatments (FPKM >1).
FPKM interval T1 T2 T3 T4
1–3 32,255 28,433 27,736 25,713
3–15 14,082 13,693 13,227 12,173
15–60 3,774 3,695 3,684 3,579
>60 1,079 1,090 1,104 1,066
(Fang et al., 2015).Table 2 shows the distribution of expression levels of all genes in
each CO2treatments; the overall trend has been a decline as elevated CO2concentrations
(Table 2). The number of the genes with FPKM >1 shared by T1, T2, T3, and T4 were 24,385 (Fig. S4A) and the four samples had 876 common genes with high expression (FPKM > 60) (Fig. S4B). We analyzed the biological function of the highly expressed genes using the GO (Fig. S2) and KOG classifications. In the GO classification, the most abundant GO terms were ‘metabolic process’ and ‘catalytic activity.’ In the KOG classification, these genes were mainly classified into ‘translation, ribosomal structure and biogenesis,’ ‘posttranslational modification, protein turnover, chaperones,’ ‘cytoskeleton,’ and ‘energy production and conversion.’ Their functions covered metabolism, cellular processes and signaling, and information storage and processing. Thus, these genes may play an essential role in the life of termites. We found that three genes, c155263_c0, c190637_c0, and c188048_c3, were extremely highly expressed (FPKM > 9,000) in all four treatments. Gene c155263_c0 was annotated as a hypothetical protein with unknown function. Gene c190637_c0 was similar to ABC-type transporter Mla, which maintains outer membrane lipid asymmetry and participates in cell wall/membrane/envelope biogenesis. Gene c188048_c3 encoded
endo-β-1,4-glucanase ofC. formosanus, which is important to termite cellulose digestion
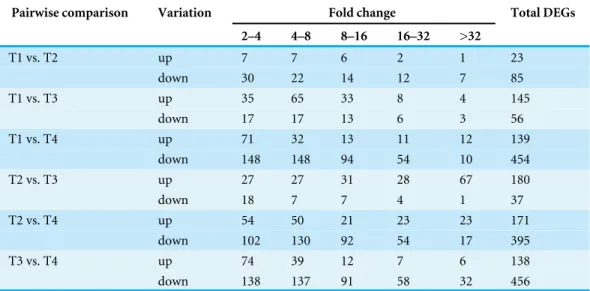
Table 3 The fold change distribution of termite DEGs.
Pairwise comparison Variation Fold change Total DEGs
2–4 4–8 8–16 16–32 >32
T1 vs. T2 up 7 7 6 2 1 23
down 30 22 14 12 7 85
T1 vs. T3 up 35 65 33 8 4 145
down 17 17 13 6 3 56
T1 vs. T4 up 71 32 13 11 12 139
down 148 148 94 54 10 454
T2 vs. T3 up 27 27 31 28 67 180
down 18 7 7 4 1 37
T2 vs. T4 up 54 50 21 23 23 171
down 102 130 92 54 17 395
T3 vs. T4 up 74 39 12 7 6 138
down 138 137 91 58 32 456
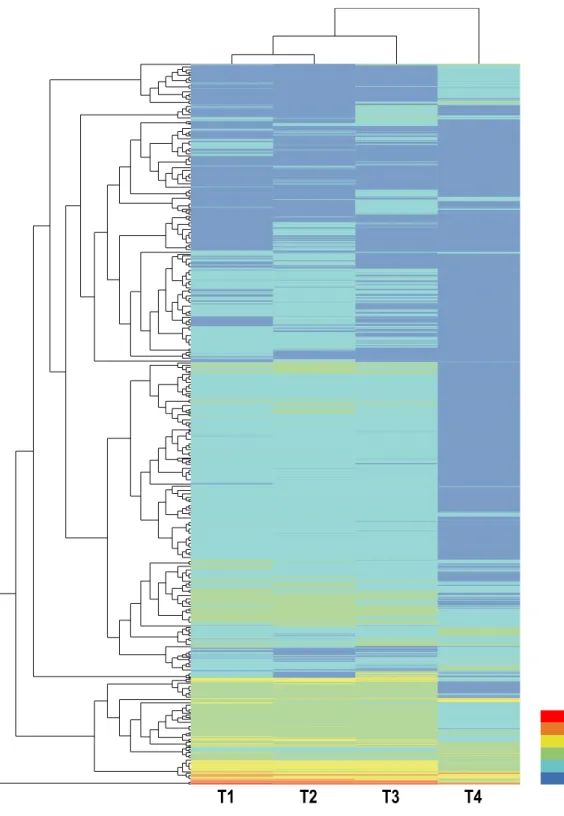
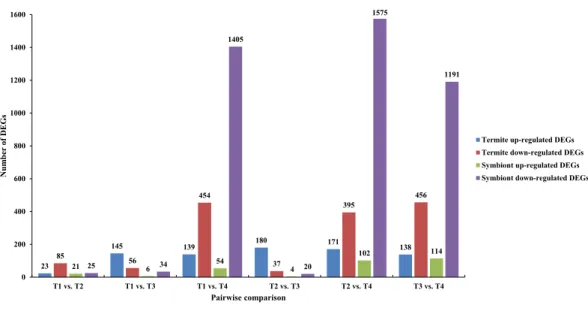
Differentially expressed genes (DEGs) and functional annotation
Hierarchical clustering of all DEGs was performed to observe the gene expression patterns
based on the log2FPKMs for the four samples (Fig. 2). The number of DEGs in each
pairwise comparison is presented in Fig. 3. In total, all six comparison sets had 2,936
unique DEGs, 909 were termite DEGs and 2,027 were symbiont DEGs. The number of symbiont DEGs was more than twice greater than the number of termite DEGs, suggesting symbionts changed more remarkably than termite. Approximately 90% DEGs were in comparison sets of T1 vs. T4, T2 vs. T4, and T3 vs. T4, and a majority of them were down-regulated, especially in symbionts. However, in T1 vs. T3 and T2 vs. T3, the number of up-regulated termite DEGs was about twice and four times as many as the number of down-regulated termite DEGs, respectively. Meanwhile, the fold-change of up-regulated termite DEGs was larger than down-regulated termite DEGs in above two comparison
sets (Table 3), which suggests genes are slightly up-regulated in T3 in termite but not
symbionts.
According to GO classification (Fig. 4), the number of DEGs in some GO terms
(e.g., ‘oxidation reduction,’ ‘alcohol metabolic process,’ ‘ion binding’ and ‘oxidoreductase activity’) was similar between termites and symbionts. But in most GO terms, the number of symbiont DEGs was more than the number of termite DEGs, such as ‘cell cycle process,’ ‘embryonic development,’ ‘growth,’ ‘macromolecule localization,’ ‘transferase activity,’ and ‘ligase activity.’ In KOG classification, the majority of termite DEGs are in the class ‘signal transduction mechanisms,’ ‘lipid transport and metabolism’ and ‘amino acid transport and metabolism,’ while the majority of symbiont DEGs are in the class ‘posttranslational modification, protein turnover, chaperones,’ ‘signal transduction mechanisms’, ‘translation, ribosomal structure and biogenesis’, and ‘cytoskeleton.’
Compared to natural CO2 level (T1 vs. T2, T1 vs. T3, and T1 vs. T4), there were
T1
T2
T3
T4
10 8 6 4 2 0
23
145 139 180 171 138
85 56 454 37 395 456
21 6 54 4
102 114 25 34 1405 20 1575 1191 0 200 400 600 800 1000 1200 1400 1600
T1 vs. T2 T1 vs. T3 T1 vs. T4 T2 vs. T3 T2 vs. T4 T3 vs. T4
N u m b er of D E G s Pairwise comparison
Termite up-regulated DEGs Termite down-regulated DEGs Symbiont up-regulated DEGs Symbiont down-regulated DEGs
Figure 3 Number of differentially expressed genes (DEGs) in each pairwise comparison.The blue and red bars represented up- and down-regulated DEGs derived from termites, respectively. The green and pink bars represented up- and down-regulated DEGs derived from symbionts, respectively.
Termite DEGs Symbiont DEGs
0 15 30 45 60 0 44 88 132 177 0 102 204 307 409 cell cell part intracellular intracellular part macromolecular complex membrane membrane part membrane-bounded organelle non-membrane-bounded organelle protein complex ribonucleoprotein complex ion binding ligase
nucleoside binding nucleotide binding oxidoreductase
structural constituent of ribosome transferase
alcohol metabolic process biosynthetic process
cell cycle process
cellular metabolic process cellular process
embryonic development
establishment of protein localization growth
macromolecule localization
macromolecule metabolic process microtubule-based process
oxidation reduction
Cellular Component Molecular Function Biological Process
Percent of genes
GO Classification of DEGs
Number of genes
Figure 4 Gene Ontology classification of termite and symbiont DEGs.The green and red bars repre-sented DEGs derived from termites and symbionts, respectively.
A
T1 vs. T2B
T1 vs. T3 T1 vs. T4
★ 79
▲ 10
★ 488
▲ 1423
★ 45
▲ 15
★ 23
▲ 4
★ 6
▲ 10
★ 25
▲ 21
★ 54
▲ 11
T1 vs. T4
T2 vs. T4 T3 vs. T4
★ 99
▲ 191
★ 346
▲ 1028
★ 91
▲ 189
★ 57
▲ 51
★ 56
▲ 132
★ 73
▲ 328
★ 135
▲ 94
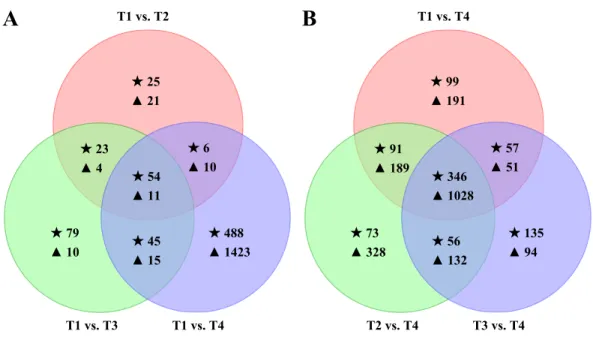
Figure 5 Effects of the elevated CO2treatments on theCoptotermes formosanustranscriptome.
(A) Venn diagram showing the overlaps between the DEGs in elevated CO2levels and normal air. (B)
Venn diagram of the DEGs in T1, T2, and T3 compared to T4. The star (⋆) represent termite DEGs and
the triangle (N) represent symbiont DEGs.
biogenesis (c102424_c0); collagen precursor, which is involved in extracellular structures (c181121_c0); glucokinase 1, which has transferase activity and participates in cellular metabolic process (c186958_c0); and actin cytoskeleton-regulatory complex protein (c127831_c0 and c169839_c0). Furthermore, 17 common DEGs were down-regulated in T2 and T4 but significantly up-regulated in T3. Among them, ten DEGs were annotated and mainly had three types of function: cuticle protein (c185045_c1, c126213_c0, c174474_c1, c190969_c1), fibroin heavy chain precursor (c128561_c0, c128751_c0, c192228_c0), and period circadian protein (c126015_c0, c174457_c0). For symbiont DEGs, there were 11
DEGs in common (Fig. 5A), 10 of them were down-regulated in T2, T3 or T4 compared to
T1, such as c185407_c0 (annotated as cellulase) and c195974_c0 (annotated as ferredoxin-NADP oxidoreductase). Only one gene, c129705_c0 (annotated as threonine dehydratase family protein), was up-regulated in T4.
Compared to high CO2 level (T1 vs. T4, T2 vs. T4, and T3 vs. T4), we found that
346 termite genes were commonly differentially expressed, with 74 up-regulated and 268
down-regulated in all three sets (Fig. 5B). Of the 74 up-regulated DEGs, 41 of them had
informative annotations. For example, genes c184494_c2, c105191_c0, and c183958_c0 were highly expressed and associated with lipid transport and metabolism; c173654_c0 was highly expressed and involved in energy production and conversion. Among 268 down-regulated DEGs, 197 received informative annotations, 71 were hypothetical protein or uncharacterized protein. For example, gene c183902_c0, c174002_c0 and c168998_c0 were significantly down-regulated and participated in carbohydrate transport and metabolism. Moreover, we found that most common DEGs were only differential expressed in high
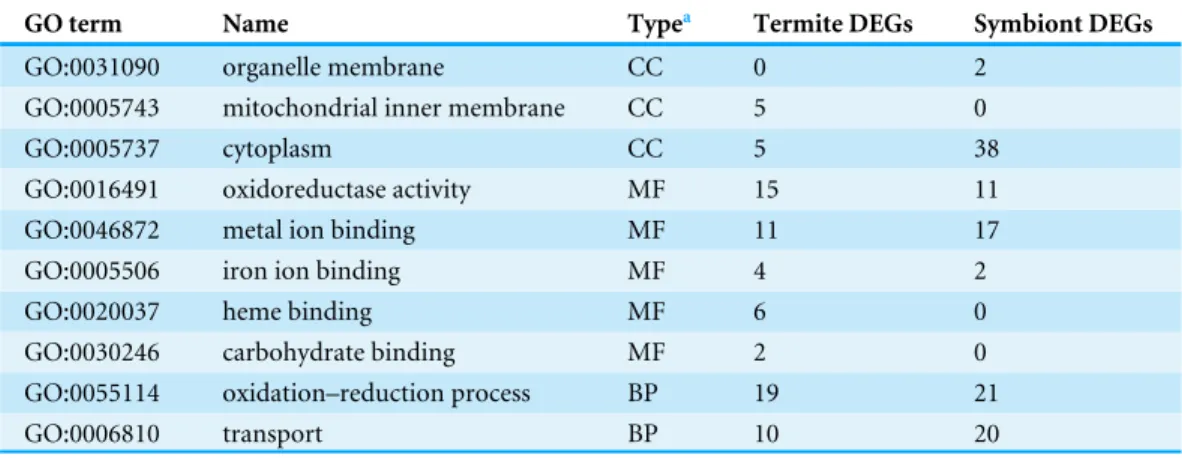
Table 4 Common enriched GO terms and number of DEGs derived from termites and symbionts.
GO term Name Typea Termite DEGs Symbiont DEGs
GO:0031090 organelle membrane CC 0 2
GO:0005743 mitochondrial inner membrane CC 5 0
GO:0005737 cytoplasm CC 5 38
GO:0016491 oxidoreductase activity MF 15 11
GO:0046872 metal ion binding MF 11 17
GO:0005506 iron ion binding MF 4 2
GO:0020037 heme binding MF 6 0
GO:0030246 carbohydrate binding MF 2 0
GO:0055114 oxidation–reduction process BP 19 21
GO:0006810 transport BP 10 20
Notes.
aCC, cellular component; MF, molecular function; BP, biological process.
T2, and T3. For example, two DEGs (c81973_c0 and c174294_c0) were expressed only in T4. Three DEGs (c192331_c0, c180536_c0 and c127808_c0) were not expressed in T1 and T2 but were significantly expressed in T4. However, these five genes were annotated
as hypothetical proteins in Z. nevadensis. Furthermore, there were 263 down-regulated
DEGs that were not differentially expressed among T1, T2, and T3. For example, six genes (c192338_c0, c128228_c0, c129383_c0, c192671_c0, c192511_c0 and c184316_c0) showed high expression in T1, T2, and T3 (FPKM > 15) and low expression in T4 (FPKM < 1). Gene c192338_c0 is annotated as glyceraldehyde-3-phosphate dehydrogenase and plays a role in carbohydrate transport and metabolism. Gene c128228_c0, c129383_c0 and c192671_c0 are ribosomal proteins, which participate in translation, ribosomal structure and biogenesis. For symbiont DEGs, there were 1,028 DEGs in common, with 40 up-regulated and 988 down-regulated in all three sets. Among the down-regulated genes, 64 genes did not
expressed in T4 (FPKM=0), which take part in posttranslational modification, ribosomal
structure, or cell wall biogenesis.
GO and KEGG enrichment analyses of the DEGs
The majority of significantly enriched GO terms were in T1 vs. T4, T2 vs. T4, and T3
vs. T4, specifically more than 130 GO terms enriched in biological process (Table S4).
However, only two terms were common in biological process. The common enriched
terms and the number of DEGs are listed inTable 4. Both termite and symbiont DEGs
were enriched in ‘cytoplasm,’ ‘oxidoreductase activity,’ ‘metal ion binding,’ ‘iron ion binding,’ ‘oxidation–reduction process,’ and ‘transport.’ The termite DEGs were also enriched in ‘mitochondrial inner membrane,’ ‘heme binding,’ and ‘carbohydrate binding.’
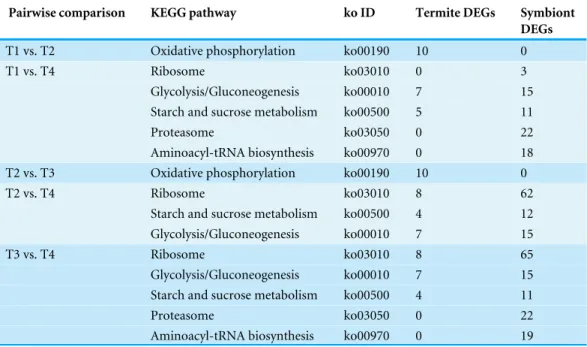
In T1 vs. T2 and T2 vs. T3, the ‘oxidative phosphorylation’ pathway was
significantly enriched and all DEGs were termite DEGs (Table 5). The ‘ribosome,’
Table 5 Significantly enriched pathways in DEGs (q<0.05).
Pairwise comparison KEGG pathway ko ID Termite DEGs Symbiont
DEGs
T1 vs. T2 Oxidative phosphorylation ko00190 10 0
T1 vs. T4 Ribosome ko03010 0 3
Glycolysis/Gluconeogenesis ko00010 7 15
Starch and sucrose metabolism ko00500 5 11
Proteasome ko03050 0 22
Aminoacyl-tRNA biosynthesis ko00970 0 18
T2 vs. T3 Oxidative phosphorylation ko00190 10 0
T2 vs. T4 Ribosome ko03010 8 62
Starch and sucrose metabolism ko00500 4 12
Glycolysis/Gluconeogenesis ko00010 7 15
T3 vs. T4 Ribosome ko03010 8 65
Glycolysis/Gluconeogenesis ko00010 7 15
Starch and sucrose metabolism ko00500 4 11
Proteasome ko03050 0 22
Aminoacyl-tRNA biosynthesis ko00970 0 19
in the KEGG ‘genetic information processing’ category, and were common enriched in T1 vs. T4 and T3 vs. T4. Both were changes of symbionts.
Expression profiles of chemosensory proteins
According to annotations and conserved protein domains, two ORs, five GRs, four IRs, 22 OBPs, and two CSPs were identified by the 7tm Odorant receptor (cl20237), 7tm chemosensory receptor (pfam08395), PBP2_iGluR_putative (cd13717), PBP/GOBP family (pfam01395), and insect pheromone-binding family OS-D (pfam03392) domain, respectively. Among these 35 genes, eight genes had a relatively high expression in at least
one library (FPKM > 10), and most of them were up-regulated in T3 (Table S5). Six OBPs
(c110031_c0, c128738_c1, c129041_c0, c192285_c0, c192783_c0, and c193269_c0) were significantly up-regulated in T3 compared to T1. One OBP, c128814_c0, was significantly increased in T3 compared to T2. One CSP, c125410_c0, was significantly increased in T3 compared to the other three libraries.
Validation of RNA-seq data by qRT-PCR
To validate the transcriptome result, we selected 10 DEGs for qRT-PCR confirmation (c125410_c0, c129041_c0, c166756_c0, c167200_c0, c168998_c0, c169342_c0, c173654_c0, c179746_c0, c181311_c0, and c184494_c2, five genes were described in the text). The
primers used for qRT-PCR were shown inTable S1. The amplification efficiency of each
primer set was validated; standard curves (10×serial dilutions) yielded regression lines
withR2values > 0.97 and an amplification efficiency ranging from 0.9–1.1 (ideal value of
0.8–1.2). Each primer set produced a single amplicon as judged by the single peak in the
dissociation curve. The qRT-PCR expression results (Fig. S5) were similar to the results
in the transcriptome results but minimally expressed in the qRT-PCR results. Although the expression levels were not completely consistent (possibly due to different methods of library construction, reference genes, normalization, or biological differences), the results fundamentally supported the reliability of the RNA-seq results.
DISCUSSION
Overview of transcriptome data
C. formosanus, a worldwide important pest, has been studied extensively in omics, including genome, transcriptome, metabolome, DNA methylome, and 16S rRNA sequencing (Scharf, 2015). While most studies have focused on symbionts, a few have combined
host and symbiont, considering the whole termite (Scharf, 2015). Those studies are mainly
based on conventional Sanger sequencing; rarely has Illumina high-throughput sequencing
study been reported to date. Compare to the study by Zhang et al. (2012)using Sanger
sequencing, the present study newly assembled transcriptome contains massive amounts of data (11.02 GB) using Illumina sequencing, and covers different developmental stages and castes (larva, worker, pre-soldier, soldier, reproductive). The genetic information
will facilitate future developmental and caste differential studies ofC. formosanus, and
contribute to future work in termite comparative genomics.
Transcriptomic response to elevated CO2treatments
In this study, we exposed workers ofC. formosanusto 0.04%, 0.4%, 4%, and 40% CO2
concentrations and constructed four transcriptomes to examine the gene expression profiles. Hierarchical clustering of all DEGs showed that the expression patterns of T1, T2, and T3 were very close, particularly T1 and T2; some DEGs were increased in T3; and more
than one-third of DEGs showed reduced expression in T4 (Fig. 2). Since termites were
collected and placed in a sealed container for 72 hr, the final CO2level was higher than the
initial concentration, which was 0.85%±0.07%, 1.11%±0.01%, 4.67%±0.01%, and
40.61%±0.04%, respectively. The order of the final CO2concentration levels was still T1 <
T2 < T3 < T4. However, the final T1 concentration was close to T2, which may result in the
similar expression pattern of T1 and T2 (Fig. 2). The majority of theC. formosanuslifetime
is spent living inside wood. The CO2concentration in the nest, which was similar to the T3
treatment, is higher than it outside the nest. When termites go outside the nest, it is similar to the T1 or T2 treatment. Termites have adapted to a life in the nest or in enclosed galleries
and are prone to perish quickly when exposed to the open atmosphere (Stange & Stowe,
1999). To some extent, this may be influenced by CO2concentration, which may carry
information relevant to termites, such as information on the location of their nest (Stange
& Stowe, 1999). Thus, termites may increase gene expression and fit better in T3 treatment.
The 40% of CO2was abnormally high and some termites were dead after 72 h. Although
we collected live termites for experiment, we cannot rule out the possibility that termites
were damaged by CO2exposure, suggesting that some changes in gene expression may
be not directly associated with the CO2effects. We also noted that symbionts, intestinal
of CO2might affect pH in the termite guts, and cause changes in intestinal flora. It is
likely that the protists were killed by the abnormally high CO2level, and as a result, gene
expression levels of them were depressed. The death of protozoans may be CO2 direct
effect, or combined effects of CO2and other general stresses. However, the comparisons of
transcript levels employed in our study are based on the assumption that total RNA content
per cell remains constant.Lin et al. (2012)recently found transcriptional amplification in
tumor cells with elevated c-Myc level, andLovén et al. (2012)further indicated that many
up-regulated DEGs were missed and down-regulated ones were falsely produced when processed by global normalizations. The extent to which this will force reconsideration of present expression studies is as yet unclear, especially the down-regulated DEGs. This problem will still be studied in the future.
To help understand the CO2effects on termite biological processes and gene functions,
termite DEGs were analyzed using the public databases. The over-represented GO terms were evaluated to infer which molecular functions, cellular components and biological
processes were most affected by the experimental conditions (Table 4). For molecular
function, elevated CO2levels influenced oxidoreductase activity, metal ion binding, iron
ion binding, heme binding, and carbohydrate binding. From studies inDrosophilaand
other insects, the receptors used to recognize olfactory stimuli appear to be ion channels,
which may be associated with the enrichment of ion binding terms (Spehr & Munger,
2009). For the biological process, oxidation–reduction process and transport were affected,
which may be linked to anaerobic respiration (Nielsen & Christian, 2007). Studies showed
that gene expression may be suppressed to reduce oxygen, aerobic and metabolic activities, including oxidative phosphorylation, oxidation–reduction process, and carbohydrate
metabolism in extremely high CO2concentrations (Nielsen & Christian, 2007). From the
KEGG enrichment results, we found that high CO2levels significantly influenced ribosome,
glycolysis/gluconeogenesis, and starch and sucrose metabolism pathways (Table 5). Briefly,
there were three aspects effected by elevated CO2: (1) carbohydrate metabolism, such as the
binding process, and substrates such as glucose, starch and sucrose; (2) energy metabolism, such as genes with oxidoreductase activity that take part in oxidation–reduction process and the oxidative phosphorylation pathway; and (3) the directed movement of substances (such as metal ion, iron ion, heme, and carbohydrate) by means of some agent such as a transporter or pore.
Genes associated with chemosensory system
In insect chemosensory systems, three chemosensory receptor multi-gene families (ORs, GRs, and IRs) are involved in detection, while OBPs and CSPs play a role in recognition (Brand et al., 2015). OR and GR proteins are highly diverse, with many sharing only 20%
and 8% amino acid similarity, respectively (Hallem, Dahanukar & Carlson, 2006). The
extraordinary divergence in sequences makes it difficult to detect and discriminate OR
andGR genes by traditional sequencing methods. InsectORandGRgenes were first
discovered in the genome sequence of Drosophila melanogaster, suggesting that these
genes could largely be discovered from genome sequences. Thus, the transcriptome of
twoORs, fiveGRs, and fourIRswere identified. The number ofORgenes was obviously
smaller than that of other insects, such as D. melanogaster,Anopheles gambiae, andApis
melliferawhich have 60, 79, and 170ORgenes, respectively (Robertson & Wanner, 2006).
OneOR, c197137_c0, was homologous to Or83b ofHolotrichia oblita,Plutella xylostella,
Helicoverpa assulta, etc. Or83b is highly conserved among all insect species analyzed so far (Nakagawa et al., 2012). The number ofGRgenes was close toAp. melliferawhich has 10
GRgenes, whileD. melanogaster andAn. gambiae have 60 and 79GRgenes, respectively
(Robertson & Wanner, 2006). However, five GRs were not homologous toD. melanogaster
GR21a or GR63a, and their expression was not significant under CO2stress. Perhaps,
GRs inC. formosanusdo not act as CO2receptors. However, we note that it is unlikely
that the detected candidate genes represent the complete repertoire of theC. formosanus
chemosensory gene families because detection is not possible if expression levels of target genes are too low or if they are specific to unexamined sexes, castes, life stages or tissues (Brand et al., 2015). The detected genes are likely important and typically among the highest
expressed chemosensory genes inC. formosanusand thus are very likely to be detected in
transcriptome analyses. However, more chemosensory genes and their functions should be examined in further experiments.
The two non-receptor multi-gene families, OBPs and CSPs, encode soluble proteins and have been identified in the lymph of chemosensilla and non-sensory organs in insects (Pelosi, Calvello & Ban, 2005). They contribute to the transport of odorant molecules through sensillar lymph, and increase the sensitivity and possibly the selectivity of the
insect olfactory system (Leal, 2013). OBPs are reported to be different across species and
within the same species, sharing even less than 20% amino acid identity in some cases (Zhou, Field & He, 2010). The number ofOBP genes in different insects ranges from 15 (Acyrthosiphon pisum) to 66 (An. gambiae andAedes aegypti) (Fan et al., 2011). In this
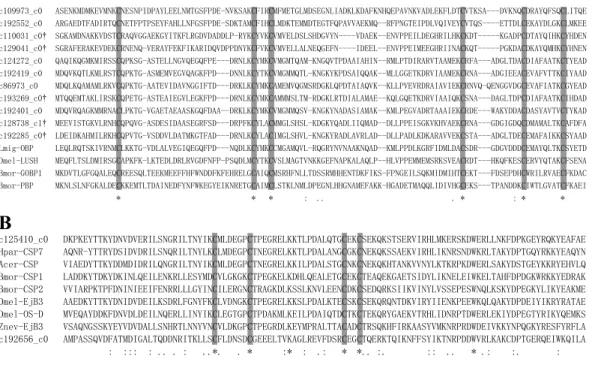
study, we identified 22OBP genes. According to their putative protein sequences, these
OBPs could be divided into two groups: 11 were classical OBPs with six cysteine residues (Fig. 6A), and 11 were Minus-C OBPs with four or five cysteine residues (Fan et al., 2011;
Pelosi et al., 2006). Among them, sevenOBP genes were differentially up-regulated in T3, including five classical OBPs and two Minus-C OBPs. OBPs may perform roles either related or not related to chemoreception, as they are widely distributed throughout the insect’s body, including different sensory parts (e.g., antennae and mouth), tarsi and wings (Pelosi et al., 2006). However, the expression of receptor genes was inconsistent withOBP
genes, which makes it difficult to explain. Both the response ofOBP genes to elevated CO2
levels and the downstream response elements require more experiments. CSPs are smaller
than OBPs and present a motif of four conserved cysteines (Angeli et al., 1999). The number
of CSPs reported in each species is quite variable, such asCactoblastis cactorum,Polistes
dominulus, andVespa crabro, with only one CSP,D. melanogaster with four CSPs,An. gambiae with seven CSPs, andLocusta migratoriawith at least 20 CSPs (Pelosi et al., 2006).
Here, we identified twoCSPgenes based on their sequences (Fig. 6B), and c125410_c0 was
differentially up-regulated in T3. Some CSPs, such as CLP-1 ofCactoblastis cactorumand
c109973_c0 ASENKMDMKEVMNKCNESNPIDPAYLEELNMTGSFPDE-NVKSAKCFIRCMFMETGLMDSEGNLIADKLKDAFKNHQEPAVNKVADLEKFLDTCVTKSA---DVKNQCDRAYQFSQCLITQE c192552_c0 ARGAEDTFADIRTQCNETFPTPSEYFAHLLNFGSFPDE-SDKTAMCFIHCLMDKTEMMDTEGTFQPAVVAEKMQ--RFPNGTEIPDLVQIVEYCVTQS----ETTDLCEKAYDLGKCLMKEE c110031_c0† SGKAMDNAKKVDSTCRAQVGGAEKGYITKFLRGDVDADDLP-RYKCYVKCVMVELDSLSHDGVYN----VDAEK--ENVPPEILDEGHRILHKCKDT---KGADPCDTAYQIHKCYHDEN c129041_c0† SGRAFERAKEVDEKCRNENQ-VERAYFEKFIKARIDQVDPPDNYKCFVKCVMVELLALNEQGEFN----IDEEL--ENVPPEIMEEGHRIINACKQT---PGKDACDKAYQMHKCYHNEN c124272_c0 QAQIKQGMKMIRSSCQPKSG-ASTELLNGVQEGQFPE---DRNLKCYMKCVMGMTQAM-KNGQVTPDAAIAHIN--RMLPTDIRARVTAAMEKCRFA---ADGLTDACDIAFAATKCTYEAD c192419_c0 MDQVKQTLKMLRSTCQPKTG-ASMEMVEGVQAGKFPD---DNNLKCYTKCVMGMMQTL-KNGKYKPDSAIQQAK--MLLGGETKDRVIAAMEKCRNA---ADGIEEACEVAFVTTKCIYAAD c86973_c0 MDQLKQAMAMLRKVCQPKTG-AATEVIDAVNGGIFTD---DRKLKCYMKCAMEMVQGMSRDGKLQPDTAIAQVK--KLLPVEVRDRAIAVIEKCRNVQ-QENGGVDGCEVAFIATKCGYEAD c193269_c0† MTQQEMTAKLIRSKCQPETG-ASTEAIEGVLEGKFPD---DRNLKCYMKCAMMMSLTM-RDGKLRTDIALAMAE--KQLGQETKDRVIAAIQKCSNA---DAGLTDPCDIAFAATKCIHDAD c192401_c0 MDQVRQAGKMMRNACLPKTG-VGAETAEAASKGQFDAA--DRKLKCYMKCVMGMMQSV-KNGKYNADASIAMAK--KMLPEGVADRTAAAIEKCRDE---WAKYDDACDASYAVTVCTYKAD c128738_c1† MEEVISTGKVLRNHCQPQVG-ASDESIDAASEGRFSD---DRPFKCYLACMMGLSHSL-KDGKYQADLIIQMAD--DLLPPEISGKVKHVAEKCRNA---GDGIGDQCDMAMALTKCAFDFA c192285_c0† LDEIDKAHMILRKHCQPVTG-VSDDVLDATMKGTFAD---DRNLKCYLACIMGLSHVL-KNGKYRADLAVRLAD--DLLPADLKDKARAVVEKCSTA---ADGLTDECEMAFAIKKCSYAAD Lmig-OBP LEQLRQTSKIVRNMCLKKTG-VDLALVEGIQEGQFPD---NQDLKCYMKCCMGAMQVL-RQGRYNVNAAKNQAD--KMLPPDLKGRFIDMLDACSDR---GDGVDDDCEMAYQLTKCSYETD Dmel-LUSH MEQFLTSLDMIRSGCAPKFK-LKTEDLDRLRVGDFNFP-PSQDLMCYTKCVSLMAGTVNKKGEFNAPKALAQLP--HLVPPEMMEMSRKSVEACRDT---HKQFKESCERVYQTAKCFSENA Bmor-GOBP1 MKDVTLGFGQALEQCREESQLTEEKMEEFFHFWNDDFKFEHRELGCAIQCMSRHFNLLTDSSRMHHENTDKFIKS-FPNGEILSQKMIDMIHTCEKT---FDSEPDHCWRILRVAECFKDAC Bmor-PBP MKNLSLNFGKALDECKKEMTLTDAINEDFYNFWKEGYEIKNRETGCAIMCLSTKLNMLDPEGNLHHGNAMEFAKK-HGADETMAQQLIDIVHGCEKS---TPANDDKCIWTLGVATCFKAEI * * * : .. . * : * *
c125410_c0 DKPKEYTTKYDNVDVERILSNGRILTNYIKCMLDEGPCTPEGRELKKTLPDALQTGCEKCSEKQKSTSERVIRHLMKERSKDWERLLNKFDPKGEYRQKYEAFAE Hpar-CSP7 AQNR-YTTRYDSIDVDRILSNQRILTNYLKCLMDEGPCTNEGRELKKTLPDALANGCGKCNEKQKSSAEKVIRHLIKNRSNDWKRLTAKYDPTGQYRKKYEAQYN Acer-CSP VIAEDYTTKYDDMDIDRILQNGRILTNYIKCMLDEGPCTNEGRELKKILPDALSTGCNKCNEKQKHTANKVVNYLKTKRPKDWERLSAKYDSTGEYKKRYEHVLQ Bmor-CSP1 LADDKYTDKYDKINLQEILENKRLLESYMDCVLGKGKCTPEGKELKDHLQEALETGCEKCTEAQEKGAETSIDYLIKNELEIWKELTAHFDPDGKWRKKYEDRAK Bmor-CSP2 VVIARPKTPFDNINIEEIFENRRLLLGYINCILERGNCTRAGKDLKSSLKNVLEENCDKCSEDQRKSIIKVINYLVSSEPESWNQLKSKYDPEGKYLIKYEAKME Dmel-EjB3 AAEDKYTTKYDNIDVDEILKSDRLFGNYFKCLVDNGKCTPEGRELKKSLPDALKTECSKCSEKQRQNTDKVIRYIIENKPEEWKQLQAKYDPDEIYIKRYRATAE Dmel-OS-D MVEQAYDDKFDNVDLDEILNQERLLINYIKCLEGTGPCTPDAKMLKEILPDAIQTDCTKCTEKQRYGAEKVTRHLIDNRPTDWERLEKIYDPEGTYRIKYQEMKS Znev-EjB3 VSAQNGSSKYEYVDVDALLSNHRTLNNYVNCVLDKGPCTPEGRDLKEYMPRALTTACADCTRSQKHFIRKAASYVMKNRPRDWDEIVKKYNPQGKYRESFYRFLA c192656_c0 AMPASSQVDFATMDIGALTQDDNRITKLLSCFLDNSDCGEEELTVKAGLREVFDSRCEGCTQERKTQIKNFFSYIKTNRPDDWVRLKAKCDPTGERQEIWKQILA : ::: : .. . : ..*. . * :* : .: * *.. :. :: .. * .: :. :
A
B
Figure 6 Alignment of the partial amino acid sequence ofCoptotermes formosanusOBPs and CSPs with that from other insects. Grey boxes show conserved cysteines. (A) Alignment of eleven C. formosanusputative classical OBPs with other insects. The symbol†represent DEGs. (B) Alignment of twoC. formosanusputative CSPs with other insects.
(Maleszka & Stange, 1997;McKenna et al., 1994). Thus, the up-regulation of c125410_c0 may be in response to increased carbon dioxide.
Odorant stimulation of olfactory receptor neurons results in a calcium influx modulating
signal transduction pathways (Ronnett & Moon, 2002). Therefore, elevated CO2levels may
affect elements in signal transduction pathways. According to KEGG annotation, we found that four genes annotated as calmodulin in the olfactory transduction pathway (ko04740) were significantly down-regulated in T4 compared to T1, T2 and T3. Among them, calmodulin c181311_c0 had the highest FPKM value in all libraries, indicating that it is a major, common gene in the pathway. It encodes for a protein of 170 amino acids, characterized with two EF-hand or calcium binding motifs. There is evidence in
the literature that the inhibition of calmodulin gene expression eliminates the CO2gating
sensitivity of connexin channels (Peracchia et al., 2003). Our results show that high CO2
concentration significantly suppresses calmodulin gene expression, while medium and low
CO2 concentration have slight effect on the gene. However, the link between CO2 and
calmodulin as well as the underlying mechanism need more experiments to illustrate.
CONCLUSION
Overall, we have identified 2,936 genes with dynamic regulation under elevated CO2
conditions belonging to diverse pathways, mainly metabolic processes and signal
transduction. The candidate chemosensory proteins were also identified inC. formosanus,
number of candidate genes that may be used as starting point to dissect the gene regulatory
network involved in termite responses to CO2.
ACKNOWLEDGEMENTS
The authors thank the Biomarker Biotechnology Corporation (Beijing, China) for assisting with transcriptome sequencing. We are grateful to all people who in any way contributed to the development of this work.
ADDITIONAL INFORMATION AND DECLARATIONS
Funding
This research was supported by the National Natural Science Foundation of China (NSFC) (31172163), Funds for Environment Construction & Capacity Building of GDAS’ Research Platform (2016GDASPT-0107), and Science and Technology Planning Project of Guangzhou city, China (201510010036). The funders had no role in study design, data collection and analysis, decision to publish, or preparation of the manuscript.
Grant Disclosures
The following grant information was disclosed by the authors: National Natural Science Foundation of China (NSFC): 31172163.
Environment Construction & Capacity Building of GDAS’ Research Platform: 2016GDASPT-0107.
Science and Technology Planning Project: 201510010036.
Competing Interests
The authors declare there are no competing interests.
Author Contributions
• Wenjing Wu conceived and designed the experiments, performed the experiments,
analyzed the data, contributed reagents/materials/analysis tools, wrote the paper, prepared figures and/or tables, reviewed drafts of the paper.
• Zhiqiang Li conceived and designed the experiments, analyzed the data, wrote the paper,
reviewed drafts of the paper.
• Shijun Zhang contributed reagents/materials/analysis tools.
• Yunling Ke reviewed drafts of the paper.
• Yahui Hou performed the experiments.
DNA Deposition
The following information was supplied regarding the deposition of DNA sequences: All sequence data have been submitted to GenBank Sequence Read Archive databases
under accession numberSRP068272 andSRP068332, and associated with Bioproject
PRJNA308390andPRJNA308507, respectively. Their accessions areSRR3095926for Cfo
(reference transcriptome ofC. formosanus),SRR3097983for T1, SRR3097984for T2,
Data Availability
The following information was supplied regarding data availability:
Transcriptome assembly ofCoptotermes formosanus:
Wu W, Zhiqiang L. 2016. All combination unigenes. Figshare:
https://dx.doi.org/10.6084/m9.figshare.3444866.v1;
Transcriptome annotations of Coptotermes formosanus: Wu W, Zhiqiang L. 2016. All
database annotation. Figshare:https://dx.doi.org/10.6084/m9.figshare.3443930.v1.
Supplemental Information
Supplemental information for this article can be found online athttp://dx.doi.org/10.7717/
peerj.2527#supplemental-information.
REFERENCES
Alexa A, Rahnenführer J. 2009.Gene set enrichment analysis with topGO.Available at
https:// www.bioconductor.org/ packages/ devel/ bioc/ vignettes/ topGO/ inst/ doc/ topGO.
pdf (accessed on 18 January 2016).
Angeli S, Ceron F, Scaloni A, Monti M, Monteforti G, Minnocci A, Petacchi R, Pelosi
P. 1999.Purification, structural characterization, cloning and immunocytochemical
localization of chemoreception proteins fromSchistocerca gregaria.European Journal
of Biochemistry 262:745–754DOI 10.1046/j.1432-1327.1999.00438.x.
Bernklau EJ, Fromm EA, Judd TM, Bjostad LB. 2005.Attraction of subterranean
termites (Isoptera) to carbon dioxide.Journal of Economic Entomology98:476–484
DOI 10.1093/jee/98.2.476.
Brand P, Ramírez SR, Leese F, Quezada-Euan JJG, Tollrian R, Eltz T. 2015.Rapid
evolu-tion of chemosensory receptor genes in a pair of sibling species of orchid bees
(Api-dae: Euglossini).BMC Evolutionary Biology 15:1DOI 10.1186/s12862-015-0451-9.
De Gerenyu VL, Anichkin A, Avilov V, Kuznetsov A, Kurganova I. 2015.
Ter-mites as a factor of spatial differentiation of CO2fluxes from the soils of
mon-soon tropical forests in southern Vietnam.Eurasian Soil Science48:208–217
DOI 10.1134/S1064229315020088.
Fan J, Francis F, Liu Y, Chen J, Cheng D. 2011.An overview of odorant-binding protein
functions in insect peripheral olfactory reception.Genetics and Molecular Research
10:3056–3069DOI 10.4238/2011.December.8.2.
Fang S, Hu B, Zhou Q, Yu Q, Zhang Z. 2015.Comparative analysis of the silk gland
transcriptomes between the domestic and wild silkworms.BMC Genomics16:60
DOI 10.1186/s12864-015-1287-9.
Garg R, Patel RK, Tyagi AK, Jain M. 2011.De novo assembly of chickpea transcriptome
using short reads for gene discovery and marker identification.DNA Research
18:53–63DOI 10.1093/dnares/dsq028.
Gillies M. 1980.The role of carbon dioxide in host-finding by mosquitoes (Diptera:
Culi-cidae): a review.Bulletin of Entomological Research70:525–532
Götz S, García-Gómez JM, Terol J, Williams TD, Nagaraj SH, Nueda MJ, Robles M,
Talón M, Dopazo J, Conesa A. 2008.High-throughput functional annotation
and data mining with the Blast2GO suite.Nucleic Acids Research36:3420–3435
DOI 10.1093/nar/gkn176.
Grabherr MG, Haas BJ, Yassour M, Levin JZ, Thompson DA, Amit I, Adiconis X,
Fan L, Raychowdhury R, Zeng Q. 2011.Full-length transcriptome assembly from
RNA-Seq data without a reference genome.Nature Biotechnology29:644–652
DOI 10.1038/nbt.1883.
Guerenstein PG, Hildebrand JG. 2008.Roles and effects of environmental carbon
diox-ide in insect life.Annual Review of Entomology53:161–178
DOI 10.1146/annurev.ento.53.103106.093402.
Guerenstein PG, Yepez EA, Van Haren J, Williams DG, Hildebrand JG. 2004.Floral
CO2emission may indicate food abundance to nectar-feeding moths.Die
Naturwis-senschaften91:329–333DOI 10.1007/s00114-004-0532-x.
Haas BJ, Papanicolaou A, Yassour M, Grabherr M, Blood PD, Bowden J, Couger MB,
Eccles D, Li B, Lieber M. 2013.De novotranscript sequence reconstruction from
RNA-seq using the Trinity platform for reference generation and analysis.Nature
Protocols8:1494–1512DOI 10.1038/nprot.2013.084.
Hallem EA, Dahanukar A, Carlson JR. 2006.Insect odor and taste receptors.Annual
Review of Entomology51:113–135DOI 10.1146/annurev.ento.51.051705.113646.
Jones WD, Cayirlioglu P, Kadow IG, Vosshall LB. 2007.Two chemosensory receptors
together mediate carbon dioxide detection inDrosophila.Nature445:86–90
DOI 10.1038/nature05466.
Kanehisa M, Goto S, Kawashima S, Okuno Y, Hattori M. 2004.The KEGG
re-source for deciphering the genome.Nucleic Acids Research32:D277–D280
DOI 10.1093/nar/gkh063.
Koonin EV, Fedorova ND, Jackson JD, Jacobs AR, Krylov DM, Makarova KS, Mazumder R, Mekhedov SL, Nikolskaya AN, Rao BS, Rogozin IB, Smirnov S,
Sorokin AV, Sverdlov AV, Vasudevan S, Wolf YI, Yin JJ, Natale DA. 2004.A
com-prehensive evolutionary classification of proteins encoded in complete eukaryotic
genomes.Genome Biology5:1–28DOI 10.1186/gb-2004-5-2-r7.
Kwon JY, Dahanukar A, Weiss LA, Carlson JR. 2007.The molecular basis of CO2
reception inDrosophila.Proceedings of the National Academy of Sciences of the United
States of America104:3574–3578DOI 10.1073/pnas.0700079104.
Leal WS. 2013.Odorant reception in insects: roles of receptors, binding
pro-teins, and degrading enzymes.Annual Review of Entomology58:373–391
DOI 10.1146/annurev-ento-120811-153635.
Leng N, Dawson JA, Thomson JA, Ruotti V, Rissman AI, Smits BM, Haag JD, Gould
MN, Stewart RM, Kendziorski C. 2013.EBSeq: an empirical Bayes hierarchical
model for inference in RNA-seq experiments.Bioinformatics29:1035–1043
Li B, Dewey CN. 2011.RSEM: accurate transcript quantification from
RNA-Seq data with or without a reference genome.BMC Bioinformatics12:323
DOI 10.1186/1471-2105-12-323.
Lin CY, Lovén J, Rahl PB, Paranal RM, Burge CB, Bradner JE, Lee TI, Young RA. 2012.
Transcriptional amplification in tumor cells with elevated c-Myc.Cell151:56–67
DOI 10.1016/j.cell.2012.08.026.
Livak KJ, Schmittgen TD. 2001.Analysis of relative gene expression data using
real-time quantitative PCR and the 2−11CTmethod.Methods25:402–408
DOI 10.1006/meth.2001.1262.
Lovén J, Orlando DA, Sigova AA, Lin CY, Rahl PB, Burge CB, Levens DL, Lee TI,
Young RA. 2012.Revisiting global gene expression analysis.Cell151:476–482
DOI 10.1016/j.cell.2012.10.012.
Maleszka R, Stange G. 1997.Molecular cloning, by a novel approach, of a cDNA
encoding a putative olfactory protein in the labial palps of the mothCactoblastis
cactorum.Gene202:39–43DOI 10.1016/S0378-1119(97)00448-4.
McKenna MP, Hekmat-Scafe DS, Gaines P, Carlson JR. 1994.PutativeDrosophila
pheromone-binding proteins expressed in a subregion of the olfactory system.The
Journal of Biological Chemistry269:16340–16347.
Nakagawa T, Pellegrino M, Sato K, Vosshall LB, Touhara K. 2012.Amino acid residues
contributing to function of the heteromeric insect olfactory receptor complex.PLoS
ONE7:e32372DOI 10.1371/journal.pone.0032372.
Nicolas G, Sillans D. 1989.Immediate and latent effects of carbon dioxide on insects.
Annual Review of Entomology34:97–116DOI 10.1146/annurev.en.34.010189.000525.
Nielsen MG, Christian K. 2007.The mangrove ant,Camponotus anderseni, switches to
anaerobic respiration in response to elevated CO2levels.Journal of Insect Physiology
53:505–508DOI 10.1016/j.jinsphys.2007.02.002.
Pelosi P, Calvello M, Ban L. 2005.Diversity of odorant-binding proteins and
chemosen-sory proteins in insects.Chemical Senses30:i291–i292DOI 10.1093/chemse/bjh229.
Pelosi P, Zhou J-J, Ban L, Calvello M. 2006.Soluble proteins in insect chemical
commu-nication.Cellular and Molecular Life Sciences63:1658–1676
DOI 10.1007/s00018-005-5607-0.
Peracchia C, Young K, Wang X, Peracchia L. 2003.Is the voltage gate of connexins CO2
-sensitive? Cx45 channels and inhibition of calmodulin expression.The Journal of
Membrane Biology195:53–62DOI 10.1007/s00232-003-2044-6.
Robertson HM, Wanner KW. 2006.The chemoreceptor superfamily in the honey bee,
Apis mellifera: expansion of the odorant, but not gustatory, receptor family.Genome Research16:1395–1403DOI 10.1101/gr.5057506.
Ronnett GV, Moon C. 2002.G proteins and olfactory signal transduction.Annual Review
of Physiology64:189–222 DOI 10.1146/annurev.physiol.64.082701.102219.
Scharf ME. 2015.Omic research in termites: an overview and a roadmap.Frontiers in
Seeley TD. 1974.Atmospheric carbon dioxide regulation in honey-bee (Apis mellifera)
colonies.Journal of Insect Physiology20:2301–2305
DOI 10.1016/0022-1910(74)90052-3.
Spehr M, Munger SD. 2009.Olfactory receptors: G protein—coupled receptors and
be-yond.Journal of Neurochemistry 109:1570–1583
DOI 10.1111/j.1471-4159.2009.06085.x.
Stange G, Stowe S. 1999.Carbon-dioxide sensing structures in terrestrial arthropods.
Mi-croscopy Research and Technique47:416–427
DOI 10.1002/(SICI)1097-0029(19991215)47:6<416::AID-JEMT5>3.0.CO;2-X.
Sugimoto A, Bignell DE, MacDonald JA. 2000. Global impact of termites on the carbon
cycle and atmospheric trace gases. In: Abe T, Bignell DE, Higashi M, eds.Termites:
evolution, sociality, symbioses, ecology. Dordrecht: Springer Netherlands, 409–435. Suh GS, Wong AM, Hergarden AC, Wang JW, Simon AF, Benzer S, Axel R, Anderson
DJ. 2004.A single population of olfactory sensory neurons mediates an innate
avoidance behaviour inDrosophila.Nature431:854–859 DOI 10.1038/nature02980.
Tatusov RL, Galperin MY, Natale DA, Koonin EV. 2000.The COG database: a tool for
genome-scale analysis of protein functions and evolution.Nucleic Acids Research
28:33–36DOI 10.1093/nar/28.1.33.
Thom C, Guerenstein PG, Mechaber WL, Hildebrand JG. 2004.Floral CO2
re-veals flower profitability to moths.Journal of Chemical Ecology30:1285–1288
DOI 10.1023/B:JOEC.0000030298.77377.7d.
Trapnell C, Williams BA, Pertea G, Mortazavi A, Kwan G, Van Baren MJ, Salzberg
SL, Wold BJ, Pachter L. 2010.Transcript assembly and quantification by RNA-Seq
reveals unannotated transcripts and isoform switching during cell differentiation.
Nature Biotechnology28:511–515DOI 10.1038/nbt.1621.
Xu W, Anderson A. 2015.Carbon dioxide receptor genes in cotton bollwormHelicoverpa
armigera.Naturwissenschaften102:1–9DOI 10.1007/s00114-014-1251-6.
Zhang D, Lax AR, Bland JM, Allen AB. 2011.Characterization of a new endogenous
endo-β-1, 4-glucanase of Formosan subterranean termite (Coptotermes formosanus).
Insect Biochemistry and Molecular Biology41:211–218
DOI 10.1016/j.ibmb.2010.12.006.
Zhang D, Lax A, Henrissat B, Coutinho P, Katiya N, Nierman WC, Fedorova
N. 2012.Carbohydrate-active enzymes revealed inCoptotermes formosanus
(Isoptera: Rhinotermitidae) transcriptome.Insect Molecular Biology 21:235–245
DOI 10.1111/j.1365-2583.2011.01130.x.
Zhou J-J, Field LM, He XL. 2010.Insect odorant-binding proteins: do they offer
an alternative pest control strategy?Outlooks on Pest Management 21:31–34
DOI 10.1564/21feb08.
Ziesmann J. 1996.The physiology of an olfactory sensillum of the termite