Journal of Computer Science 5 (10): 717-724, 2009 ISSN 1549-3636
© 2009 Science Publications
Corresponding Author: C. Manoharan, Principal/Director, VSA Group of Institutions, Salem, Tamil Nadu, India.
Initial Hybrid Method for Analyzing Software Estimation, Benchmarking
and Risk Assessment Using Design of Software
J. Frank Vijay and C. Manoharan
Department of Computer Science and Engineering,
SRM Valliammai Engineering College, Chennai, Tamil Nadu, India
VSA Group of Institutions, Salem, Tamil Nadu, India
Abstract: Problem statement: Estimation models in software engineering are used to predict some important attributes of future entities such as development effort, software reliability and programmers productivity. Among these models, those estimating software effort have motivated considerable research in recent years. Approach: In this study we discussed an available work on the effort estimation methods and also proposed a hybrid method for effort estimation process. As an initial approach to hybrid technology, we developed a simple approach to SEE based on use case models: The “use case point’s method”. This method is not new, but has not become popular although it is easy to understand and implement. We therefore investigated this promising method, which was inspired by function points analysis. Results: Reliable estimates can be calculated by using our method in a short time with the aid of a spreadsheet. Conclusion: We are planning to extend its applicability to estimate risk and benchmarking measures.
Key words: Effort estimation, effort refinement, function points, use case points, risk assessment, hybrid method
INTRODUCTION
The planning, monitoring and control of software development projects require that effort and costs be adequately estimated. However, some forty years after the term “Software Engineering” was coined[27], effort estimation still remains a challenge for practitioners and researchers alike. There is a large body of literature on software effort estimation models and techniques in which a discussion on the relationship between software size and effort as a primary predictor has been included[1,2,4].They conclude that the models, which are being used by different groups and in different domains, have still not gained universal acceptance[19]. As a role of software in the society becomes larger and more important, it becomes necessary to develop a package which is used to estimate effort within a short period. In order to achieve this goal, the entire software development processes should be managed by an effective model[16]. So, our proposed model will be focusing on three basic parameters: (1) software estimation, (2) benchmarking, (3) risk Assessment[32]. So far, several models and techniques have been proposed and developed[6,9,12] and most of them include “Software Size” as an important parameter[23]. Figure 1 shows the application of software engineering principles and standards in medium sized organizations.
Fig. 1: The application of software engineering standards in very small enterprises[6,9,12]
Use case Model can be used to predict the size of the future software system at an early development stage to estimate the effort in the early phases of software development; use case point method has been proposed[13,20]. Use case Point Method is influenced by the Function Points Methods and is based on analogous use case point[11,22].
system (e.g., using tri-modular redundancy to satisfy the availability requirements, a dynamic load-balancing mechanism to meet the performance requirements and a 256 bit encryption scheme to satisfy the security requirements). Each architecture A that results from a set {Ai} of architectural decisions has a different set of costs C{Ai} (Fig. 2). The choice of a particular set of architectural decisions maps to system qualities that can be described in terms of a particular set of stimulus/response characteristics of the system {Qi}, i.e., Ai -> Qi. (For example, the choice of using concurrent pipelines for servicing requests in this system leads to a predicted worst-case latency of 500 ms, given a specific rate of server requests.) The “value” of any particular stimulus/response characteristic chosen is the revenue that could be earned by the product in the marketplace owing to that characteristic. We believe that the software architect should attempt to maximize the difference between the value generated by the product and its cost.
Fig. 2: Business goals drive the architectural decisions {Ai}, which determine the quality attributes {Qi}.Value (Va) depends on Qi and Cost(C) depends on Ai
environments used[15,22]. In Function Point, it is very much essential to use the detailed information about the software. Such detailed information will be available in software design specification. Function Point metric evaluation is difficult to estimate for software which has short development time[11,25]. So, in reality estimation of software at the earlier phase of the development life cycle process will certainly reduces risk. To estimate the effort in the earlier phase of the development life cycle process, use case point method has been proposed[20].
MATERIALS AND METHODS
Use case model: The first and the foremost step are to calculate Use Case Point (UCP) from use case model[20]. The use case model mainly consists of two documents, system or sub system documents and use case documents contains the following description of items: system name, risk factors, system-level use case diagram,, architecture diagram, subsystem descriptions, use case name, brief description, context diagram, preconditions, flow of events, post conditions, subordinate use case diagrams, subordinate use cases, activity diagram, view of participating classes, sequence diagrams, user interface, business rules, special requirements and other artifacts[14].
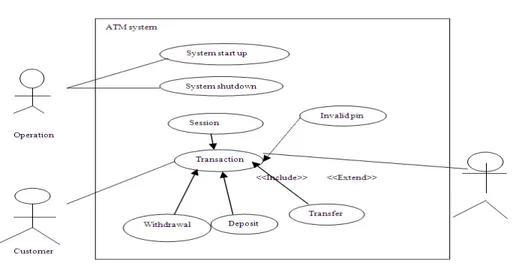
From the above specified information we are going to focus mainly on two parameters system-level use case diagram and flow of events. System-level use case diagram includes one or more use case diagrams showing all the use cases and actors in the system[14]. Figure 3 shows an example of system level use case diagram for “ATM systems”:
• A session is started when a customer inserts an ATM card into the card reader slot of the machine • The ATM pulls the card into the machine and
Fig. 3: Use case diagram
• If the reader cannot read the card due to improper insertion or damaged stripe, the card is ejected, an error screen is displayed and the screen is aborted • The customer is asked to enter his/her PIN and is
then allowed to perform one or more transactions, choosing from a menu of possible types of transaction in each case
Counting use case point: Intuitively, UCP is measured
by counting the number of actors and transactions included in the flow of events with some weight. A transaction is an event that occurs between an actor and the target system, the event being performed entirely or not at all. But, in our method the effort estimation is calculated by applying the following procedure.
Procedure 1:
Counting actors weight: The actors in the use case are categorized as simple, average or complex. A simple actor represents another system with a defined API. An average actor is either another system that interacts through a protocol such as TCP/IP or it is a person interacting through a text based interface. A complex actor is a person interacting through a GUI interface.
The number of each actor type that the target software includes is calculated and then each number is multiplied by a weighting factor shown in Table 1. Finally, actor’s weight is calculated by adding those values together.
Procedure 2:
Counting use case weights: Each use case should be categorized into simple, average or complex based on the number of transactions including the alternative paths. A simple use case has 3 or fewer transactions, an average use case has 4-7 transactions and a complex use case has more than 7 transactions.
Table 1: Counting actors weight
Type Description Factor
Simple Program interface 1
Average Interactive, or protocol driver 2
Complex Graphical user interface 3
Table 2: Transaction based weighting factors
Type Description Factor
Simple 3 or fewer transactions 5
Average 4 to 7 transactions 10
Complex More than 7 transactions 15
Then, the number of each use case type is counted in the target software and then each number is multiplied by a weighting factor shown in Table 2.
Finally, use case weight is calculated by adding these values together.
Procedure 3:
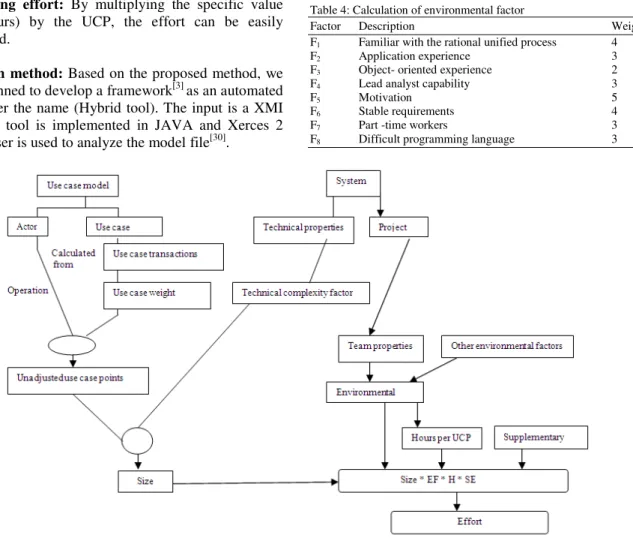
Calculating unadjusted use case points: It is
calculated by adding the total weight for actors to the total for use cases (Fig. 4).
Procedure 4:
Weighting technical and environmental factors: The
UUCP are adjusted based on the values assigned to a number of technical and environmental factors shown in Table 3 and 4.
Method: Each factor is assigned a value between 0 and
5 depending on its assumed influence on the project. A rating of 0 means the factor is irrelevant for this project and 5 means it is essential.
Calculating UCP: Use case point (adjusted) is calculated by:
UCP = UUCP * TCF * EF (3)
Procedure 6:
Estimating effort: By multiplying the specific value (man-hours) by the UCP, the effort can be easily calculated.
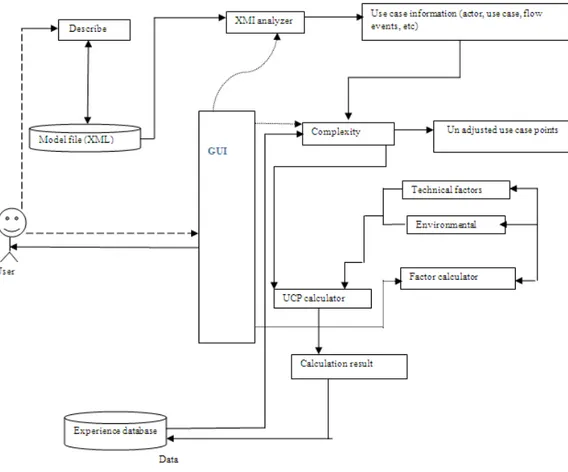
Research method: Based on the proposed method, we
have planned to develop a framework[3] as an automated tool under the name (Hybrid tool). The input is a XMI file. The tool is implemented in JAVA and Xerces 2 Java parser is used to analyze the model file[30].
T7 Easy to use 5
T8 Portable 2
T9 Easy to change 5
T10 Concurrent 1
T11 Includes special security features 4
T12 Provides direct access for third parties 2
T13 User training facilities required 2
Table 4: Calculation of environmental factor
Factor Description Weight
F1 Familiar with the rational unified process 4
F2 Application experience 3
F3 Object- oriented experience 2
F4 Lead analyst capability 3
F5 Motivation 5
F6 Stable requirements 4
F7 Part -time workers 3
F8 Difficult programming language 3
Fig. 6: Automated tool
it is necessary to judge the complexity of actors and use cases by manually (Fig. 5). The judgment is the most important part in software cost estimation so we have decided to create an automated tool. So, in order to obtain the entire procedure automatically, it is mandatory to describe a set of rules to classify the weight for actor and use case.
Also, it is necessary to write the Use-Case Model in machine-readable format. So, we assume that the use case model is written in XMI (XML) Metadata Interchange[30]. The reason for choosing this type of file format is because most case tools for writing UML diagrams support to export them as XMI files[30].
Rules for weighting actors: The weight for each action is determined by the interface between actor and the target software. But, the interface information will not be available in the actor description. Only the name of the actor will be available. So, it is very much essential to create a protocol which determines the complexity of actor.
Step 1:
Classification based on actor’s name: At the initial stage of the classification we are going to determine whether the actor is a person or an external system based on the name of the actor. That is, beforehand, we prepare the list of keywords which can be included in the name of the software system.
For example the keywords “system” and “server” are used in the system’s name.
Keywords for step 1 (KLa):
System, server, application, tool (4)
We are planning to initially start the automated tool with a minimal set of keywords. As on later stages, the new keywords will be updated automatically and can be used for later projects.
Step 2:
Keywords for complex actor (KL ca):
Press, push, select, show, GUI, window (7)
Keywords for simple actor (KL sa):
Request, send, inform (8)
Step 3:
Classification based on experience data: Suppose, if we are unable to determine the actor’s weight at step 2, we determine it based on the experience data. The experience data includes the information about the use case model and the use case point developed in the past software projects.
Rules for weighting use cases: The complexity of use
case is determined by the number of transactions. So, we have decided to focus on the flow of events in the use case model. The simplest way to count the transaction is to count the number of events. There are no standard procedures or protocols to write the flow of events and it is also quite possible that several transactions are described in one event. So, because of this limitation several guidelines to write events in use case model have been proposed[14]. There are ten guidelines to write a successful scenario. Among them, we focus on the following two guidelines:
(G1) Use a simple grammar
(G2) Include a reasonable set of actions (9)
Jacobson suggests the following four pieces of compound interactions should be described:
• The primary actor sends request and data to the system
• The system validates the request and the data • The system alters its internal state
• The system responds to the actor with the result
one that related to actor’s operation and system (11) response as a transaction
For each use case, we have to apply the above said rules and based on these rules, we get the number of transactions. Then, based on the number of transactions we determine the complexity of each use-case.
RESULTS
In order to evaluate the usefulness of the automated tool, we applied it to actual use case models developed in software companies. We collected use case models from five software projects where middle-size application programs were developed[14,18]. All use case models were developed on a UML Design tool “Describe”[35]. In the evaluation, we focused in the results of the automatic complexity classification of actors and use cases. So, we compared the measurement results calculated by our tool and ones calculated by a specialist of use case point counting.
DISCUSSION
Here, we discuss the following points: validity and the limitation of our results:
Language: The input use case models to the automated tool must be written in English.
CONCLUSION
This study has proposed an automated Hybrid tool which calculates Use Case Points from Use Case Models in XMI files[30]. We will use the effort estimation based on this Hybrid Tool in the hybrid technology proposed for risk assessment and benchmarking. We will also extend this technique for developing an automated tool for assessing risk and benchmarking.
REFERENCES
1. Albrecht, A.J. and J.E. Gaffney, 1983. Software function, source lines of codes and development effort prediction: A software science validation. IEEE Trans. Software Eng., SE-9: 639-648. http://portal.acm.org/citation.cfm?id=1313875 2. Alistair Cockburn, 2000. Writing effective use
cases. Addison-Wesley Longman Publishing Co., Inc. Boston, MA., USA., ISBN: 10: 0201702258, pp: 304.
3. Boehm, B.W., D.J. Reifer, E. Horowitz, C. Abts, A.W. Brown, S. Chulani and D. Reifer et al., 2000. Software Cost Estimation with Cocomo II. Prentice Hall, New Jersey, ISBN: 10: 0130266922, pp: 544. 4. Boehm, B.W., 1981. Software Engineering
Economics. Prentice-Hall, USA., ISBN: 13: 9780138221225, pp: 767.
5. T.E. Hastings, A.S.M. Sajeev, 2001. A vector-based approach to software size measurement and effort estimation. IEEE Trans. Software Eng., 27: 337-350. DOI: 10.1109/32.917523
6. Boehm, B., B. Clark, E. Horowitz, C. Westland, R. Madachy and R. Selby, 1995. Cost models for future software life cycle processes. Ann. Software Eng., 1: 57-94. DOI: 10.1007/BF02249046
7. Anda, B., H. Dreiem, D.I.K. Sjoberg and M. Jorgensen, 2001. Estimating Software development effort based on use cases-experiences from industry. Proceedings of the 4th International Conference on the Unified Modeling Language, Modeling Languages, Concepts and Tools, Oct. 1-5, Springer-Verlag, London, UK., pp: 487-502. http://portal.acm.org/citation.cfm?id=719453 8. Chen, Y. and B. Boehm, 2004. An empirical study
of eservices product UML sizing metrics. Proceeding of the 2004 International Symposium on Empirical Software Engineering, Aug. 19-20, Redondo Beach, California, pp: 199-206. DOI: 10.1109/ISESE.2004.1334907
9. Common Software Measurement International Consortium, 2000. Advancing software functional size measurement. COSMIC-FFP Version 2.0. http://www.Cosmicon.com/
10. Symons, C.R., 1991. Software Sizing and Estimating: Mk II Function Point Analysis. John Wiley and Sons, USA., ISBN: 13: 978-0471929857, pp: 218.
11. Symons, C.R., 1988. Function point analysis: Difficulties and improvements. IEEE Trans. Software Eng., 14: 2-11. DOI: 10.1109/32.4618 12. Walston, C.E. and C.P. Felix, 1977. A Method of
program measurement and estimation. IBM Sys. J., 16: 54-73.
13. Schneider, G. and J.P. Winters, 2001. Applying Use Cases. 2nd Edn., Addison Wesley, ISBN: 13: 978-0201708530, pp: 240.
14. Jorgensen, M. and K. Molokken-Ostvold, 2004. Impact of respondent role, information collection approach and data analysis method. IEEE Trans. Software Eng., 30: 993-1007. DOI: 10.1109/TSE.2004.103
15. International Function Point Users Group, 2008. Function point counting practices manual. http://www.ifpug.org/publications/manual.htm 16. Asundi, J., 2005. The need for effort estimation
models for open source software projects. Proceedings of the 5th Workshop on Open Source Software Engineering, May 17, ACM Press, St. Louis, Missouri, USA., pp: 1-3. http://portal.acm.org/citation.cfm?id=1083260 17. Jeffery, R., M. Ruhe and I. Wieczorek, 2000. A
comparative study of two software development cost modeling techniques using multi-organizational and company-specific data. Inform. Software Technol., 42: 1009-1016. DOI: 10.1016/S0950-5849(00)00153-1
18. Jørgensen, M. and K. Molokken-Ostvold, 2004. Reasons for software effort estimation error: Of respondent role, information collection approach and data analysis method. IEEE Trans. Software
Eng., 30: 993-1007.
http://portal.acm.org/citation.cfm?id=1042423 19. Jørgensen, M. and T.M. Gruschke, 2005. Industrial
use of formal software cost estimation models: Expert estimation in disguise?. Proceeding of the Em Assessment in Software Engineering, Apr. 11-13, Keele, United Kingdom, pp: 1-7. http://simula.no/research/engineering/publications/ Jorgensen.2005.1/simula_pdf_file
20. Smith, J., 1999. The estimation of effort based on use cases.
productivity measurement using multiple size measures. IEEE Trans. Software Eng., 30: 1023-1035. http://ieeexplore.ieee.org/search/wrapper.jsp?arnu mber=1377195
24. Briand, L.C., K.El Emam and F. Bomarius, 1998. COBRA: A hybrid method for software cost estimation, benchmarking and risk assessment. Proceedings of the 20th International Conference on Software Engineering, Apr. 19-25, IEEE Xplore Press, USA., pp: 390-399. DOI: 10.1109/ICSE.1998.671392
25. Al-Hajri, M.A., A.A.A. Ghani, M.S. Sulaiman and M.H. Selamat, 2005. Modification of standard function point complexity weights system. J. Syst.
Software, 74: 195-206.
http://portal.acm.org/citation.cfm?id=1045934 26. Arnold, M. and P. Pedross, 1998. Software size
measurement and productivity rating in a large scale software development department. Proceedings of the 20th international conference on Software engineering,April 19-25, IEEE Computer Society, Washington, DC., USA., pp: 490-493. http://portal.acm.org/citation.cfm?id=302163.302221 27. Jorgensen, M. and M. Shepperd, 2007. A
syestematic review of software development cost estimation studies. Software Eng. IEEE Trans., 33: 33-53. DOI: 10.1109/TSE.2007.3
32. Dekkers, T., Benchmarking is an essential control mechanism for management. RPM-AEMES, 2007, pp. 99-103, http://pi.informatik.uni-siegen.de/stt/25_4/09_Konferenzberichte/Dumke_ Abran.pdf.
33. Basili, V.R. and K. Freburger, 1981. Programming measurement and estimation in the software engineering laboratory. J. Syst.
Software, 2: 47-57.
https://www.cs.umd.edu/~basili/publications/journ als/J12.pdf
34. Xiaa, W., L.F. Capretz, D. Ho and F. Ahmed, 2008. A new calibration for function point complexity weights. Inform. Software Technol., 50: 670-683.
http://portal.acm.org/citation.cfm?id=1365282 35. Embarcadero Technologies, Inc. All products.
![Fig. 1: The application of software engineering standards in very small enterprises [6,9,12]](https://thumb-eu.123doks.com/thumbv2/123dok_br/18168875.329711/1.918.486.782.569.726/fig-application-software-engineering-standards-small-enterprises.webp)