Bioelectrical impedance spectroscopy
for the assessment of body fluid
volumes of term neonates
1Programa de Engenharia Biomédica, COPPE, and 2Departamento de Engenharia
Eletrônica, Universidade Federal do Rio de Janeiro, Rio de Janeiro, RJ, Brasil D.M. Ferreira1
and M.N. Souza1,2
Abstract
The assessment of fluidvolume in neonates by a noninvasive, inex-pensive, and fast method can contribute significantly to increase the quality of neonatal care. The objective of the present study was to calibrate an acquisition system and software to estimate the bioelectri-cal impedance parameters obtained by a method of bioelectribioelectri-cal impedance spectroscopy based on step response and to develop spe-cific equations for the neonatal population to determine body fluid compartments. Bioelectric impedance measurements were performed by a laboratory homemade instrument. The volumes were estimated in a clinical study on 30 full-term neonates at four different times during the first month of life. During the first 24 hours of life the total body water, extracellular water and intracellular water were 2.09 ± 0.25, 1.20 ± 0.19, and 0.90 ± 0.25 liters, respectively. By the 48th hour they were 1.87 ± 0.27, 1.08 ± 0.17, and 0.79 ± 0.21 liters, respectively. On the 10th day they were 2.02 ± 0.25, 1.29 ± 0.21, and 0.72 ± 0.14 liters, respectively, and after 1 month they were 2.34 ± 0.27, 1.62 ± 0.20, and 0.72 ± 0.13 liters, respectively. The behavior of the estimated volume was correlated with neonatal body weight changes, leading to a better interpretation of such changes. In conclusion, this study indicates the feasibility of bioelectrical impedance spectroscopy as a method to help fluid administration in intensive care neonatal units, and also contribute to the development of new equations to estimate neonatal body fluid contents.
Correspondence
M.N. Souza
Programa de Engenharia Biomédica COPPE, UFRJ
Caixa Postal 68510 21945-970 Rio de Janeiro, RJ Brasil
Fax: +55-21-2562-8591 E-mail: [email protected]
Research supported by PRONEX, CAPES, CNPq, and Universidade Federal do Rio de Janeiro.
Received January 14, 2004 Accepted July 27, 2004
Key words
•Bioelectrical impedance spectroscopy
•Body water •Extracellular water •Intracellular water •Neonatal handling
Introduction
Neonatal care has a strong influence on child development and survival, especially in the case of low body weight newborns who are considered to be at risk. Among several kinds of neonatal care, water balance monitoring has become important for preterm neonates because they show variable needs of fluid replacement. A reduced fluid intake can cause dehydration, electrolyte imbalance,
and arterial hypotension. On the other hand, an excessive fluid intake can cause peripher-al edema, patent ductus arteriosus, conges-tive heart failure, bronchopulmonary dyspla-sia, cerebral intraventricular hemorrhage, and necrotizing enterocolitis (1).
changes in extracellular volume are observed without an alteration in total body volume, weight is not a reliable parameter to monitor fluid balance. Because different variables can affect neonatal fluid volumes, fluid re-quirements must be based on the individual need of each baby. Thus, a noninvasive tech-nique to measure TBW, as well as its com-partments, can contribute to improving neo-natal care.
The original studies using whole-body impedance as a measure of TBW were pub-lished a number of years ago by Thomasset (2). At present, bioelectrical impedance anal-ysis is probably the method most frequently used due to the relatively inexpensive cost of the basic instrument, its easy operation, and its portability.
Bioelectrical impedance measures electric parameters (i.e., resistance and reactance) and this information is converted to a volume esti-mate based on the conductor volume prin-ciple. This theory assumes that the body can be modeled as a cylinder filled with a conductive material with constant resistivity, with a length that is proportional to the subject’s height (Ht). The conducting volume is assumed to be pro-portional to the Ht2/R ratio, called the
impe-dance index. It should be noted, however, that the human body is not a cylindrical conductor, nor are its tissues electrically isotropic. Due to this limitation, another equation has been used by analogy to estimate TBW: a Ht2/R + c,
where a is a proportional specific constant of the population and c is an adjustment constant. Several studies (3-6) include anthropomet-ric predictors (i.e., weight, age, gender, race, waist-to-hip ratio, body mass index) in the equation to obtain a better correlation with gold standards, but many of these equations are population specific and no physiological justification for the added terms has been pro-vided. Bioelectrical impedance equations have been developed for newborn infants and tod-dlers, children and adolescents, and for adults of all ages. The most important of these equa-tions is that they show a good correlation with
TBW measured by gold standard methods (deuterium dilution and H218O dilution).
Hoffer et al. (7) reported a good correla-tion between body impedance and body wa-ter volume (r = 0.92) in adults in various degrees of hydration. Goran et al. (8) showed a correlation (r = 0.88) between TBW meas-ured in 61 children and the equation pro-posed by Kushner and Schoeller (4).
The studies that assessed TBW in neo-nates reported a good correlation with bio-electrical impedance analysis. Tang et al. (9) found a correlation coefficient of 0.996. Mayfield et al. (3) also showed a good corre-lation (r = 0.976) and Wilson et al. (10) reported a correlation of 0.96. Lingwood et al. (6) developed regression models for the prediction of extracellular volume in preterm neonates and showed a good correlation be-tween bromide space and the resulting equa-tions (r = 0.986).
The present study was carried out to cali-brate the acquisition system and software that estimates the bioelectrical impedance parameters and to develop specific neonatal population equations to estimate intra- and extracellular fluids and TBW from bioelec-trical impedance parameters. The bioelectri-cal impedance parameters were obtained by bioelectrical impedance spectroscopy (BIS) based on a step response (11) instead of the classical method of sinusoidal sweep. The basis of the BIS method will be presented, as well as a description of how the specific equations to estimate the fluid volumes were developed from the set of equations designed for adults and children (12), but not for neonates. The results, obtained in a clinical study involving 30 full-term neonates, were compared with clinical findings, indicating that the method seems to be feasible to as-sess body fluid and could contribute to in-creasing the quality of neonatal care.
Material and Methods
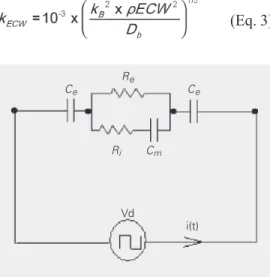
body bioelectrical impedance parameters was the one proposed by Neves and Souza (11) and is based on the current response to a voltage step excitation (illustrated in Figure 1). The figure shows the classical model of whole body bioelectrical impedance con-sisting of Re (extracellular resistance), Ri
(intracellular resistance), and Cm (membrane
capacitance), and also the simplified model of the electrode/tissue interface represented by electrode capacitance (Ce). The major
advantage of this BIS method is the use of a smaller number of signals to characterize the bioelectrical impedance, since only one ex-citation signal scans all frequency compo-nents.
The current response can be expressed by Equation 1, where a faster exponential is associated with the membrane capacitance and a slower one with the electrode capaci-tance.
i(t) = ip (k1e(p1t) + k2e(p2t)) (Eq. 1)
where ip, k1, k2, p1, and p2 are constants
derived from the bioelectrical impedance parameters. For more details concerning the BIS method see Neves and Souza (11).
With this theoretical model of the current
i(t)and its analogous version experimentally obtained in the subject, BIS (Re, Ri, Cm, and
Ce) is estimated using a multiparametric
op-timization procedure. The algorithm to ob-tain the best set of parameters by fitting the theoretical expectation to the experimental data was based on the steepest descending gradient method. The system also supplies the Rinf (parallel association between Re and Ri), which is related to TBW (13).
In the BIS method, a data acquisition card (National Instrument, PCMCIA
DAQCard model AI-16E-4, Autix, TX, USA) installed in a laptop framework is used for the generation of the step voltage excitation and for data acquisition. A specific program has been developed (LabView, National
Instruments) to handle data acquisition and
the estimate of bioelectrical impedance pa-rameters.
In present study, bioelectrical impedance was measured with a prototype apparatus based on the principle described above, which was developed in the Biomedical Instrumen-tation Laboratory, Biomedical Engineering Program, Federal University of Rio de Janei-ro, Rio de JaneiJanei-ro, RJ, Brazil.
After the bioelectrical impedance param-eters were measured, intracellular water (ICW) and extracellular water (ECW) could not be estimated by the original equations of De Lorenzo et al. (12) because they are inappropriate for neonates. This problem led to the development of a new set of equations that will now be presented.
De Lorenzo and colleagues (12) used models based on Hanai mixture theory to estimate body volumes for adults and corre-lated them with gold standard methods. Ac-cording to these investigators, extracellular volumes can be calculated by:
(Eq. 2)
where Ht is subject height (cm), Wt is the weight (kg) and Re the extracellular resis-tance (Ω). The term kECW was assumed to be
constant(kECW = 0.311) and was defined by:
(Eq. 3)
Re
Ce
Ce
Ri Cm
i(t) Vd
Figure 1. Model proposed by Neves and Souza (11) to calcu-late the current response to a voltage step excitation and to derive the bioelectrical impe-dance parameters (see text for
more details). Ce = electrode
ca-pacitance; Cm = membrane
ca-pacitance; Re = extracellular
re-sistance; Ri = intracellular
where ρECW is the resistivity of the
extracel-lular fluid (ρECW = 41 Ω cm), Db is the total
body density (Db = 1.05 kg/l), and KB is a
correcting factor for whole body measure-ment, which is obtained between the wrist and ankle taking into account the relative proportions of the leg, arm and trunk, and height. The term KB is assumed to be
con-stant and equal to 4.3. The extracellular re-sistivity (ρECW), in turn, is obtained by:
ρECW = ρ0 (1 - c)3/2 (Eq. 4)
where ρ0 is the actual resistivity of the
con-ductive material (250 Ω cm) and c is the volumetric concentration of the nonconduc-tive material contained in the mixture (0.672). At low frequencies this concentration can be calculated by:
(Eq. 5)
where VTot is the total body volume (Wt/Db). At high frequencies the volumetric con-centration is estimated by:
(Eq. 6)
Since the extracellular and intracellular resistances (Re and Ri) have been previously estimated by the BIS method, after the extra-cellular volume has been obtained, the intra-cellular volume can be calculated by an iterative procedure that solves Equation 7 for ICW.
(Eq. 7)
In Equation 7 the term kρ, the ratio be-tween the intracellular and extracellular re-sistivity (ρICW/ρECW), is set at 1.4, and the
resistances are expressed in ohm. After the calculation of ECW and ICW, TBW can be
obtained by the simple addition of these two volumes.
The advantage of the approach of De Lorenzo et al.(12) is that it is not based on any specific population. This means that this approach can be used for any subject that presents the constants assumed by De Lorenzo and colleagues, i.e., subjects pre-senting a volumetric concentration of non-conductive material of about 0.672 and a ratio of intracellular to extracellular resistiv-ity of about 1.4. Healthy adults and children normally fulfill these requirements. How-ever, the assumption of these constants for neonates can lead to wrong estimations, be-cause in this population the extracellular volume is higher than the intracellular vol-ume (14-16), and this inversion, differently from the original assumption, modifies these constants.
Based on these considerations, it was important to adapt the equations of De Lorenzo et al. (12) to the neonatal popula-tion. This adaptation was started by calculat-ing a new extracellular resistivity (ρECW) from
several volumetric concentrations (c) re-ported in the literature.
Tables 1 and 2 show the values of the volumetric concentrations c1 and c2 obtained
at low and high frequencies, respectively, for several populations, as well as the basic parameters ( , and ) used to calculate such concentrations in Equa-tions 5 and 6.
The basic assumption was to obtain from information reported in the literature mean values for the concentrations at low and high frequencies and then to derive a global mean concentration to replace the constant (c) origi-nally used by De Lorenzo et al. (12). As shown in Table 1, for adults, the mean con-centration of nonconductive material c, cal-culated as the average between the mean values of c1 and c2, is around 0.59, a value
near the one reported by De Lorenzo et al. (12). However, Table 2 shows that for the neonatal population the mean concentration
of nonconductive material presents a totally different value of about 0.43, justifying modi-fications in ρECW and subsequently in kECW.
With the concentration of nonconductive material set at 0.43, a new ρECW value for the
neonatal population was obtained as:
ρECWN = ρ0 (1- c)3/2 = 250 (1- 0.43)3/2 = 107 Ω cm
(Eq. 8)
where the subscript N stands for the ρECW
value for neonates.
Due to the new value for ρECW, the kECW
constant was modified to:
(Eq. 9)
Table 1. Adult intra- (ICW) and extracellular (ECW) water volumes, weight and volumetric concentration of the nonconductive material.
Study Population (N) (liters) (liters) (kg) c1 c2
Cornish et al.(22) Adults (60) 17.70 ± 3.80 22.10 ± 9.20 69.10 ± 12.70 0.73 ± 0.38 0.40 ± 0.45
Tagliabue et al.(23) Adults (23) 17.70 ± 2.00 27.10 ± 5.01 77.40 ± 11.30 0.76 ± 0.28 0.39 ± 0.30
Armstrong et al. (24) Adults (13) 19.88 ± 3.14 31.12 ± 6.80 80.60 ± 14.70 0.74 ± 0.36 0.34 ± 0.37
De Lorenzo et al. (12) Adults (14) 18.34 ± 2.04 27.13 ± 2.63 74.80 ± 8.83 0.74 ± 0.23 0.36 ± 0.23
Siconolfi et al. (25) Adults (23) 16.00 ± 3.40 20.80 ± 8.51 69.20 ± 14.00 0.76 ± 0.41 0.44 ± 0.47
Aloia et al.(26) Adults (200) 13.20 ± 1.70 18.50 ± 2.80 65.50 ± 9.40 0.79 ± 0.28 0.49 ± 0.29
Ellis and Wong (27) Boys (248) 13.20 ± 6.10 17.50 ± 9.30 47.00 ± 24.30 0.71 ± 1.02 0.31 ± 1.02
Girls (221) 11.30 ± 4.40 12.00 ± 4.60 47.70 ± 20.60 0.75 ± 0.85 0.49 ± 0.84
Maw et al. (28) Adult athletes (7) 20.32 ± 0.63 30.85 ± 1.27 78.02 ± 8.61 0.73 ± 0.20 0.31 ± 0.17
Fellmann et al. (29) Adult athletes (9) 15.80 ± 0.70 25.80 ± 0.80 68.10 ± 2.30 0.76 ± 0.07 0.36 ± 0.07
Gudivaka et al. (30) Adults (14) 15.70 ± 3.20 28.50 ± 3.70 83.00 ± 14.00 0.80 ± 0.34 0.44 ± 0.33
Lichtenbelt and Obese women (30) 17.70 ± 1.60 20.50 ± 2.60 80.00 ± 10.50 0.77 ± 0.25 0.50 ± 0.25
Fogelholm (31)
Jürimäe et al. (32) Adult athletes (12) 23.50 ± 2.20 25.50 ± 2.50 82.00 ± 10.80 0.70 ± 0.25 0.37 ± 0.24
Ritz (33) Adults (35) 18.30 ± 0.50 23.10 ± 0.70 70.30 ± 1.50 0.73 ± 0.04 0.38 ± 0.05
Elderly subjects (68) 15.10 ± 0.40 18.80 ± 0.50 69.10 ± 1.30 0.77 ± 0.04 0.48 ± 0.04
Buchholz et al. (34) Adult women (28) 12.50 ± 5.25 18.10 ± 13.30 59.40 ± 17.65 0.78 ± 0.62 0.46 ± 0.76
Adult men (30) 16.40 ± 6.05 27.40 ± 17.85 74.10 ± 21.20 0.77 ± 0.59 0.38 ± 0.73
Cox-Reijven et al. (35) Obese adults (10) 21.90 ± 2.40 23.50 ± 4.41 133.30 ± 17.00 0.83 ± 0.25 0.64 ± 0.26
Mean ± SD (Adult) 0.76 ± 0.36 0.42 ± 0.38
Mean ± SD (c1 and c2) 0.59 ± 0.37
Data are reported as means ± SD for the number of subjects indicated within parentheses in the Population column. c1= volumetric
concentration of the nonconductive material at low frequency; c2 = volumetric concentration of the nonconductive material at high frequency.
Table 2. Neonate intra- (ICW) and extracellular (ECW) water volumes, weight and volumetric concentration of the nonconductive material.
Study Population (N) (liters) (liters) (kg) c1 c2
MacLaurin (19) Term (26) 0.89 ± 0.02 0.87 ± 0.02 2.46 ± 1.01 0.62 ± 0.67 0.25 ± 0.53
Cassady (36) Term (16) 1.18 ± 0.64 0.99 ± 1.82 3.16 ± 0.52 0.61 ± 0.27 0.28 ± 1.03
Fomon et al. (16) Term ( - ) 1.50 ± - 0.96 ± - 3.5 ± - 0.5 0.3
Singuiet al. (37) Term (55) 0.94 ± 0.11 1.15 ± 0.18 2.84 ± 0.23 0.65 ± 0.19 0.23 ± 0.21
Mean ± SD (neonate) 0.61 ± 0.32 0.25 ± 0.44
Mean ± SD (c1 and c2) 0.43 ± 0.38
Data are reported as means ± SD for the number of subjects indicated within parentheses in the Population column. c1= volumetric
concentration of the nonconductive material at low frequency; c2 = volumetric concentration of the nonconductive material at high frequency.
-, Data not reported.
Weight
ECW ICW
Weight
Therefore, after the changes in the origi-nal constant, the fiorigi-nal equation for the esti-mate of ECW in the neonatal population can be written as:
(Eq. 10)
It should be pointed out that the change in extracellular resistivity (ρECW) leads to a
cor-rection of kρ, since this constant is related to intra- and extracellular resistivities (kρ = ρICW/
ρECW). In this way, the neonatal kρ can be
obtained from its ratio with the kρ for adults.
(Eq. 11) where subscripts N and A indicate the neona-tal and adult values, respectively.
Based on Equation 11, the neonatal kρ
can be calculated by:
(Eq. 12) where kρA = 3.8 was extracted from De
Lorenzo et al. (12), ρECWA/ρECWN = 41/ 107 = 0.38 (based on De Lorenzo et al. (12) and Equation 8, respectively), and ρICWN/
ρICWA was approximated by 1.00,since the intracellular concentration of potassium (the major intracellular ion) is equal in adults and neonates (17).
System calibration
All hardware and the software parts of the system used to estimate the bioelectrical impedance parameters were calibrated using 16 electric models (phantoms) like the one illustrated in Figure 1. The values of the electric components (Ri, Re, Cm, and Ce) for
each phantomwere designed to correspond to values expected for neonates (3,18). The true values of the electric model components were inspected with a digital multimeter 3¾ digit - TEK DMM 254 (Tektronix Inc.,
Beaverton, OR, USA) with an error lower than 0.5 Ω for values of less than 999 Ω, and an error lower than 5 Ω for values greater than 1 kΩ. The root mean square error (RMSE) in the estimation of impedance pa-rameters was obtained by Equation 13:
(Eq. 13)
where X is the real value, Y is the estimated value and N is the number of tests (N = 16).
Subjects of the clinical study
A clinical study was conducted in which bioelectrical impedance and anthropometric measurements were performed in 30 full-term neonates (38.9 ± 1.4 months of gestational age) of both genders. Measurements were per-formed at four different times in each neonate: the first 24 h, 48 h, 10 days, and 1 month. Neonates with any pathology that might change the intra- and/or extracellular volume com-partments (renal dysfunction, congestive heart failure, sepsis, and dehydration) were excluded from the study. The study was approved by the Scientific Ethics Committee of the Central Hospital of the Military Police, Rio de Janeiro, RJ, Brazil, and informed consent was obtained from the parents of the neonates.
Bioelectrical impedance and anthropometric measurements
A digital scale (Urano, Vila Rosa, Canoas,
cor-neum was removed by the standard procedure of 10 wipeswith gauze and alcohol in order to avoid difference in bioelectrical impedance measurements.
The neonate was positioned in dorsal decubitus and data acquisition was performed when the newborn was quiet. If necessary, a person using latex gloves held the neonate. All acquisitions were performed before breast-feeding.
Statistical analysis
In addition to the evaluation of the esti-mation errors of the impedance parameters, the reliability in the measures of the resistive parameters was performed by ANOVA re-peated measures, i.e., the intra-class correla-tion coefficient (R).
Data are reported as means ± SD for each of the four acquisition ages. Significant changes in each variable (Ri, Re, Rinf, TBW, ICW, ECW,
and weight) between the four periods were determined by the univariate repeated meas-ures test (within-subjects factor) with four levels (ANOVA method).The level of signif-icance was set at 5% in all analyses. The Pearson correlation coefficient (r) was calcu-lated to determine the extent to which values of two variables are linearly related to each other. It should be noted that r2 (coefficient of
determination) indicates the proportion of com-mon variation in the two variables. Thus, the variables were considered to show a strong correlation when the proportion of common variation was at least 50%, which implies r
values higher than 0.7. However, the interpre-tation depends on statistical tests, which pro-vide a P value. P < 0.05 was taken to be statistically significant.
Results
Results from the calibration of the acqui-sition system and of the software used to estimate the bioelectrical impedance param-eters are presented in Table 3, together with the respective RMSE.
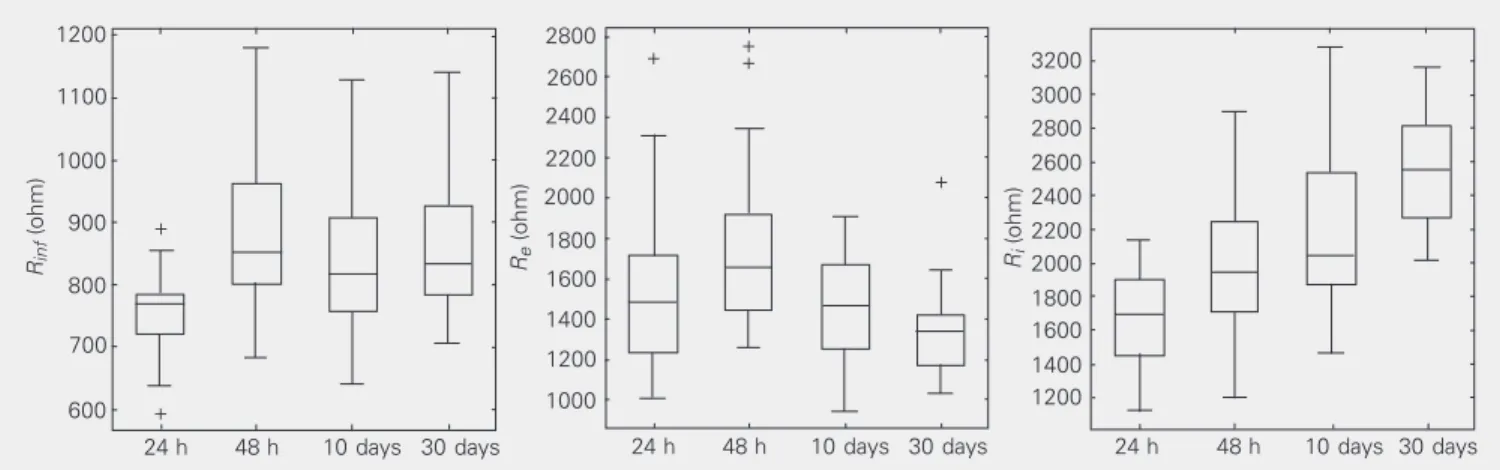
The values of the bioelectrical impedance parameters (Rinf, Re,and Ri) for the neonatal
group studied are represented by the box plots in Figure 2.
Table 3. Estimated mean error of bioelectrical impedance parameters.
Re Ri Cm Ce
RMSE (Ω or nF) 141.03 239.87 0.26 0.79
RMSE (%) 9.22 10.76 29.36 7.62
Mean RMSE (%) 14.24
Data are reported as absolute and percentile values; see text for more details. RMSE
= root mean square error; Re= extracellular resistance; Ri = intracellular resistance;
Cm = membrane capacitance; Ce= electrode capacitance.
Figure 2. Box plot representation of extracellular resistance (Re), intracellular resistance (Ri) and the parallel association between Re and Ri (Rinf) at the
four ages observed. The bottom of the box marks the 25th percentile, the median line the 50th percentile, and the top of the box the 75th percentile. The bottom of the vertical line indicates the 5th percentile and the top the 95th percentile. The symbols at the top and bottom indicate outlying data points.
Rinf
(ohm)
1200 2800
Re
(ohm)
3200
Ri
(ohm)
1100
1000
900
800
700
600
24 h 48 h 10 days 30 days
2600
2400
2200
2000
1800
1600
1400
1200
1000 +
+ ++
+
3000 2800 2600 2400 2200 2000 1800 1600 1400 1200
24 h 48 h 10 days 30 days 24 h 48 h 10 days 30 days
Weight (g)
5500
5000
4500
4000
3500
3000
2500
24 h 48 h 10 days 30 days
Figure 3. Box plot representa-tion of weight at the four neona-tal ages observed. The box plot form is identified in the legend to Figure 2.
Although an increase in all resistive pa-rameters was observed up to the 48th hour, during the period between 48 h and 10 days of age we observed a statistically significant reduction in Re, a nonsignificant decrease in Rinf, and a statistically significant increase in Ri. The same behavior was observed be-tween the 10th day and 1st month, indicating a trend to a reduction in Re and to an increase
in Ri.
Figures 3 and 4 present the box plots for the body composition values (weight, TBW, ECW and ICW) estimated by Equations 7 (ICW) and 10 (ECW).
If the behavior of the resistive parameters described above is correlated with body fluid volumes, a reduction in intracellular volume and an increase in extracellular volume can be expected. This interpretation would not be possible if TBW were simply estimated from the evolution of body weight. Figure 3
shows that between the 24th and 48th hour of age the neonates lost weight (154 ± 78 g, P < 0.05), whereas they showed a significant weight gain at 10 days and 1 month (333 ± 151 and 1077 ± 434 g, respectively).
As mentioned before, Equations 7 (ICW) and 10 (ECW), as well as the sum of these two volumes (i.e., TBW), were used to esti-mate neonatal volumes. It can be seen (Fig-ure 4) that between the 24th and 48th hour of age, statistically significant reductions in TBW,ECW, and ICW were estimated. The reduction in TBWwas strongly correlated (r
= 0.76) with the reduction in body weight observed by the 48th hour of age. Around the 10th day of age, significant increases in TBW and in ECW were observed, but no significant decrease in ICW was detected. During the period between the 10th day and the 1st month of age, TBW and ECW vol-umes showed a statistically significant increase, while the intracellular volume remained un-changed. The statistical differences between these parameters are shown in Table 4.
The changes in body fluid volumes are more easily appreciated when they are shown as a fraction of body weight. Table 5 pre-sents these fractions from the 24th hour to the 1st month of age. TBW was reduced from 68% (24th hour of age) to 54% (1st month of age). The ECW did not change in a statistically significant manner, remaining at
Figure 4. Box plot representation of total body water (TBW), extracellular water (ECW) and intracellular water (ICW) at the four neonatal ages. The box plot form is identified in the legend to Figure 2. Each symbol at the top is an outlying data point.
2.2
ECW (liters)
1.6
ICW (liters)
24 h 48 h 10 days 30 days
2.0
1.8
1.6
1.4
1.2
1.0
0.8
1.4
1.2
1.0
0.8
0.6
24 h 48 h 10 days 30 days 24 h 48 h 10 days 30 days
TBW (liters)
2.4
2.2
2.0
1.8 3.0
2.8
2.6
1.6
1.4
+ +
+ +
+
+ +
+
+ + + +
approximately 37% of body weight, while the intracellular volume was reduced with statistical significance from 29% (24th hour of age) to 17% (1st month of age). These data indicate that during the 1st month of age, the intracellular compartment was the major site responsible for the TBW loss by a transfer mechanism to the extracellular com-partment. This interpretation is in agreement with MacLaurin (19), who indicated that during the first 3 days of age a relative ECW increase is observed due to the result of a water shift from the intracellular compart-ment. This fact is supposed to be correlated with the neonatal renal physiology, because renal inefficiency would result in an increase of extracellular solute concentration and in alterations of intracellular volume.
The analysis of the percentages of intra-and extracellular volumes regarding TBW (Table 5) indicates that the extracellular vol-ume is higher than the intracellular volvol-ume, and that the difference between these two volumes increases from the 24th hour to the 1st month of age. Table 5 also shows the fractional composition of TBW, an impor-tant index for the determination of normal neonatal maturation (20).
Pearson linear correlation coefficients (r) between several variables during the four periods studied can be seen in Table 6. The extracellular resistance (Re), which is used to
estimate ECW (Equation 10), exhibited a significant correlation (r > 0.74) with the value of this compartment at the first three ages of measurement. Intracellular resistance (Ri), which is used to estimate ICW
(equa-tion 7), also showed a strong correla(equa-tion (r > 0.80) with ICW during the same period. These facts indicate that the body volume estimates strongly depend on the measure-ment of these resistive parameters.
The estimation of fluid volumes (TBW, ECW and ICW) from BIS parameters is de-pendent on factors such as the data acquisi-tion/analysis system, the skin cleaning pro-cess, electrode placement, and neonate
han-Table 5. Changes in total body (TBW), intracellular (ICW) and extracellular (ECW)
water during the first month of age.
24 h 48 h 10 days 1 month
TBW/weight (%) 68 ± 4 63 ± 6 62 ± 6 54 ± 6
ECW/weight (%) 39 ± 6 37 ± 5 40 ± 5 37 ± 5
ICW/weight (%) 29 ± 6 27 ± 6 22 ± 4 17 ± 3
ECW/TBW (%) 57 ± 9 58 ± 7 64 ± 6 69 ± 4
ICW/TBW (%) 42 ± 9 42 ± 7 36 ± 6 31 ± 4
Data are reported as means ± SD of % of body volume of TBW, ECW and ICW per neonate weight or as the ratio of ECW and ICW to TBW reported in percent. Table 4. Significant differences determined by ANOVA of the bioelectrical impedance and body composition parameters at the times of measurement.
1-2 days 2-10 days 10-30 days 1-10 days 1-30 days
Rinf H1 HHHHH00000 HHHHH00000 H1 H1
Ri H1 H1 H1 H1 H1
Re H1 H1 H1 HHHHH00000 H1
Weight H1 H1 H1 H1 H1
TBW H1 H1 H1 H1 H1
ICW H1 HHHHH00000 HHHHH00000 H1 H1
ECW H1 H1 H1 H1 H1
H0 = Null hypothesis (no change); H1 = rejection of the null hypothesis; Re =
extracellular resistance; Ri = intracellular resistance; Rinf = parallel association
be-tween Re and Ri; TBW = total body water; ICW = intracellular water; ECW =
extracellular water.
Table 6. Pearson linear correlation coefficients (r) between electric parameters(Ri and
Re) and body composition (weight, TBW,ICW and ECW) data for neonates.
24 h 48 h 10 days 1 month
TBW/weight 0.90 0.76 0.69 0.65
ICW/weight 0.66 0.58 0.21* 0.44
ECW/weight 0.30* 0.45 0.68 0.58
TBW/ICW 0.64 0.73 0.51 0.64
TBW/ECW 0.44 0.64 0.86 0.90
ICW/(1/Ri) -0.90 -0.85 -0.80 -0.62
ECW/(1/Re) -0.77 -0.74 -0.76 -0.41
TBW = total body water; ICW = intracellular water; ECW = extracellular water; Re=
extracellular resistance; Ri= intracellular resistance. *P > 0.05, not statistically
signifi-cant.
com-parison of these values with the errors re-ported in the literature can be seen in Table 7, which shows that the errors reported in the present paper are lower for all parameters than those reported for neonates, children and adults in seven studies.
Discussion
The aim of evaluating the system calibra-tion was to calculate the estimacalibra-tion error in the determination of the bioelectrical impe-dance parameters. Although the total mean estimation error was 14.24%, the major com-ponent of error was due to the estimation of
Cm (29.36%). The latter error could be
attrib-uted to some characteristics of the acquisi-tion system, such as the cable lengths and other forms of stray capacitance. Since only
Reand Ri are used to calculate body volumes, and the estimation errors associated with these resistances were significantly lower (9.22 and 10.76%, respectively), the bio-electrical impedance values can be consid-ered precise within a 10% error when com-pared to real values. Evaluation of the instru-ment reliability showed an intraclass corre-lation coefficient of 0.75 for Re and 0.8 for
Ri, with values of 0.75 or higher being
usu-ally accepted as a good indicator of stability. As mentioned before, the above preci-sion in the measures of the resistive param-eters leads to estimation errors in TBW, ECW and ICW of 3.1, 2.1 and 4.7%,
respec-tively (Table 7), similar to those reported in the literature. It should be pointed out that the data shown in Figure 4 present an aver-age coefficient of variation of 0.17, indicat-ing a coherent and homogeneous data set (< 0.25).
The behavior of the resistances (Rinf, Ri, and Re) agreed with those physiologically
expected for the different ages tested. Be-tween the 24th and 48th hour of age all resistive parameters increased in a statisti-cally significant manner. Kushner et al. (21) reported that, normally, if the fluid resistiv-ity does not change, the resistance changes are expected to be proportional to the in-verse of the changes in fluid volume. Thus, generally, positive changes in resistance can be interpreted as reductions in such volume, and vice-versa. Consequently, the positive changes in the resistive parameters observed here between the 24th and 48th hour of age seem to be correctly correlated with the de-crease observed in body weight.
The results presented in Table 6 indicate that TBW was significantly correlated with body weight, but intra- and extracellular vol-umes did not show the same behavior. It was also observed that the significant correlation between TBW and body weight decreased with age. This fact is probably caused by changes in the neonate’s body composition since, a decrease of neonatal body water occurs during this period, as well as an in-crease in neonatal fat mass. These results indicate that TBW can be estimated by body weight, as normally done in the literature, although the ECW and ICW volumes cannot be determined only by anthropometric meas-urements.
The higher correlation between TBW and ICW observed in the first two periods of measurement when compared with the cor-relation between TBW and ECW suggests that the reduction of TBW during the first 48 h of age was probably caused by the de-crease in intracellular volume. This behavior can be analogously attributed to the higher
Table 7. Standard error of the estimate (SEE) and percent SEE of mean dilution of body volumes.
Studies Population TBW (liters) ECW (liters) ICW (liters)
Present study Neonate 0.065 (3.1%) 0.027 (2.1%) 0.037 (4.7%)
Mayfield et al. (3) Neonate 0.088 (6.8%) 0.057 (7.7%)
-Lingwood et al. (6) Neonate - 0.058 (8.5%)
-Goran et al. (8) Children 0.63 (5.4%) -
-Tagliabue et al. (23) Adult 1.51 (4.0%) 0.70 (4.6%)
-Cornish et al. (22) Adult 2.1 (5.2%) 1.8 (10.0%)
-De Lorenzo et al. (12) Adult 1.33 (3.2%) 0.90 (4.3%) 1.69 (8.4%)
Earthman et al. (38) Adult 2.03 (5.0%) 1.49 (8.8%) 2.06 (8.8%)
correlation found between TBW and ECW at the last two periods of measurement, indi-cating that the increase in TBW after the 10th day of age can be attributed to an in-crease in extracellular volume. These data seem to confirm the idea that ICW shifts to the ECW compartment.
Although no gold standard was used for validation of the method, the observed val-ues and changes in TBW,ECW, and ICW were coherent with literature data, showing that the proposed equations provided esti-mates of these volumes close to those ex-pected for normal term neonates.
The estimation of these body volumes
can be of help for better neonatal care, espe-cially in the analysis of diseases in which the ECWand/orICW can be modified without changes inTBW.
In the present study we developed new equations to assess fluid volumes (TBW, ICW and ECW) in neonates from bioelectri-cal impedance measurements. These new equations can be considered to be extensions of the ones developed by De Lorenzo et al. (12). In conclusion, the assessment of body fluid by a noninvasive, inexpensive and fast method, BIS, can contribute to increasing the quality of the neonatal care.
References
1. El-Dahr SS & Chevalier RL (1990). Special needs of the newborn
infant in fluid therapy. Pediatric Clinics of North America, 37:
323-336.
2. Thomasset A (1962). Bioelectrical properties of tissue impedance
measurements. Lyon Medical, 207: 107-118.
3. Mayfield SR, Uauy R & Waidelich D (1991). Body composition of low-birth-weight infants determined by using bioelectrical
resis-tance and reacresis-tance. American Journal of Clinical Nutrition, 54:
296-303.
4. Kushner RF & Schoeller DA (1986). Estimation of total body water
by bioelectrical impedance analysis. American Journal of Clinical
Nutrition, 44: 417-424.
5. Lukaski HC, Johnson PE, Bolonchuk WW & Lykken GI (1985). Assessment of fat free mass using bioelectric impedance
measure-ments of the human body. American Journal of Clinical Nutrition,
41: 810-817.
6. Lingwood BE, Coghlan JP, Ward LC, Charles BG & Colditz PB (2000). Measurement of extracellular fluid volume in the neonate
using multiple frequency bio-impedance analysis. Physiological
Measurement, 21: 251-262.
7. Hoffer EC, Meador CK & Simpson DC (1969). Correlation of
whole-body impedance with total water volume. Journal of Applied
Physi-ology, 27: 531-534.
8. Goran MI, Kaskoun MC, Carpenter WH, Poehlman ET, Ravussin E & Fontvieille A (1993). Estimating body composition of young children
by using bioelectrical resistance. Journal of Applied Physiology, 75:
1776-1780.
9. Tang W, Ridout D & Modi N (1997). Assessment of total body water using bioelectrical impedance analysis in neonates receiving
inten-sive care. Archives of Disease in Childhood, 77: F123-F126.
10. WilsonDC, Baird T, Scrimgeour C, Halliday H, Reid M & McClure G
(1993). Total body water measurement by bioelectrical impedance
in the extremely low birth weight infant. Basic Life Sciences, 60:
185-188.
11. Neves CEB & Souza MN (2000). A method for bio-electrical
impe-dance analysis based on a step-voltage response. Physiological
Measurement, 21: 395-408.
12. De Lorenzo A, Andreoli A, Matthie J & Withers P (1997). Predicting body cell mass with bioelectrical impedance by using theoretical
methods: a technological review. Journal of Applied Physiology, 82:
1542-1558.
13. Cornish BH, Thomas BJ & Ward LC (1998). Effect of temperature
and sweating on bioelectrical impedance measurements. Applied
Radiation and Isotopes, 49: 475-476.
14. Heimler R, Doumas BT, Jendrzejczak BM, Nemeth PB, Hoffman RG & Nelin LD (1993). Relationship between nutrition, weight change, and fluid compartments in preterm infants during the first week of
life. Journal of Pediatrics, 122: 110-114.
15. Bauer K, Bovermann G, Roithmaier A, Götz M, Pröiss A & Versmold HT (1990). Body composition, nutrition, and fluid balance during the first two weeks of life in preterm neonates weighing less than 1500
grams. Journal of Pediatrics, 118: 615-620.
16. Fomon SJ, Haschke F, Ziegler EE & Nelson SE (1982). Body
compo-sition of reference children from birth to age 10 years. American
Journal of Clinical Nutrition, 35: 1169-1175.
17. Cristian JR & Talso PJ (1959). Exchangeable potassium in normal
full-term newborn infants. Pediatrics, 23: 63-66.
18. Raghavan CV, Super DM, Chatburn RL, Savin SM, Fanaroff AA & Kalhan SC (1998). Estimation of total body water in very-low-birth-weight infants by using anthropometry with and without
bioelectri-cal impedance and H2[18O]. American Journal of Clinical Nutrition,
68: 668-674.
19. MacLaurin JC (1965). Changes in body water distribution during the
first two weeks of life. Archives of Disease in Childhood, 41:
286-291.
20. Cheek DB (1961). Extracellular volume: its structure and
measure-ment and the influence of age and disease. Medical Progress, 58:
103-125.
21. Kushner RF, Schoeller DA, Fjeld CR & Danford L (1992). Is the
impedance index (ht2/R) significant in predicting total body water?
American Journal of Clinical Nutrition, 56: 835-839.
Evalua-tion of multiple frequency bioelectrical impedance and Cole-Cole analysis for the assessment of body water volumes in healthy
humans. European Journal of Clinical Nutrition,50: 159-164.
23. Tagliabue A, Cena H & Deurenberg P (1996). Comparative study of the relationship between multi-frequency impedance and body
wa-ter compartments in two European populations. British Journal of
Nutrition,75: 11-19.
24. Armstrong LE, Kenefick RW, Castellani JW, Riebe D, Kavouras SA, Kuznicki JT & Maresh CM (1998). Bioelectrical impedance
spectros-copy technique: intra-, extracellular, and total body water. Medicine
and Science in Sports and Exercise,29: 1657-1663.
25. Siconolfi SF, Gretebeck RJ, Wong WW, Pietrzyk RA & Suire SS (1997). Assessing total body and extracellular water from
bioelectri-cal response spectroscopy. Journal of Applied Physiology,82:
704-710.
26. Aloia JF, Vaswani A, Flaster E & Ma R (1998). Relationship of body
water compartments to age, race, and fat-free mass. Journal of
Laboratory and Clinical Medicine, 132: 483-490.
27. Ellis KJ & Wong WW (1998). Human hydrometry: comparison of
multifrequency bioelectrical impedance with 2H2O and bromide
dilution. Journal of Applied Physiology,85: 1056-1062.
28. Maw GJ, Mackenzie IL & Taylor NAS (1998). Human body-fluid distribution during exercise in hot, temperate and cool
environ-ments. Acta Physiologica Scandinavica,163: 297-304.
29. Fellmann N, Ritz P, Ribeyre J, Beaufrère B, Delaître M & Coudert J (1999). Intracellular hyperhydration induced by a 7-day endurance
race. European Journal of Applied Physiology, 80: 353-359.
30. Gudivaka R, Schoeller RF & Bolt MJG (1999). Single- and
multifre-quency models for bioelectrical impedance analysis of body water
compartments. Journal of Applied Physiology, 87: 1087-1096.
31. Lichtenbelt WDVM & Fogelholm M (1999). Increased extracellular water compartment, relative to intracellular water compartment,
after weight reduction. Journal of Applied Physiology, 87: 294-298.
32. Jürimäe J, Jürimäe T & Pihl E (2000). Changes in body fluids during
endurance rowing training. Annals of the New York Academy of
Sciences, 904: 353-358.
33. Ritz P (2000). Body water spaces and cellular hydration during
healthy aging. Annals of the New York Academy of Sciences,904:
474-483.
34. Buchholz AC, Rafii M & Pencharz PB (2001). Is resting metabolic
rate different between men and women? British Journal of
Nutri-tion, 86: 641-646.
35. Cox-Reijven PL, Kreel B & Soeters PB (2002). Accuracy of bioelectri-cal impedance spectroscopy in measuring changes in body
compo-sition during severe weight loss. Journal of Parenteral and Enteral
Nutrition,26: 120-127.
36. Cassady G (1971). Effect of cesarean section on neonatal body
water spaces. New England Journal of Medicine,285: 887-891.
37. Singui SC, Sood V, Bhakoo ON, Ganguly NK & Kaur A (1995). Composition of postnatal weight loss & subsequent gain in preterm
infants. Indian Journal of Medical Research, 101: 157-162.
38. Earthman CP, Matthie JR, Reid PM, Harper IT, Ravussin E & Howell WH (2000). A comparison of bioimpedance methods for detection
of body cell mass change in HIV infection. Journal of Applied