www.ann-geophys.net/28/1813/2010/ doi:10.5194/angeo-28-1813-2010
© Author(s) 2010. CC Attribution 3.0 License.
Annales
Geophysicae
Geomagnetic activity effects on plasma sheet energy conversion
M. Hamrin1, P. Norqvist1, O. Marghitu2, S. Buchert3, B. Klecker4, L. M. Kistler5, and I. Dandouras6
1Department of Physics, Ume˚a University, Ume˚a, Sweden 2Institute for Space Sciences, Bucharest, Romania 3Swedish Institute of Space Physics, Uppsala, Sweden
4Max-Planck-Institut f¨ur extraterrestrische Physik, Garching, Germany 5Space Science Center, University of New Hampshire, Durham, USA 6CESR-CNRS, Toulouse, France
Received: 17 May 2010 – Revised: 13 September 2010 – Accepted: 21 September 2010 – Published: 1 October 2010
Abstract. In this article we use three years (2001, 2002, and 2004) of Cluster plasma sheet data to investigate what happens to localized energy conversion regions (ECRs) in the plasma sheet during times of high magnetospheric ac-tivity. By examining variations in the power density,E·J, whereE is the electric field and J is the current density obtained by Cluster, we have studied the influence on Con-centrated Load Regions (CLRs) and ConCon-centrated Generator Regions (CGRs) from variations in the geomagnetic distur-bance level as expressed by the Kp, the AE, and the Dst in-dices. We find that the ECR occurrence frequency increases during higher magnetospheric activities, and that the ECRs become stronger. This is true both for CLRs and for CGRs, and the localized energy conversion therefore concerns en-ergy conversion in both directions between the particles and the fields in the plasma sheet. A higher geomagnetic activ-ity hence increases the general level of energy conversion in the plasma sheet. Moreover, we have shown that CLRs live longer during magnetically disturbed times, hence convert-ing more electromagnetic energy. The CGR lifetime, on the other hand, seems to be unaffected by the geomagnetic ac-tivity level. The evidence for increased energy conversion during geomagnetically disturbed times is most clear for Kp and for AE, but there are also some indications that energy conversion increases during large negative Dst. This is con-sistent with the plasma sheet magnetically mapping to the auroral zone, and therefore being more tightly coupled to au-roral activities and variations in the AE and Kp indices, than to variations in the ring current region as described by the Dst index.
Keywords. Magnetospheric physics (Auroral phenomena; Magnetotail; Plasma sheet)
Correspondence to: M. Hamrin ([email protected])
1 Introduction
The energy conversion in the plasma sheet is known to play an important role for the magnetospheric energy budget, for example during substorms (Lyons, 2000; Koskinen and Tan-skanen, 2002; Pulkkinen et al., 2003). Compared with ring current dissipation, auroral Joule heating and charged parti-cle precipitation into the ionosphere, it has been found that the plasma sheet dissipates (in the form of plasmoid ejection and ion heating) comparable amounts of energy during sub-storms (Ieda et al., 1998; Slavin et al., 1993). Even though the plasma sheet on the average behaves as a load due to the dawn to dusk electric field and the cross-tail current, it is a complicated plasma regime hosting both loads and genera-tors (Birn and Hesse, 2005; Marghitu et al., 2010; Hamrin et al., 2009a).
The nightside auroral region maps to the plasma sheet. Generator regions which are important for auroral activity are therefore expected to exist in and near the plasma sheet. Several regions in the plasma sheet, the low-latitude bound-ary layer and the plasma sheet boundbound-ary layer have been suggested to host auroral generators. See e.g. Paschmann et al. (2002) for an overview of auroral phenomena, includ-ing the magnetosphere-ionosphere couplinclud-ing. In the search for the auroral generator, various methods such as field-line mapping (Lu et al., 2000), numerical simulations (e.g. Birn and Hesse, 1996; Birn et al., 1996), and analytical and semi-analytical methods (e.g. Rostoker and Bostr¨om, 1976; Lysak, 1985; Vogt et al., 1999; Haerendel, 2009) have been adopted. Various possible mechanisms and locations for the auroral generators are discussed in Borovsky (1993).
be identified and analyzed. Conversion from mechanical (plasma bulk and thermal energy) to electromagnetic energy occurs in generator regions where E·J<0. The process is reversed in load regions whereE·J>0 and electromag-netic energy is converted back into mechanical energy by re-versible and/or irrere-versible processes. However, in situ in-vestigations of ECRs in the magnetotail are scarce in the lit-erature. To our knowledge, the first experimental investiga-tions of generator regions in the plasma sheet were presented in Marghitu et al. (2006), in Hamrin et al. (2006), and in Rosenqvist et al. (2006).
After a systematic search through the Cluster plasma sheet data from the summer and fall of 2001, when Cluster probed the plasma sheet at geocentric distances of about 15–20RE, several energy conversion regions (ECRs) were identified (Marghitu et al., 2006; Marghitu et al., 2010; Hamrin et al., 2006, 2009a). Most of the ECRs were loads, but also a few generators were identified. Depending on the sign of the power density, these regions are named Concentrated Load Regions (CLRs) and Concentrated Generator Regions (CGRs), and they should be distinguished from any possible distributed ECRs which may exist over much larger regions in time and/or space. The word concentrated designates a localization in space, especially in the GSE z-direction even though a case study in Marghitu et al. (2006) suggests that the CGRs might as well be concentrated in other directions, and in time. This suggestion was confirmed by Hamrin et al. (2009b) who argued that a majority of the observed ECRs in the plasma sheet at 15–20REare rather stationary in space, but varying in time. Assuming that the ECRs are cylindri-cally shaped and have similar spatial extend, Hamrin et al. (2009b) concluded that the typical scale size of the ECRs is of the order of a fewREand that their lifetime is 1–10 min.
The CLRs are found to be located closer to the neutral sheet, while generators occur nearer to the plasma sheet boundary layer (PSBL) (Marghitu et al., 2006; Marghitu et al., 2010; Hamrin et al., 2006, 2009a). For both CLRs and CGRs, the GSE EyJy component gives the dominant
con-tribution to the total power density,E·J=ExJx+EyJy+
EzJz.
As mentioned above, the plasma sheet plays an important role for the magnetospheric energy budget. The total power conversion in the plasma sheet increases with geomagnetic activity. How do the CLRs and CGRs manifest an increase? Do they become more frequent, stronger, is the ECR spatial size larger or lifetime longer during magnetically disturbed times, or do we observe any combination of these features? From the set of data used in the previous investigations of Hamrin et al. (2009a) and Hamrin et al. (2009b), it is im-possible to answer this questions due to poor statistics, es-pecially for CGRs which are not very frequently observed in the plasma sheet data at 15–20RE. To be able to analyze the
relation between localized plasma sheet energy conversion and magnetospheric activity, a larger data base is needed.
In the present investigation we have increased our data base to include three years of Cluster plasma sheet crossing. Data from the summer and fall of 2001, 2002 and 2004 are included. Due to unsatisfactory spacecraft configuration, and for later years also due to instrumental degradings, data from 2003, 2005 and later years are not included in our investiga-tion. To analyze the effects of the magnetospheric activity on the ECR properties in the plasma sheet, we utilize geo-magnetic indices to express the geogeo-magnetic activity. Nu-merous indices of magnetic activities are available for mag-netospheric investigations, but in the present study we will only use the Kp, the AE and the Dst indices.
The geomagnetic indices are designed to measure the ge-omagnetic activity in the magnetosphere by estimating the impact of various magnetospheric current systems on the ge-omagnetic field. A comprehensive overview of the deriva-tion, meaning and use of geomagnetic indices can be found in Mayaud (1980) and Rangarajan (1989). More informa-tion about geomagnetic indices can also be found on the specific web sites where index data are available. In this investigation index data are obtained from the OMNI web, http://omniweb.gsfc.nasa.gov/form/dx1.html.
The Kp index (Bartels et al., 1939) is a quasi-logarithmic index measuring the planetary activity level. It is based on magnetometer data from a set of mid-latitude ground based stations, which observe horizontal perturbations in the geo-magnetic field due to current systems such as the ring cur-rent, the auroral electrojet, and field-aligned currents sys-tems. Kp ranges between 0 and 9, with finer variations in-dicated by minus and plus signs, e.g. 0, and 0+designating very quiet magnetospheric conditions, and 9−, 9, and 9+ very disturbed conditions.
The AE index was originally introduced by Davis and Sug-iura (1966). The index was designed to measure auroral ac-tivity by capturing the behaviour of the auroral electrojet. AE is constructed from measurements of the horizontal magnetic field obtained from a set of observatories in the auroral zone in the Northern Hemisphere. The so called AL and AU in-dices correspond to the lower and upper envelopes of the variation of the horizontal magnetic field component. The AE index is constructed as the difference between the AU and AL indices.
The Dst index (Akasofu and Chapman, 1964) is derived from magnetometer data from a set of observatories near the equator. It is designed to measure hourly deviations (as com-pared to quiet conditions) in the horizontal magnetic field caused by the ring current. Dst values are normally negative, and large negative values mainly correspond to an increase in the ring current, even though cross-tail currents in the mag-netotail also may contribute. Positive Dst values occur occa-sionally. They are usually caused by magnetopause current systems due to solar wind pressure variations.
AE indices. We show that both CLRs and CGRs occur more frequently during disturbed times and that they also become stronger. The lifetime of CLRs seems to increase with higher geomagnetic activity, while the CGR lifetime appears to be unaffected. However, the data do not allow to infer whether or not the ECR scale size changes during higher magneto-spheric activities. Investigating any possible consequences on the scale size requires more detailed investigations and this is outside the scope of the present article.
This paper is organized as follows: Sect. 2 contains a short overview of the data used. In Sect. 3 we discuss some gen-eral observable properties of the data base. Section 4 is de-voted to the analysis of the variation of the ECR occurrence frequency, strength and lifetime as a function of the geomag-netic activity. In the final section we discuss and summarize our results.
2 Instrumentation and method
The four Cluster Spacecraft mission were launched in 2000 into a polar orbit with inclination 81◦and with apogee and perigee at 18RE and 3RE, respectively. The satellites are spin stabilized with a rotation period of 4 s, and the orbital period is about 57 h. In this article we use data from the Cluster ion spectrometer (CIS), the flux-gate magnetometer (FGM), and the electric fields and waves experiment (EFW) on board the Cluster spacecraft. For a discussion of the Cluster mission and instruments, see Escoubet et al. (2001) and references therein. In this investigation, we also use estimates of the Kp index, the AE index and the Dst in-dex. The index data are obtained from the OMNI web site, http://omniweb.gsfc.nasa.gov/form/dx1.html.
In this investigation we have increased our data base of Cluster plasma sheet crossings to consist not only of data from 2001 as in the previous investigations of Hamrin et al. (2009a,b), but also from the years of 2002 and 2004. The data originate from the summer and fall half-years of the respective year, and most events are observed by Cluster at geocentric distances of about 15–20RE.
Cluster plasma sheet crossings from 2003 are not included in our data base. In 2003 the characteristic size of the Cluster tetrahedron is usually comparable or smaller than the proton gyroradii, and kinetic effects might be important for the in-terpretation of the 2003 data. Moreover, on smaller scales, measurement errors in the magnetic field and spacecraft po-sitions have a larger influence on the current density calcula-tion. This higher level of small scale fluctuations in the power density data in 2003, as well as our wish to exclude kinetic effects from the study, are the reasons for not including the 2003 data in the present investigation.
The determination of the current density requires suitable spacecraft configurations (see below). In 2005, Cluster is in a multi-scale mode and data from this year is therefore not in-cluded in our investigation. Moreover, instrumental
degrad-ings over the years also implies less robust data from the lat-ter years of the Cluslat-ter mission and these data are therefore not included wither in our investigations.
The evaluation of the power density, E·J, is based on Cluster electric field data, E, and current density data, J, re-sampled every 4 s. The current density is obtained from simultaneous magnetic field measurements from the FGM instrument on board the four satellites by using the curlome-ter method,J= ∇×B/µ0(Robert et al., 1998; Dunlop et al.,
2002). The current density is estimated under the assumption that the magnetic field varies linearly between the spacecraft. The quality of the estimate is rather sensitive to the size and shape of the Cluster tetrahedron. Resolving small scale cur-rent density signatures requires a small tetrahedron. On the other hand, a small size of the Cluster tetrahedron implies a larger influence of measurement errors on the current density. Since the current density can be considered as an average over the Cluster tetrahedron, in this article the electric field is also averaged over the tetrahedron volume. The electric field can be derived from the two CIS instruments CODIF (Composition and Distribution Function) and HIA (Hot Ion Analyzer) on the assumption that the E×B drift is dom-inant. The EFW instrument measures the electric field di-rectly, however, since the geomagnetic field vector generally is too close to the satellite spin plane containing the EFW probes, we can only obtain electric field components in that plane. The EDI (electron drift) instrument is also designed to measure the electric field, but this instrument is not op-erational in the plasma sheet due to weak magnetic fields. Therefore, only CODIF data are included in the computation of the average electric field used in the power density. Note that the CIS instrument on Cluster spacecraft C2 is not opera-tional on Cluster spacecraft C2, so the average electric field is only based on measurements from C1, C3, and C4. CODIF is operational on C1, C3, and C4, and HIA on C1 and C3. However, CODIF on C3 suffers from a higher noise level due to a degraded particle detection efficiency, and CODIF-3 is therefore not included in the electric field average. Moreover, CODIF on C1 is only operational until 25 October 2004, and is replaced by HIA on C1 in the computation of the average electric field after this date. The electric field from the EFW instrument is used only for cross-checking the results from CIS.
The appropriate reference systems to use for calculating the power density are GSE and GSM (Marghitu et al., 2006). These reference systems differ only a few degrees from the DSI (Despun Satellite Inverted) system which is the most convenient choice for the EFW instrument.
E
⋅
J (pW/m
3)
−1 0 1 2 3 4
Σ
E
⋅
J (pW/m
3)
Time / satellite position −20
0 20 40 60
CLR
step
average
CLR peak
average
peak
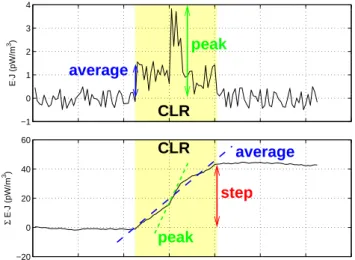
Fig. 1. Schematic CLR as it would be observed in the power density
data. The top panel shows the power density and the bottom panel contains the cumulative sum of the power density along the satellite path. The quantities peak and average correspond to the maximum and average value of the time series of the power density, and hence the maximum and average slope in the cumulate sum of the power density along the spacecraft path. The step size measures the in-crease in the cumulative sum. Figure from Hamrin et al. (2009a).
the spacecraft path) of the power density as shown in the bot-tom panel. A CGR behaves similarly, but the power density is negative.
To be accepted by the automatic selection routines, every CLR and CGR must fulfil a set of instrumental and physi-cal criteria to assure a reliable selection. Only the clearest ECRs are accepted by the routines. It is hence probable that the number of ECRs in the plasma sheet is underestimated in this investigation. The selections routines consist of three separate steps. In the first step, a number of potential CLRs and CGRs are identified from the slope of the cumulative sum of the power density along the satellite path. Only re-gions with a step larger than 40 pW/m3, and with an average power density larger than 0.3 pW/m3, are kept (cf. Fig. 1). In the second step, CLRs are merged with neighbouring CLRs if the separation in time between the CLRs is shorter than the time extent of the shortest one of the neighbouring CLR. A similar merging is done for the CGRs. In the final step, all events which do not fulfil a set of physical and instrumen-tal requirements are rejected. These requirements are listed in the appendix of Hamrin et al. (2009a). For example, mea-surements from CODIF, HIA, and EFW should correlate, and all ECRs should be at least 100 s long.
As explained in Hamrin et al. (2009a), there are various ways to characterize the typical strength of the ECRs. As in-dicated in Fig. 1, the strength can be characterized by the step size of the cumulative sum of power density (or the power density integrated along the spacecraft path), the peak value of the power density within the ECR, or the average power
density within the ECR (equivalent to the average slope of the cumulative sum of power density). In this article we most often use the average power density as a measure of ECR strength, since this is the most unambiguous choice. The peak value is often unsuitable because it is rather sensitive to random fluctuations. This is especially the case for the RAND events since they are not carefully selected to cor-respond to true localized energy conversion regions. Due to fluctuations, a randomly chosen time interval might well show different signs for the peak value on the one hand and the step or average value on the other hand. Moreover, there is a linear relationship between the step size and the aver-age power density, making one of these measures in prin-ciple redundant if the time extent of the ECRs is handled separately. The step size can be obtained by multiplying the average power density with the time extent of the ECR (or the number of 4-s samples included in the ECR to obtain the same physical units for the step size and the average power density). However, since the peak is rather an instantaneous value, there is no simple relationship between the peak and the averaged quantities step and average power density.
To be able to separate between the characteristic behaviour of the selected ECRs and the general behaviour of the plasma sheet, as well as distinguishing the ECR signatures from any possible noise and variability present in the plasma sheet data, we also compare our ECR data with a data base of randomly selected time intervals evenly spread within the available Cluster plasma sheet data. Depending on the ap-parent sign of the power density within these random events, they will be named random loads (RAND-Ls) and random generators (RAND-Gs), respectively. The notation CLRs and CGRs will be reserved only for the true ECRs, which are more carefully selected by the automatic routines. The RAND data base consists of randomly chosen events with random time extent between 100 s and 500 s. Note that it is therefore not meaningful to investigate some properties of the RAND events, e.g., their time extent. A more detailed discussion of the event selection and the interpretation of the RAND events can be found in Hamrin et al. (2009a).
It should be noted that a few changes have been made to the automatic selection routines since the previous investiga-tions in Hamrin et al. (2009a,b). The data included in the present data base have been checked carefully against the data previously used in Hamrin et al. (2009a,b). Conclusions drawn from these data are consistent with previous results. Below follows a short discussion of the more important ad-justments to the automatic selection routines.
Table 1. Overview of the events included in our data base. Data are presented for each individual year (2001, 2002, and 2004) as well as for
all three years together. The second and third column contain the number of Cluster plasma sheet crossings and the total number of hours investigated in the plasma sheet. In column four and five, the total number of ECRs and the occurrence frequency (number of ECRs per hour) are presented. The individual number of CLRs and CGRs, respectively, are presented in column six and seven, while column eight contains the ratio between the number of CLRs and the number of CGRs. Column nine to eleven contain similar information, but for the RAND data. In the final column, information on the characteristic scale size of the tetrahedron can be found.
Year Pass. PS[h] ECR ECR/h CLR CGR CLR/CGR RAND-L RAND-G RAND-L/G ∼L[km]
2001 85 660 134 0.20 110 24 4.6 577 464 1.2 1500
2002 68 1000 233 0.23 173 60 2.9 450 275 1.6 4000
2004 67 1070 188 0.18 145 43 3.4 440 258 1.7 1000
2001+
2002+ 220 2730 555 0.20 428 127 3.4 1467 997 1.5 –
2004
routines have therefore been tuned to work better with this new average power density signal. Moreover, due to instru-ment failure, CODIF on C1 is replaced by HIA on C1 in the electric field average after 25 October 2004. Contrary to our previous papers (Hamrin et al., 2009a,b), in the present in-vestigation we have no extra requirements on the size of the Cluster tetrahedron in comparison to the proton gyroradius. Indeed, for the Cluster plasma sheet data from 2001, 2002, and 2004, the Cluster tetrahedron is rarely smaller than the ion scales and kinetic effects are not an issue.
Changes in the automatic selection routines also influence the data base of random plasma sheet events. To better suit the observed lifetime of ECRs (Hamrin et al., 2009b), in this present investigation, the RAND data base is constructed from random plasma sheet time intervals chosen from a square distribution between 100 s and 500 s (as compared to 100–1000 s as was the case in Hamrin et al., 2009a,b).
Only data from 2001, 2001, and 2004 are included in the present investigation. During these years, the size and shape of the Cluster tetrahedron were generally appropriate for en-ergy conversion investigations. The tetrahedron is rather equilateral, and its characteristic shape is generally equal to a few proton gyroradii. This ensures that ions behave collec-tively within the selected ECRs and that kinetic effects need not to be invoked in the analysis of the results.
In our investigation we only use data from the plasma sheet. In the plasma sheet the proton density is generally smaller than 1 cm−3, and the temperature is generally larger
than 1 keV. To automatically select only plasma sheet events, we therefore require that the ratio between the proton tem-perature and density as measured by the CIS instrument is larger than 1000 eV/cm3. The choice of this threshold value has been verified by visual inspection.
3 Data base overview
In this article we use data from 2001, 2002, and 2004. We will occasionally investigate ECR features for the individual years, but in general, to obtain good statistics we will make use of the benefits of a large data base including all three years. This large data base is especially important for CGRs which are generally less frequent, making the CGR statistics often too poor during the individual years. Table 1 contains a summary of the automatically selected energy conversion events included in our data base. Data from 85, 68, and 67 Cluster plasma sheet passages at 10–20RE have been in-cluded from 2001, 2002, and 2004, respectively. Note that data outside the plasma sheet are not included in the data base (cf. Sect. 2). In total we have selected 134 ECRs from 2001, 233 from 2002, and 188 from 2004. For each year, this corresponds to an occurrence frequency of about 0.2 ECRs observed by Cluster per hour in the plasma sheet. This oc-currence frequency is consistent with results from previous investigation presented in Hamrin et al. (2009a). Note, how-ever, that only the clearest ECRs with the most typical power density signatures are included in the data base. The esti-mated occurrence frequency presented here is hence most likely an underestimate.
In the data reduction process special effort was made for 2001 to collect data from all available Cluster plasma sheet crossings. For 2002 and 2004, between 10% and 20% of the passages are lost due to irregularities in the data such as the loss of signal from one or more instruments. However, fewer hours of plasma sheet data are still included in our data base from 2001 than from the other years because of an increase in the telemetry duty cycle in the middle of 2002.
the plasma sheet, on the average, behaving as a load. How-ever, as expected, the plasma sheet also contains generator regions, even though they are less common.
In Table 1 there is also information about the RAND data base. In total there are 1467 RAND-Ls and 997 RAND-Gs included. The ratio between the number of RAND-Ls and RAND-Gs is not as large as for the true ECRs, but it is still larger than one. Since the RAND data are expected to cap-ture the general behaviour of the plasma sheet (as well as the background noise and variability level), this is again consis-tent with the average load behaviour of the plasma sheet.
According to Hamrin et al. (2009b), the scale size of the ECRs observed by Cluster in the plasma sheet in the summer and fall of 2001 are of the order a fewRE, and the CGRs
appear to be somewhat smaller than the CLRs. We there-fore note that the ECR scale size is considerably larger than the Cluster tetrahedron size during all years of interest in the present investigation. Even during 2002, when the Cluster tetrahedron was largest (∼4000 km), the typical size of the ECRs is clearly larger than the tetrahedron. We will therefore be able to draw conclusions about the general ECR proper-ties from the combined data base including events from all three years, even though the tetrahedron varies in size over the years.
However, it is not only the characteristic scale size of Clus-ter that varies over the years, and which may influence the data analysis. There are also substantial variations in the so-lar activity. The years 2001 and 2002 are rather close to soso-lar maximum, while 2004 is located closer to solar minimum. A thorough investigation of the solar activity effects is needed, but beyond the scope of this paper.
Note also that the analysis of the variation in power den-sity strength over the years is complicated by instrumental degrading.
4 Relation between geomagnetic activity and ECR oc-currence, strength, and lifetime
In this article we use the geomagnetic indices Kp, AE, and Dst when investigating the importance of the geomagnetic activity on the ECR properties such as the occurrence fre-quency, the strength, and the lifetime. Note that the index value for each event is evaluated at the same time as the event. However, since the Kp data are 3 h estimates, and the AE and Dst are hourly estimates, this corresponds to the index being evaluated within the same hour interval (3 or 1 h depending on the index) as the event. No additional time-lag between estimated index and energy conversion event is added. This implies that we investigate the instant impact of the magnetospheric activity on the plasma sheet energy conversion. Any possible delay between variations in the ge-omagnetic activity and the plasma sheet energy conversion is hence not studied in the present investigation.
4.1 ECR occurrence
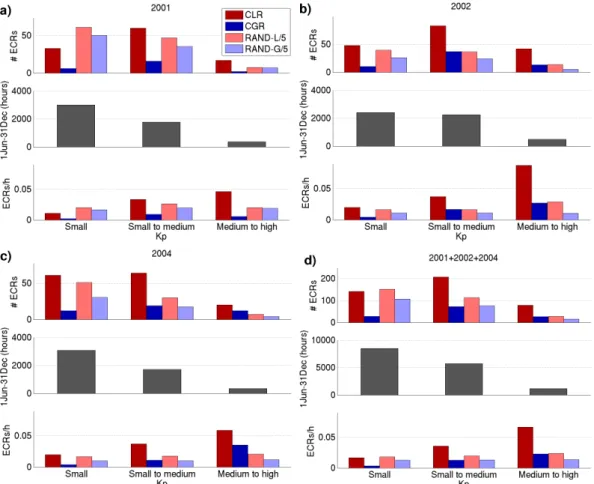
Figure 2 shows the occurrence frequency of CLRs, CGRs, RAND-Ls, and RAND-Gs versus Kp. The events are binned into three Kp intervals comprising small Kp, small to medium Kp, and medium to large Kp according to 0≤Kp≤ 2, 2+ ≤Kp≤4, and 4+ ≤Kp≤9+. To improve that statis-tics, the highest Kp bin includes also moderately high Kp values. The top panels of Figs. 2a–d show the number of ECRs and RAND events within each Kp bin for 2001, 2002, 2004, and for all three years together. Note that the number of RAND events are divided by 5 to fit into the diagrams. The middle panels contain the number of hours (independent of the level of energy conversion) with small Kp, small to medium Kp, and medium to large Kp. These data should be used when normalizing the ECR and RAND data. From the second panels of Figs. 2a–d, we clearly see that low and moderate Kp are much more common than high Kp. As ex-pected, geomagnetically disturbed times are rather rare in the data, (see e.g. Rangarajan and Iyemori, 1997, for the occur-rence frequency of various Kp intervals obtained between the years 1932 and 1995). Over all three half-years included in our data base, we see that there are only slightly more than 1000 h Cluster plasma sheet data with 4+ ≤Kp≤9+.
In the bottom panels of Fig. 2a–d we present the num-ber of events per hour of Cluster observation for the selected Kp values obtained by dividing the number of CLRs, CGRs, RAND-Ls, and RAND-Gs from the top panels with the nor-mal variation of Kp over the years in the middle panels. This normalization hence compensates for the normal variation in magnetospheric activity for the observed data. From the bot-tom panels we clearly see that CLRs become more common during high magnetospheric activities as measured by Kp for all years included in our data base. For CGRs, the statistics for individual years are low, and conclusions about CGRs should in principle be based on the combined data base for all three years together. For CLRs, on the other hand, the statistics are satisfactory also for the individual years. All Kp bins include clearly more than 10 CLRs, also for individual years.
The occurrence frequency of both CLRs and CGRs in-creases during higher Kp. The general conclusion is that localized plasma sheet energy conversion in both directions between mechanical and electromagnetic energy, becomes more common during high magnetospheric activities as mea-sured by the Kp index. Note, however, that there are still fewer CGRs in the plasma sheet than CLRs, and that this in general is independent of the geomagnetic activity as ex-pressed by the Kp index. This over-all dominance of CLRs over CGRs (independently of the geomagnetic activity) cor-responds to the fact that the plasma sheet on the average be-haves as a load (cf. the typical cross-tail current and dawn-dusk electric field).
Fig. 2. The occurrence of ECR and RAND events during different magnetospheric activity as described by Kp in 2001 (a), 2002 (b), 2004 (c),
and within the entire data base comprising all three years (d). The three Kp bins correspond to 0≤Kp≤2, 2+ ≤Kp≤4, and 4+ ≤Kp≤9+. Red and blue correspond to CLRs and CGRs, respectively, while light red and light blue signify RAND-Ls and RAND-Gs. The top panels in each figure show the actual number of energy conversion events. Note however that the number of RAND events is divided by 5. The middle panels show the normal variation of Kp over the years. The bottom panels contain the number of events per hour of Cluster observation for the selected Kp values by dividing the number of events in the top panels with the normalizing data in the middle panels. Note the different scalings of the axes.
is understandable because of the way the RAND data were selected to capture the general behaviour of the plasma sheet. For a more strict normalization, note that we should in gen-eral not use the normalizing data set from the middle panels, but instead the subset corresponding only to the number of hours when Cluster has been probing the plasma sheet dur-ing the years of interest. However, since the RAND data (per hour of Cluster observation within each bin) in the bottom panels of Fig. 2 closely follow the variation of the normal-izing data set in the middle panels, it is sufficient to use the present normalization data instead of the subset.
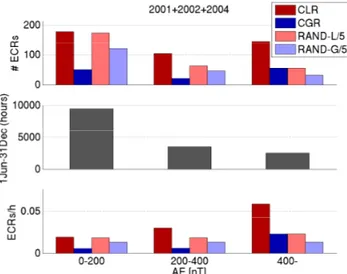
Next we investigate the dependency of the ECR occur-rence frequency on the auroral activity as expressed by the AE index, see Fig. 3. The three AE bins are defined accord-ing to 0≤AE<200 nT, 200 nT≤AE<400 nT, and AE≥ 400 nT. The top panel show the total number of ECRs and RAND events (RAND divided by 5) within each AE bin, and the bottom panel contains the number of events per hour
of Cluster observation for each bin obtained by dividing the number of events in the top panel with the background data (number of hours within each AE bin during all three half-years).
Both CLRs and CGRs show an increased occurrence fre-quency for higher AE. The result for CLRs is supported by the result from the individual years (not shown). For CGRs the statistics are, however, rather poor for the separate years. As for the RAND data in Fig. 2, the total number of RAND events in the top panel of Fig. 3 nicely follows the variation of the normalizing data set in the middle panel. Therefore, no clear trend can be observed in the RAND data in the bottom panel.
Fig. 3. The occurrence of ECR and RAND events during different
magnetospheric activity as described by AE. The data correspond to the entire data base, 2001+2002+2004. Similar to Fig. 2, the top panel shows the actual number of events, the second panel shows the background data used for obtaining the bottom panel containing the number of events per hour of Cluster observation within each bin. The three AE bins are defined according to 0≤AE<200 nT, 200 nT≤AE<400 nT, and AE≥400 nT. Note the different scal-ings of the axes.
Cluster plasma sheet altitudes (Marghitu et al., 2006; Hamrin et al., 2006). The observed increased occurrence frequency for higher AE is hence expected, and we can confirm the relation between auroral activity (with the AE index used as a proxy) and the energy conversion in the plasma sheet at Cluster altitudes. Note that this is true not only for CGRs but also for CLRs, which convert energy in the other direction, from electromagnetic energy to mechanical energy.
By using the Dst index we can investigate the importance of the geomagnetic activity caused by variations primarily in the magnetospheric ring current. Figure 4 presents to-tal number (top panel) as well as the occurrence frequency of ECRs per hour of Cluster observation (bottom panel) ob-tained for the entire data base including all three years. Only data for negative Dst are included in the plot, since positive Dst are not related to ring current variations but rather to variations caused by magnetopause currents. The Dst bins are defined as Dst<−40 nT,−40 nT≤Dst<−20 nT, and −20≤Dst<0 nT. Note that the Dst axis is reversed so that smallest Dst, i.e., highest geomagnetic activities, correspond to the rightmost bin.
From Fig. 4 we see that the occurrence frequency of CLRs and CGRs increases slightly with decreasing Dst. However, the trend is not as clear for Dst as for Kp and AE, not for the individual years (not shown), and neither for the entire data base 2001+2002+2004. The fact that the ECR occurrence frequency increases slightly more prominently with increas-ing Kp or increasincreas-ing AE, than with decreasincreas-ing Dst, can be
Fig. 4. Similar to Figs. 2 and 3, but here we instead investi-gate the importance of variations in the Dst index for the occur-rence of ECR and RAND events within the combined data base, 2001+2002+2004. Only data for negative Dst are included in the plot. The Dst bins are defined according to Dst<−40 nT,
−40 nT≤Dst<−20 nT, and −20≤Dst<0 nT. However, note that the Dst axis is reversed so that smallest Dst, i.e., moderate to high geomagnetic activities, correspond to the rightmost bin.
explained by the closer connection between the plasma sheet and auroral activities (captured by Kp and AE), than with variations in the ring current (expressed by Dst).
So far we have analyzed the correlation between the geo-magnetic activity and the ECR occurrence frequency in the plasma sheet at Cluster altitudes. We have shown that both CLRs and CGRs become more frequent, especially during higher Kp and higher AE, while the variation with Dst is less clear, in particular at low Dst values. The tendency of higher CLR and CGR occurrence frequencies during large negative Dst values is presumably correlated with an increased activ-ity level as reflected by Kp and AE.
4.2 ECR strength
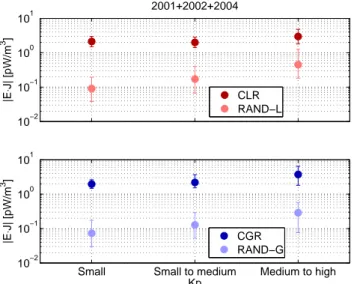
The next question to answer is what happens to the ECR strength during geomagnetically disturbed times. To inves-tigate this issue we have calculate the median of the average power density (cf. Fig. 1) within the same Kp bins as was used in Fig. 2. For the 2001+2002+2004 data, this implies that we have enough statistics to investigate both CLRs and CGRs.
10−2 10−1 100 101
|E
⋅
J| [pW/m
3 ]
2001+2002+2004
CLR RAND−L
Small Small to medium Medium to high 10−2
10−1 100 101
Kp
|E
⋅
J| [pW/m
3 ]
CGR RAND−G
Fig. 5. The energy conversion strength at Cluster plasma sheet
al-titudes versus Kp. The strength is measured as the median of the magnitude of the average power density within the same Kp bins as in Fig. 2 (0≤Kp≤2, 2+ ≤Kp≤4, and 4+ ≤Kp≤9+). The error bars indicate the 25% and 75% percentiles. Red and light red correspond to CLRs and RAND-Ls (top panel), while blue and light blue correspond to CGRs and RAND-Gs (bottom panel).
each bin lies below the 25% percentile value (end of bottom error bar), and 25% of the data lies above the 75% percentile (end of top error bar). The median corresponds to the 50% percentile.
Even though the error bars overlap somewhat, we see that the average power density increases both for CLRs and CGRs in specific towards the rightmost bin as compared to the leftmost and middle bins. Moreover, the spread among the values (as indicated by the error bars – note the logarith-mic scale of the axes) becomes larger for larger Kp, espe-cially towards larger power densities (upper percentile) and in the rightmost bin. This increase in the spread can be inter-preted as a higher probability for really strong events during higher Kp. It is possible that foremost considerably disturbed magnetospheric conditions (as captured by the the rightmost bin of the Kp index) favour the occurrence of ECRs. There-fore, a significant increase in the occurrence frequency can only be seen in the rightmost bin of the figures. For CLRs, the above conclusions can be drawn both for the individual years (not shown), as well as for the combined data base of 2001+2002+2004, while for CGRs, the statistics are gener-ally too poor for the individual years. However, CGRs show the same trend for the 2001+2002+2004 data with stronger events (as well as larger spread among the data points) ob-served for higher Kp.
We can hence conclude that both CLRs and CGRs become more frequent and stronger during higher magnetospheric ac-tivities as expressed by the Kp index. For CLRs the energy conversion strength (average power density) appears to
in-crease with approximately a factor 1.5 towards the highest Kp bin (an increase from about∼2 pW/m3to∼3 pW/m3). For CGRs the increase is even bigger (nearly a factor of 2). Note that this increase in occurrence frequency and strength concerns both localized energy conversion in load and gener-ator regions, i.e. energy conversion in both direction between the particles and the fields.
For the RAND data, the general power density level is con-siderably lower than for the true ECRs. The average power density is approximately a factor of ten smaller in the RAND data base as compared to the ECR data base. Moreover, the strength of the energy conversion for Ls and RAND-Gs is even more affected by Kp than for the CLR and CGR events. Hence the average strength of the general energy con-version (as depicted by the RAND data base) in the plasma sheet increases during high magnetospheric activities.
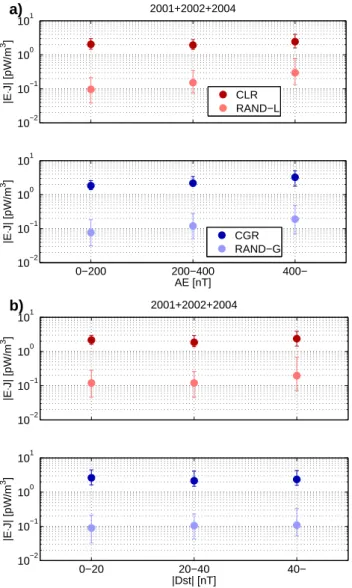
Using our data base we can also investigate the relation between the ECR strength and the geomagnetic activity as expressed by the AE index and the Dst index, respectively, as in Fig. 6, produced in the same way as Fig. 5. The two top panels show the variation with AE, and the two bottom pan-els the variation with Dst. Red and light red (first and third panel) correspond to energy conversion from the fields to the particles (CLRs and RAND-Ls), while blue and light blue represent energy conversion in the opposite direction (CGRs and RAND-Gs). The 25% and 75% percentiles are used for the error bars.
Inspecting Fig. 6a we see that the trend for AE is similar to what was observed for Kp. Both CLRs and CGRs become stronger in the rightmost bin as compared to the leftmost and middle bins. The spread of the data is also larger in the right-most bin (as indicated by the error bars – note the logarith-mic scaling of the axes). Similar to Fig. 5, the RAND data are more affected by variations in AE.
For Dst (bottom two panels of Fig. 6), it is difficult to ob-serve any significant trend. However, at least for RAND-Ls there might be a slight tendency of stronger events towards largest negative Dst (i.e. the rightmost bin). For CGRs and CLRs, however, although the statistics are sufficient in the combined data base 2001+2002+2004, there seems to be no clear variation with Dst.
We have shown that energy conversion in the plasma sheet as probed by the Cluster satellites in 2001, 2002, and 2004 increases during higher magnetospheric activities. This in-crease is most pronounced when investigating the variation of the power density versus Kp, and it consists both in an increased ECR occurrence frequency as well as stronger events. Moreover, the increase applies both to CLRs and to CGRs, i.e. to energy conversion in both directions between the fields and the particles.
4.3 ECR lifetime
10−2 10−1 100 101
|E
⋅
J| [pW/m
3 ]
2001+2002+2004 a)
CLR RAND−L
0−200 200−400 400−
10−2 10−1 100 101
AE [nT]
|E
⋅
J| [pW/m
3 ]
CGR RAND−G
10−2 10−1 100 101
|E
⋅
J| [pW/m
3 ]
2001+2002+2004 b)
0−20 20−40 40−
10−2 10−1 100 101
|Dst| [nT]
|E
⋅
J| [pW/m
3 ]
Fig. 6. The strength of the plasma sheet energy conversion as a
function of AE (a) and Dst (b). Similar to Fig. 5, the energy con-version strength is expressed as the median of the magnitude of the average power density. The error bars indicate the 25% and 75% percentiles. Red and light red correspond to CLRs and RAND-Ls, while blue and light blue correspond to CGRs and RAND-Gs. The AE and Dst binnings are the same as in Figs. 3 and 4, respec-tively. Only data from the combined data base 2001+2002+2004 are shown.
While the analysis of the scale size of the ECRs requires more thorough investigations, and therefore is outside the scope of the present article, we can still study the lifetime of the ECRs. According to Hamrin et al. (2009b), the time extent1T of the ECRs as observed by the Cluster spacecraft can be interpreted as an approximate lifetime of the event. Hence, by plotting the median value of1T versus Kp, AE and Dst, we can analyze how the geomagnetic activity af-fects the lifetime of ECRs. The result for 2001+2002+2004 is plotted in Fig. 7. The Kp, AE and Dst bins are defined in the same way as in Figs. 2–4, and the error bars indicate the
Small Small to medium Medium to high 0
200 400 600
∆
T [s]
Kp 2001+2002+2004 a)
CLR CGR
0−200 200−400 400−
100 200 300 400 500
∆
T [s]
AE [nT] 2001+2002+2004 b)
0−20 20−40 40−
100 200 300 400 500
∆
T [s]
|Dst| [nT] 2001+2002+2004 c)
Fig. 7. Variation of the lifetime of ECRs as a function Kp (a),
AE (b), and Dst (c).
25% and 75% percentiles. Only true ECRs (red for CLRs and blue for CGRs) are included in the figure. RAND data are not included since it is not meaningful to investigate the time extent of the RAND events (the RAND data base simply consists of randomly chosen events with random time extent between 100 s and 500 s).
According to Fig. 7, there is an indication that 1T for CLRs increases with increasing geomagnetic activity mainly for the rightmost index bin, for example the increase in1T
over the Kp bins is about a factor of 1.5, similar to the in-crease in the average energy conversion strength according to Fig. 5. Expressing geomagnetic activity by means of the AE and Dst indices, as in Fig. 7b and c, we see a similar trend. On the other hand,1T for the CGRs seems not to be affected by variations in Kp, AE, and Dst.
density for both CLRs and CGRs, while the contribution to the step value from the lifetime is smaller for CLRs and negligible for CGRs. In summary we can hence conclude that the ECR occurrence frequency and energy conversion strength increase with increasing geomagnetic activity. The lifetime of CLRs also increases but the CGR lifetime seems to be unaffected by the geomagnetic activity.
5 Summary and conclusions
In this article, the main issue has been to investigate what happens to ECRs during geomagnetically disturbed times. We have studied the effects on the ECR occurrence fre-quency, strength, and lifetime. The analysis of the relation of the ECR scale size on the geomagnetic disturbance level, however, needs further investigations, and this is outside the scope of the present investigation.
By examining the sign of the power densityE·J, a num-ber of ECRs have been identified. An automatic event se-lection routine which implements a set of instrumental and physical requirements is used for the identification of CLRs (E·J>0) and CGRs (E·J<0). To express the netic activity within the events, we have used the geomag-netic indices Kp, AE and Dst evaluated approximately at the same time (the same hour) as the events. In our investigation we have used three years of Cluster plasma sheet crossings. In total we have identified 555 ECRs from 2730 h of plasma sheet data in the summer and fall of 2001, 2002 and 2004, and from the approximate geocentric distance range of 15– 20RE. Consistent with preceding investigations presented in Hamrin et al. (2009a), the CLRs are observed to be in ex-cess over the years. There are about three times as many, or more, CLRs than CGRs in the data base. The occurrence fre-quency of ECRs is approximately 0.2 ECRs/h. In order not to include bad events in our data base, special care has been taken to select only the clearest ECRs with the most distinct power density signatures. Hence, it should be noted that we do not claim to select all existing ECRs in the plasma sheet, but only the most typical ones. Our estimate of the occur-rence frequency therefore catches only ECRs over a certain range of scales, roughly a few thousand kilometers, of suf-ficient temporal stability, more than 1–2 min, and of large enough power density.
We find that the ECR occurrence frequency increases dur-ing higher magnetospheric activity. For the CLR data, this conclusion can be confirmed from the individual years sepa-rately, as well as from the entire data base. CGRs are scarcer, and conclusions about the CGR occurrence and other proper-ties should be based on the entire data base 2001+2002+2004 to obtain satisfactory statistics. While the increase in the oc-currence frequency constitutes the dominant cause to the in-creased energy conversion during geomagnetically disturbed times, we have also shown that the ECR strength (as well as the lifetime to some extent) also increases, but to a lesser
extent. Concerning the ECR strength, during high magnetic activity we note that the ECRs become stronger as measured by the average power density within the ECRs. Furthermore, there are indications that CLRs live longer during magneti-cally disturbed times, while the CGR lifetime, on the other hand, seems to be unaffected by the geomagnetic activity level. CLRs are hence switched on for longer times, and since the CLRs also are stronger we can conclude that more energy is converted within these localized CLRs at 15–20RE
under geomagnetically disturbed times.
This evidence for an increased energy conversion during geomagnetically disturbed times is most clear for Kp and for AE, while for Dst the variation is less distinct. It should be noted that there is a difference in nature between the three dices Kp, AE, and Dst. Out of these, Kp is the most global in-dex, measuring a general planetary disturbance level caused by various magnetospheric current systems. Both AE and Dst are more local indices than Kp, but in different ways. AE is designed to better probe auroral current systems while Dst rather reflects variations in the ring current and the in-ner magnetosphere. In this article we have shown that the plasma sheet energy conversion correlates better with varia-tions in AE than in Dst. This is consistent with the plasma sheet magnetically mapping to the auroral zone, and there-fore being more tightly coupled to auroral activity and vari-ations in the AE index, than to varivari-ations in the ring current region.
be investigated. Indeed, from Figs. 2, 3, and 4, we see that the number of RAND-Ls (light red) increases on the expense of RAND-Gs (light blue) for geomagnetic disturbed times. For example, from the third panel of Fig. 2d we see that the ratio between the number of RAND-Ls and RAND-Gs (per hour of Cluster observation) varies from 1.4 (for smallest Kp) to 1.5 (small to medium Kp) and to 1.8 (for medium to high Kp). The variation is similar for AE and Dst. This obser-vation is consistent with more electromagnetic energy being available for powering load regions during high geomagnetic activity.
It should be noted that the variation in ECR strength ob-served over the years is affected by variations in the scale size of the Cluster tetrahedron as well as instrumental de-grading. Also variations in the solar activity may be impor-tant for the interpretation of the results. However, this is out-side the scope of the present paper. The scale size of the Cluster tetrahedron as well as the solar activity vary largely over the years of interest. The Cluster scale size varies be-tween 1000 km and 4000 km. As discussed in Hamrin et al. (2009b), the typical size of the investigated ECRs is about 2–5RE, which is larger than the Cluster scale size during
the current years. The CGRs are somewhat smaller than the CLRs. Since the identification of ECRs is based on varia-tions in the power density averaged over the Cluster tetra-hedron, the CGR signatures will be more smoothed than the CLR signatures. This is especially important for large Clus-ter tetrahedrons, possibly resulting in an underestimate of the CGR strength as compared to the CLRs. The CLRs should, however, also be affected, but to a lesser extent. The effect should be most important for 2002 when the Cluster scale size is largest (L∼4000 km) as compared to 2001 and 2004 (L∼1500 km andL∼1000 km, respectively).
In summary, in this article we have shown that the en-ergy conversion increases in the plasma sheet at Cluster al-titudes during high geomagnetic activities. This is true both for CLRs and for CGRs, and we observe an increased local-ized energy conversion in both directions between the parti-cles and the fields. It is not surprising that the energy con-version in the plasma sheet increases both in generator and load regions during magnetically disturbed times. The pri-mary energy source for the plasma sheet is the solar wind kinetic energy. Energy can be transferred into the magneto-sphere be means of reconnection processes, and transferred as Poynting flux to the lobes where it is converted into mag-netic energy. In the plasma sheet, the magmag-netic energy is converted back again to kinetic energy via tail reconnection. Considerable power, roughly 35% (Rosenqvist et al., 2006), gets dissipated in the Earth’s upper atmosphere (Joule heat-ing) and is transported there in electromagnetic form, i.e. as Poynting flux. This Poynting flux seems to generally get gen-erated from kinetic energy in the plasma sheet rather than come directly from the tail lobes. Thus the popular statement ”the aurora is powered by the solar wind” actually involves a considerable number of conversions back and forth between
electromagnetic and kinetic power, and some of these con-versions in the plasma sheet are witnessed by our CLRs and CGRs.
Acknowledgements. We thank M. Andr´e and the EFW team for pro-viding electric field data. O. M. acknowledges support through the PECS contract ECSTRA, C98048. We thank the referees for thor-oughly refereeing our manuscript.
Topical Editor R. Nakamura thanks J. Gjerloev and another anonymous referee for their help in evaluating this paper.
References
Akasofu, S. and Chapman, S.: On the asymmetric development of magnetic storm fields in low and middle latitudes, Planet. Space Sci., 12, 607–636, doi:10.1016/0032-0633(64)90008-X, 1964. Bartels, J., Heck, N. H., and Johnston, H. F.: The Three-Hour
In-dex Measuring Geomagnetic Activity, J. Geophys. Res., 44, 411– 454, doi:10.1029/TE044i004p00411, 1939.
Birn, J. and Hesse, M.: Details of current disruption and diversion in simulations of magnetotail dynamics, J. Geophys. Res., 101, 15345–15358, 1996.
Birn, J. and Hesse, M.: Energy release and conversion by re-connection in the magnetotail, Ann. Geophys., 23, 3365–3373, doi:10.5194/angeo-23-3365-2005, 2005.
Birn, J., Hesse, M., and Schindler, K.: MHD simulations of magne-totail dynamics, J. Geophys. Res., 101, 12939–12954, 1996. Borovsky, J. E.: Auroral arc thicknesses as predicted by various
theories, J. Geophys. Res., 98, 6101–6138, 1993.
Davis, T. N. and Sugiura, M.: Auroral Electrojet Activity Index AE and Its Universal Time Variations, J. Geophys. Res., 71, 785– 801, 1966.
Dunlop, M. W., Balogh, A., Glassmeier, K. H., and Robert, P.: Four-point Cluster application of magnetic field analysis tools: The Curlometer, J. Geophys. Res., 107, 1384, doi:10.1029/ 2001JA005088, 2002.
Escoubet, C. P., Fehringer, M., and Goldstein, M.: Introduc-tion: The Cluster mission, Ann. Geophys., 19, 1197–1200, doi:10.5194/angeo-19-1197-2001, 2001.
Haerendel, G.: Poleward arcs of the auroral oval during substorms and the inner edge of the plasma sheet, J. Geophys. Res., 114, 6214, doi:10.1029/2009JA014138, 2009.
Hamrin, M., Marghitu, O., R¨onnmark, K., Klecker, B., Andr´e, M., Buchert, S., Kistler, L. M., McFadden, J., R`eme, H., and Vaivads, A.: Observations of concentrated generator regions in the night-side magnetosphere by Cluster/FAST conjunctions, Ann. Geo-phys., 24, 637–649, doi:10.5194/angeo-24-637-2006, 2006. Hamrin, M., Norqvist, P., Marghitu, O., Buchert, S., Klecker,
B., Kistler, L. M., and Dandouras, I.: Occurrence and loca-tion of concentrated load and generator regions observed by Cluster in the plasma sheet, Ann. Geophys., 27, 4131–4146, doi:10.5194/angeo-27-4131-2009, 2009a.
Hamrin, M., Norqvist, P., Marghitu, O., Vaivads, A., Klecker, B., Kistler, L. M., and Dandouras, I.: Scale size and life time of energy conversion regions observed by Cluster in the plasma sheet, Ann. Geophys., 27, 4147–4155, doi:10.5194/angeo-27-4147-2009, 2009b.
plasmoid evolution with Geotail observations, J. Geophys. Res., 103, 4453–4466, doi:10.1029/97JA03240, 1998.
Koskinen, H. E. J. and Tanskanen, E. I.: Magnetospheric energy budget and the epsilon parameter, J. Geophys. Res., 107, 1415, doi:10.1029/2002JA009283, 2002.
Lu, G., Brittnacher, M., Parks, G., and Lummerzheim, D.: On the magnetospheric source regions of substorm-related field-aligned currents and auroral precipitation, J. Geophys. Res., 105, 18483– 18493, 2000.
Lyons, L. R.: Geomagnetic disturbances: characteris-tics of, distinction between types, and relations to interplanetary conditions, J. Atmos. Terr. Phys., 62, 1087–1114, doi:10.1016/S1364-6826(00)00097-3, http: //www.sciencedirect.com/science/article/B6VHB-41C2V5C-5/ 2/117f0f6bbd19db10bee5dd4466cc0360, 2000.
Lysak, R. L.: Auroral electrodynamics with current and voltage generators, J. Geophys. Res., 90, 4178–4190, 1985.
Marghitu, O., Hamrin, M., Klecker, B., R¨onnmark, K., Buchert, S., Kistler, L. M., Andr´e, M., and R`eme, H.: Cluster Observations of Energy Conversion Regions in the Plasma Sheet, pp. 453–459, Springer, doi:10.1007/978-90-481-3499-1 32, 2010.
Marghitu, O., Hamrin, M., Klecker, B., Vaivads, A., McFadden, J., Buchert, S., Kistler, L. M., Dandouras, I., Andr´e, M., and R`eme, H.: Experimental investigation of auroral generator regions with conjugate Cluster and FAST data, Ann. Geophys., 24, 619–635, doi:10.5194/angeo-24-619-2006, 2006.
Mayaud, P. N.: Derivation, meaning, and use of geomagnetic in-dices, American geophysical union, Washington, D.C., 1980. Paschmann, G., Haaland, S., and Treumann, R.: Auroral plasma
physics, Space Sci. Rev., 103, IX+, 2002.
Pulkkinen, T. I., Tanskanen, E. I., Wiltberger, M., Slavin, J. A., Nagai, T., Reeves, G. D., Frank, L. A., and Sigwarth, J. B.: Mag-netotail flows can consume as much solar wind energy as a sub-storm, J. Geophys. Res., 108, 1326, doi:10.1029/2001JA009132, 2003.
Rangarajan, G. K. and Iyemori, T.: Time variations of geomagnetic activity indices Kp and Ap: an update, Ann. Geophys., 15, 1271– 1290, doi:10.1007/s00585-997-1271-z, 1997.
Rangarajan, G. K.: Indices of geomagnetic activity., Geomag-netism, 3, 323–384, 1989.
Robert, P., Dunlop, M. W., Roux, A., and Chanteur, G.: Accu-racy of current density determination, in: Analysis methods for multi-spacecraft data, edited by: Paschmann, G. and Daly, P. W., ISSI/ESA, Bern, 1998.
Rosenqvist, L., Buchert, S., Opgenoorth, H., Vaivads, A., and Lu, G.: Magnetospheric energy budget during huge geomagnetic ac-tivity using Cluster and ground-based data, J. Geophys. Res., 111, A10211, doi:10.1029/2006JA011608, 2006.
Rostoker, G. and Bostr¨om, R.: Mechanism for driving gross Birke-land current configuration in auroral oval, J. Geophys. Res., 81, 235–244, 1976.
Slavin, J. A., Smith, M. F., Mazur, E. L., Baker, D. N., Hones Jr., E. W., Iyemori, T., and Greenstadt, E. W.: ISEE 3 observations of traveling compression regions in the earth’s magnetotail, J. Geo-phys. Res., 98, 15425–15446, doi:10.1029/93JA01467, 1993. Vogt, J., Haerendel, G., and Glassmeier, K. H.: A model for the