Fundação Getúlio Vargas
Escola de Pós-Graduação em Economia
Mestrado em Finanças e Economia Empresarial
Bernardo Prôa Bressane
CEO OVERCONFIDENCE AND THE IMPACT
ON M&A ACTIVITY
CEO OVERCONFIDENCE AND THE IMPACT
ON M&A ACTIVITY
BERNARDO PRÔA BRESSANE
Dissertação apresentada à Escola de Pós-Graduação em Economia da Fundação Getúlio Vargas como requisito parcial para obtenção do grau de Mestre em Finanças e Economia Empresarial.
Orientador: Marcelo Verdini Maia
BERNARDO PRÔA BRESSANE
CEO OVERCONFIDENCE AND THE IMPACT
ON M&A ACTIVITY
Dissertação apresentada à Escola de Pós-Graduação em Economia da Fundação Getúlio Vargas como requisito parcial para obtenção do grau de Mestre em Finanças e Economia Empresarial.
BANCA EXAMINADORA:
Marcelo Verdini Maia (orientador)
The Wharton School - University of Pennsylvania
Marco Antônio Cesar Bonomo EPGE-FGV/RJ
AKNOWLEDGEMENTS
To Marcelo Verdini Maia, my advisor, for the support, assistance and encouragement in developing this work.
To my parents who always gave me all the support in my personal and professional life.
To EPGE and its faculty, who have always offered all the support and assistance necessary to study.
RESUMO
O que gera fusões e aquisições? A presença de um viés de excesso de confiança pode afetar essas decisões entre os executivos? Este estudo complementa os trabalhos recentes que analisam as Fusões e Acquisições sob a ótica das finanças comportamentais e propõe a utilização de uma nova variável para medir o excesso de confiança. Através do uso de uma amostra formada por 8,895 fusões realizadas por 993 CEOs nos Estados Unidos – entre 1992 e 2008 – pode ser observao que CEOs que apresentam excesso de confiança tem 22% maiores chances de realizarem fusões.
PALAVRAS-CHAVE: Finanças Comportamentais, Excesso de confiança, Fusões e
Aquisições.
ABSTRACT
What drives mergers and acquisitions decisions? Can an overconfidence bias affect decisions within the management team? This study complements recent work developed within the behavioral finance analyses of Mergers & Acquisitions and proposes the use of new variable to measure overconfidence. Using a sample of 8,895 takeover transactions completed by 993 CEOs in the United States – between 1992 and 2008 – it can be noticed that overconfident CEOs have 22% higher odds of engaging in corporate takeovers than rational CEOs.
INDEX
Aknowledgements ... iv
Resumo... v
Abstract ... v
Index ... vi
Index of Tables ...vii
1 Introduction ... 1
2 Theory ... 4
2.1 Behavioral Finance and Overconfidence... 4
2.2 CEO Overconfidence and acquisitions... 5
3 Data ... 7
3.1 Company and CEO data ... 7
3.2 M&A data ... 10
4 Overconfidence and Acquisitions... 12
4.1 Measuring overconfidence... 12
4.2 Model Specification... 16
4.3 Results... 17
5 Conclusion... 21
6 References ... 22
Appendix A – Variable Definitions ... 24
Appendix B – Industry Classifications ... 25
Appendix C – Additional Regressions... 26
Panel A – logit models without bootstrapping... 26
Panel B – logit models with bootstrapping... 27
Panel C – logit models with one dimension clusters (Firm Effects)... 28
Panel D – logit models with one dimension clusters (Industry Effects) ... 29
INDEX OF TABLES
Table 1 – Summary of companies ... 9
Table 2 – CEO Overview ... 9
Table 3 – Summary of M&A database ... 11
Table 4 – Correlations... 16
Table 5 – Overconfidence and the impact on M&A... 18
1 INTRODUCTION
What drives mergers and acquisitions decisions? Can psychological biases affect those decisions within the management team? Those questioning have lead to a series of theories and analyses. Earlier studies in this area have reported the agency problem and the empire-building attitudes as the main causes while more recent papers have been looking at the behavioral drives affecting the management decisions, especially the overconfidence bias.
This study complements recent work developed within the behavioral finance explanation for mergers and acquisitions (M&A). By gathering data from several sources and forming a database sample consisting of 1,244 chief executive officers (CEOs) from 500 large public listed companies in the United States during a 17-years period and creating a logit model with a new variable to measure overconfidence, this study answers the aforementioned question and finds robust evidence that CEOs classified as overconfident have 22% higher odds of making corporate acquisitions.
Even though this work tests an overconfidence model in the US market, in a similar fashion as previous literature, it differs from those in two main aspects. First and foremost, the variable measuring overconfidence used here has not been used before. Here, overconfidence (OC) is measured through a bundle of four “sensor” variables that capture different characteristics that lead to an overconfident profile. Those “sensor” variables are formed with a review of CEOs’ compensation, stock ownership and options exercise and are better described on section 4.
The second difference aspect regards the period analyzed. Most of recent preeminent works not only have analyzed overconfidence using other measures but also considering a different time horizon. In this study, the model tests the variables over 17 years, from 1992 through 2008.
growing at an accelerated pace, reaching a record level in 2007 of USD 1.57 trillion in the United States and USD 4.37 trillion globally1.
Fanto (2001) makes a good presentation about the mega-mergers that happened in the 90’s and early in the 2000’s. Some of the biggest deals so far were done during that period. Transactions such as Warner-Lambart/Pfizer, Exxon/Mobil, Travelers/Citicorp and Chevron/Texaco have created some of the largest companies in world and generated at the time of the mergers great expectations from shareholders and management. In many cases however, those expectations were frustrated, with expected synergies never being extracted and resulting in value destruction for shareholders of the acquiring companies.
Perhaps one of the best examples of frustrating mergers was the USD 182 billion full stock acquisition of Time Warner by America Online. The transaction, announced on January 10th 2000 under the leadership of CEO Gerald Levin, was expected to create a digital media powerhouse and to extract synergies of USD 1 billion per year. The following years, however, showed that management was completely wrong. The internet bubble burst and only then people realized that growth assumptions were highly overstated and misguided.
Interestingly, in this case the management team of both companies held options packages and exposure to the company’s shares performance. So, it was not a matter of agency issues and misalignment of interest between shareholders and management. The problem was that management truly believed on the valuation presented and growth perspectives. So, what could have lead management to think this way? The answer is clear: overconfidence. Overconfidence leads management to believe they can do better than others, that they can perform better and extract more synergies, resulting in an overestimation of valuations and consequently, to an overbidding and value destruction.
In the case of the America Online and Time Warner transaction, this evidence was confirmed ten years after the deal. The merger was undone late on 2009, with the spin-off of AOL assets and, in an interview2 for CNBC on January 2010, former CEO
1 Hall, Jessica (19 December 2007). "U.S. mergers hit new record, but lag Europe". Reuters
2 Interview granted by Gerald Levin to CNBC’s Squawk Box on January 4, 2010. Transcript is available
Gerald Levin publically apologized to shareholders and called the merger as “the worst deal of the century”.
In his interview, Mr. Levin also acknowledged the fact that the CEO indeed has a great influence on takeover decisions and should be the held responsible for the consequences: “I was the CEO; I was in charge; I’m really very sorry about the pain and suffering and loss this has caused. I take responsibility. It wasn’t the board; it wasn’t my colleagues. It wasn’t the bankers and lawyers.”
It is exactly due to this influence and power that a CEO can exercise on takeover decisions that this study analyzes the consequences and effects of a psychological bias. The next section will discuss the theoretical foundations of overconfidence and previous literature regarding overconfidence within acquisitions. Section 3 will explain the data gathered as well as its sources and section 4 will formally present the model tested as well as the variables used and its results. Finally, section 5 will conclude the study.
2 THEORY
2.1 Behavioral Finance and Overconfidence
After Eugene Fama developed the Efficient Market Hypothesis in the 60’s, a series of studies and analyses have been developed questioning both the theory and its key assumption, the rational behavior of individuals.
During the second half of the twentieth century, researchers found and studied a series of anomalies observed in the market, such as the weekend effect, above average returns on small caps companies, IPO mispricing and outperformance of low price to earnings. These studies provided researches with clear evidence that the market definitely does not follow a random walk3 and that individuals regularly act in an irrational manner.
After those anomalies were identified, the studies changed the scope of looking at the economic impact of the anomalies and focused on understanding and analyzing the underlying cause of such. By taking a different approach and looking at the psychological aspect of the action taken by the individual, researches identified a series of psychological biases – such as overconfidence4, anchoring5, framing6 and prospect theory7 – that deviates them from the rational behavior and leads to irrationality during
the decision making process.
Two of the key psychological biases that have been thoroughly analyzed in the past years are the overconfidence and optimism biases, which are closely related and provide a similar effect. Fischhoff, Slovic and Lichtenstein (1977) presented evidence
3
Random walk theory stipulated that stock prices move in a random walk, with no correlation with past prices.
4 Langer (1975) defines overconfidence as an overestimation of one’s own ability and of outcomes
relating to one’s personal situation.
5 Kahneman and Tversky (1974) found that individuals, when asked to set estimates about a particular
issue tend to set a reference point and anchor their estimates around that anchor, independently of having any base to confirm whether the anchor is an appropriate reference.
6 Kahneman and Tversky (1981) showed that depending on how a question is structured and presented to
individuals the answers may lead to opposite conclusions.
7
that individuals have a more optimistic risk perception about facts than what is observed in reality. According to their work, individuals overestimate the probability of certain events been realized. In the sample analyzed, events that were classified as certain only occurred in 80% of the situations, while events that were judged as impossible occurred in 20% of the cases.
In Weinstein (1980), the author conducted a survey with university students which indicated that most people have an optimistic view about the future. In the survey, most of the students indicated that they had better chances of living more than 80 years and lower probability of having a heart attack or developing cancer.
Buehler, Griffin and Ross (1994) also performed a survey with university students. This time, the students were asked to estimate how many days would be necessary to complete their honor thesis as well as an academic report and a non academic project. In all three situations the students underestimated the amount of time needed. A similar overconfidence experiment was presented in Kahneman, Higgins e Riepe (1998), where a survey indicated that 80% of the participants evaluated themselves as better drivers than average.
2.2 CEO Overconfidence and acquisitions
Recently, a large number of studies have been investigating the consequences of those psychological biases within corporations and, especially, within the management and board of directors of publicly listed companies. Those studies have been focusing in two important aspects: (i) managerial overconfidence and (ii) the role and design of compensation incentives for managers.
March and Shapira (1987) continued the analysis performed by Roll and also found evidence of a strong relationship between managerial overconfidence and acquisitions. The authors argument that CEOs of acquiring companies have an illusion of control over the outcome of the combined entity. Overconfident acquiring CEOs believe they can perform better than the current management and, therefore, underestimate probabilities of an eventual failure.
In a recent and well documented work, Malmendier and Tate (2003) developed a model to measure the effect of overconfidence on takeovers based in a theoretical framework in which managerial overconfidence plays two key roles in acquisitions: (i) overestimation of the value created by the merger due to the belief that the manager can perform better than the current management of the target company and the underestimation of the potential downside risk; (ii) overestimation of the company’s current value caused by the overvaluation of future returns of the company’s projects. In their model, the authors created three different measures of overconfidence, using the timing to exercise options as primary tool for evaluation. The first, holder 67, classified the CEO as overconfident if he holds options that are more than 67% in-the-money. The second, “longholder”, classifies CEO as overconfident if he holds any in-the-money option until expiration. The last measure, “netbuyer”, is based on additional shares acquired by the CEO in the open market.
Brown and Sarna (2006) tested a similar model for the Australian market using a review of news articles about the CEO as the proxy for overconfidence8 and added a new component: CEO Dominance9. The authors included this new variable to extract
the power that the CEO can exercise in corporate decisions and, therefore, would give the CEO a greater ability to impose his overconfidence.
8 The authors review news articles about the CEOs and classifies them as “(a) confident (b) optimistic or
(c) reliable, cautions, conservative practical, frugal, disciplined, conscientious, not confident or no optimistic”
9 CEO Dominance is defined by Brown and Sarna (2006) as “the capacity of an individual to exert their
3 DATA
3.1 Company and CEO data
This study analyzes a sample consisting of CEOs of 500 publicly listed companies over a period covering 17 years. To construct the initial part of the main database, the first information gathered was the list of the companies that composed the S&P 500 index on December 31st 2008. After those 500 companies were identified, the database building process began.
The second step of the process was to gather the financial and descriptive annual data provided by each company in their annual reports and proxy statements during the period covering all the years between 1992 and 2008, those inclusive. In order to collect all data necessary to estimate the proposed model10, three different databases were used: Compustat11 and Reuters12 provided data about the company’s financials and ExecuComp13 database provided information about each company’s executives and their compensation. More detailed information about each data gathered is presented below.
Data extracted from the Compustat database:
- Total Assets: total amount of assets at the beginning of each year;
- Total Shares: total amount of shares outstanding at the end of each year;
- CapEx: total amount of capital expenditures during the year;
- Share Price: closing value of the company’s common shares on the last trading day of the year;
- Industry: classification of each company in a particular industry based on NAICS standards;
10
The model will be presented in section 4
Data extracted from Reuters:
- Cash Flows: total cash generated by operating activities;
Data extracted from the ExecuComp database:
- Basic CEO description: name, age and gender of each CEO;
- Title: position within the company occupied by the executive;
- Options Granted: total value of the options granted reported by the company;
- Options Exercise: number of exercisable options that were exercised;
- Exercisable Options: total number of in-the-money options that have been granted for the CEO in previous years and are exercisable but that has not been exercised yet;
- Total Compensation of CEO: sum of the salary, bonus, value of options granted, value of stock awards granted and long-term incentive payouts for each CEO;
- Total Compensation of Top Executives: sum of the salary, bonus, value of options granted, value of stock awards granted and long-term incentive payouts of the top 5 executives of each company;
- Stock Ownership: total amount of shares owned by the CEO.
As a result of this additional criterion, the initial sample was narrowed down to 993 CEOs of 485 companies, a total of 6,969 observations for each variable included in the model. A summary of the data analyzed is presented in Table 1 and Table 2 below.
Table 1 – Summary of companies
Mean Median SD Min Max
Mkt Cap (USD million) 21,367 8,258 43,411 76.9 600,886
Assets (USD million) 31,150 7,267 106,811 58.2 2,175,052
Earnings / Price 0.05 0.05 0.03 0.00 0.96
Return on Assets 0.06 0.05 0.11 -5.78 0.91
Operating Cash Flow (USD million) 1,401 573 3,403 -93,218 57,599
CashFlows / Assets 0.09 0.09 0.11 -5.00 0.94
Total Number of Companies 485
Industry Breakdown
Manufacturing 41.6% Professional, Scientific & Technical Srvs 2.1%
Finance and Insurance 14.8% Construction 1.6%
Information 8.5% Wholesale Trade 1.6%
Retail Trade 7.0% Waste Management and Remediation 1.6%
Utilities 6.6% Accommodation and Food Services 1.4%
Health Care and Social Assistance 1.2%
Conglomerates 0.6%
Real Estate and Rental and Leasing 2.9% Agriculture, Forestry, Fishing & Hunting 0.4%
Transportation and Warehousing 2.5% Educational Services 0.2%
Mining, Quarrying, and Oil and Gas
Extraction 5.2%
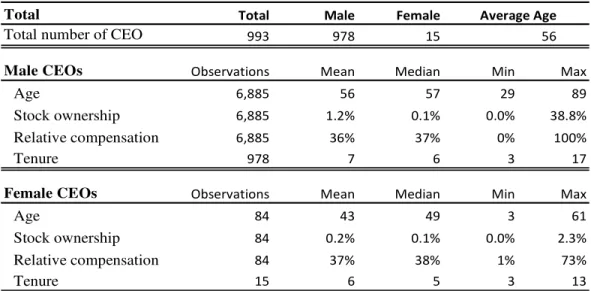
Table 2 – CEO Overview
Total Total Male Female Average Age
Total number of CEO 993 978 15 56
Male CEOs Observations Mean Median Min Max
Age 6,885 56 57 29 89
Stock ownership 6,885 1.2% 0.1% 0.0% 38.8%
Relative compensation 6,885 36% 37% 0% 100%
Tenure 978 7 6 3 17
Female CEOs Observations Mean Median Min Max
Age 84 43 49 3 61
Stock ownership 84 0.2% 0.1% 0.0% 2.3%
Relative compensation 84 37% 38% 1% 73%
3.2 M&A data
In order to construct the full database for the proposed model, it’s necessary to complement the CEO and company data with the information about the flow of merger and acquisitions taking place within the sample period. To do so, the following information was collected from Bloomberg:
- Target Company: includes both the target’s name and ticker;
- Acquirer Company: includes the acquiring firm’s name and ticker;
- Date: announcement date of the acquisition;
- Deal Status: final status of the transaction. This variable can assume three possible outcomes: completed, terminated or pending;
- Percentage Owned: percentage of target’s outstanding shares already owned by the acquiring firm;
- Percentage Sought: percentage of target’s outstanding shares which the acquiring firm intends to get if the transaction is successfully completed.
The initial sample resulted in a total of 13,261 takeover transactions over which two additional selection criteria were implemented. The first criterion was related to the deal status. Transactions classified either as terminated or pending were abandoned. This ensures that only the ones that were actually completed are analyzed.
having voting control and being able to consolidate the target’s results in the acquiring firm’s financial statements14.
As a result of these criteria, the initial sample of 13,261 transactions was reduced to 8,895 deals. Table 3 below presents a summary of the final sample.
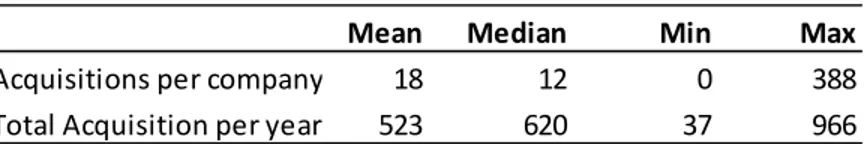
Table 3 – Summary of M&A database
Initial Sample 13,261 transactions
Final Sample 8,895 transactions
Most acquisitive Company: General Electric Company
Mean Median Min Max
Acquisitions per company 18 12 0 388
Total Acquisition per year 523 620 37 966
Break down of number of transactions
1992 0.4% 1998 6.9% 2004 7.6%
1993 1.3% 1999 10.0% 2005 8.9%
1994 1.2% 2000 10.9% 2006 9.2%
1995 1.3% 2001 8.5% 2007 9.2%
1996 1.6% 2002 7.1% 2008 6.7%
1997 2.3% 2003 7.0%
Break down of USD amount of transactions
1992 0.1% 1998 13.4% 2004 5.8%
1993 0.7% 1999 9.7% 2005 8.6%
1994 1.1% 2000 15.2% 2006 9.4%
1995 1.5% 2001 7.6% 2007 6.5%
1996 2.8% 2002 3.9% 2008 5.3%
1997 3.7% 2003 4.8%
4 OVERCONFIDENCE AND ACQUISITIONS
4.1 Measuring overconfidence
As discussed in the previous sections, there’s a solid rationale for expecting a positive impact of overconfidence on takeovers decisions. The main challenge on this field however, is to determine whether or not a given CEO is overconfident.
Past studies have used a vast range of variables trying to capture different angles of CEO behavior. The aforementioned, Malmendier and Tate (2003) have innovated the research on this area by creating variables extracting that reflects CEOs behavior based on the timing of option exercises.
The argument defended by the authors is clear: naturally, a CEO is highly exposed to the company’s performance and therefore, should avoid delaying the option exercise in order to reduce the exposure to the idiosyncratic risk of the company. While his job, salary and bonuses are directly dependent on the company’s performance, house, cars and, even retirement plans, are also often exposed to the firm’s shares. If anything goes wrong with the company during his tenure, the CEO would be fired, losing salary and bonuses in addition to be left holding shares and options potentially trading at much lower levels. It’s also worth mentioning that when the CEO leaves the company all outstanding stocks and options awards that were not vested15 are immediately canceled.
Therefore, it’s wise to say that differently from a rational investor16, a rational
CEO would be inclined to reduce his exposure on this idiosyncratic risk before maturity. Additionally, since companies and market regulators have stringent polices for insider trading17 and holding short positions, the CEO is not able to hedge his holdings and the option exercise is really the only accessible way to reduce this exposure. Thus, as long
15 Most companies have a compensation policy that grants options with a ten years maturity but can only
be exercised after a vesting period. Usually the options have a vesting schedule that starts after year 4 and lasts until year 9.
16
Option theory shows that a rational investor has no gain on exercising options before maturity.
17 The Securities and Exchange Commission (SEC), under the provisions of Section 16 of the Exchange
as the options have already been vested and are in-the-money, it’s reasonable to expect that a CEO would be willing to exercise at least a portion of those instead of holding them until maturity.
Malmendier and Tate (2003) performs a careful review of the timing of those exercises and creates variables based on how much in-the-money the option holdings of a given CEO are and also if the CEO holds any option until maturity. Maldendier and Tate (2008) complements the 2003 work and includes an additional subjective variable measuring how the press coverage portraits the CEOs.
Here, overconfidence is presented and tested by a different and new variable – OC – which is a binary variable where 1 signifies that a given CEO is classified as overconfident. In order to be able to make such assessment, four “sensor” variables are created. The objective of those “sensor” variables is to capture from two different approaches if CEOs have and can exercise overconfidence within the firm. The “sensor” variables are also binary assuming the value of 1 when the stipulated threshold is reached.
The first approach analyzes how the CEO behaves. As aforementioned, CEOs should be willing to reduce their exposure to the idiosyncratic risk of the company. An overexposure to the company’s risk implies that the CEO underestimates the risk of failure on current projects and believes the market is improperly undervaluing his company (otherwise, he would exercise the options and take the profits). In order to capture this overconfidence factor that results in those overvaluations of future results and underestimation of risks, two “sensor” variables are used:
in-the-money vested option are classified as overconfident under this “sensor”.
(ii) Sensor 2: Ownership – another indicator of overexposure to the company’s idiosyncratic risk can be measured by the exposure to the company’s shares. Similarly as discussed with options exercise, holding a significant amount of shares leaves once again the CEO overexposed to the company’s performance and indicates that the CEO has strong beliefs that he will be better than others at extracting outstanding results in the next years. CEOs that hold more than 20% of the company’s shares were classified as overconfident
The second approach evaluates if the company creates an environment for overconfident CEOs to expand their influence on decisions within the company. As mentioned on section 1, former America Online CEO Gerald Levin, acknowledged that his individual opinion an thoughts had a great influence on the decision making process. In order to capture whether the company overvalues the opinion and work of the CEO, two variables were created:
(iii) Sensor 3: Relative Compensation – measures the importance of the CEO within the company by comparing his compensation with the other top executives. The rationale behind this “sensor” is to evaluate if a company excessively remunerates the CEO and, therefore, creates a big discrepancy of power between the top executive. This variable was computed by dividing the value of the CEO’s total compensation in a given year by the total compensation of the top 5 executives of the firm in each year. In this study, CEOs whose compensations were above 40% of the total remuneration pool of the top 5 executives are understood to have an above average authority that allows his overconfidence to influence corporate decisions.
to reduce misalignment of interests, leaving management more sensitive to the overall performance of the company’s stock price. However, since option’s price moves in a much faster pace than the underlying stock, an excessive amount of options may lead management to behave more aggressively in order to generate large sums of profits with their options. Options grants that exceeded 20% of the total compensation18 were classified as above average.
Using these four “sensor” variable as proxies for overconfidence enabled the construction of a strong and unified proxy for overconfidence. If a CEO presents positive results in at least three of the four criteria, he is considered overconfident under the OC variable.
In addition to the OC measure, two other related variables are added to the model. The first one is “Chairman” which is also a binary variable that assumes the value of 1 when the CEO is also the Chairman of the Board of Directors. The reason for this inclusion is that since the Board of Directors are supposed to oversight the management team and approve decisions such as compensation policies and takeovers, if an individual is both CEO and Chairman, he would have a huge ability to impose and enforce his will in the decision making process. In that sense, if the CEO is overconfident, he would be able to act on his own without stronger supervision.
The third and last variable related to overconfidence is “Tenure”. This is an important variable to be used since CEOs that have been in that position for a long time will develop the “better-than-average” belief and as a result might ignore new evidences that could prove him otherwise. In such situation he would be inclined to evaluate new projects as something relatively simple, underestimating risks and overvaluing the outcome.
4.2 Model Specification
The objective of this study is to measure the impact of the overconfidence on the acquisition process. With the data explained on section 3 grouped in a unified database and the calculation of the variables to be tested explained in the previous topic, a data panel is created and the following logit model was created:
(1)
Where, y is a dependent binary variable that assumes the value of 1 if the CEO announced at least 1 acquisition that was successfully completed during the year. O is the group of variables associated with overconfidence (OC, Chairman and Tenure) and X is a set of control variables that are added to the model. X includes three control variables: (i) the size of each company measured by the logarithm of the total assets at the beginning of the year; (ii) the level of cash flows, measured as the total cash generated from operating activities less capital expenditures, and; (iii) the market valuation of the company measured by Tobin’s Q ratio and calculated as the market value of the company’s assets divided the book value of those assets.
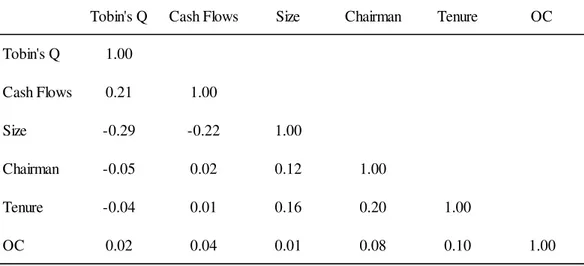
Table 4 – Correlations
All variables are defined in Appendix A. Number of observations = 6969.
Tobin's Q Cash Flows Size Chairman Tenure OC
Tobin's Q 1.00
Cash Flows 0.21 1.00
Size -0.29 -0.22 1.00
Chairman -0.05 0.02 0.12 1.00
Tenure -0.04 0.01 0.16 0.20 1.00
4.3 Results
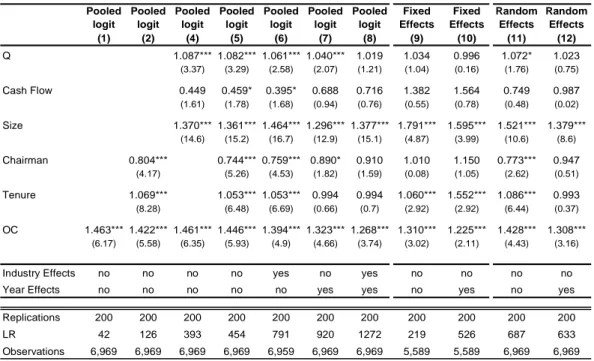
The model presented with equation 1 is estimated using three different methods. Columns 1 through 8 in Table 5 present the results for the pooled method. Results of Table 5 are run with 200 bootstrapping replications (results for estimations with no bootstrapping replication are presented in Appendix B). The first column shows the logit estimation of the OC variable alone, presenting 46% higher odds and strong significance. This result holds true even after adding the remaining variables of the models. Column 2 introduces the two other overconfidence measures in the model, both presenting significant coefficients but Chairman’s coefficient shows an unexpected odds ratio below 1, result of a negative coefficient and against the initial expectation that his measure should be positively related with the level of acquisitions. Column 3 shows the regression with OC as the only overconfidence independent variable but including all the control variables. OC, Size and Tobin’s Q are reported as expected, with positive and strong odds ratio, however, Cash Flows surprise the results by presenting neither positive coefficient nor significance.
Columns 5 to 8 report the result of the pooled method with all variables. The difference among those columns is whether or not dummies for industry fixed effects and year effects are included in the model. As it can be seen in Table 5, with the exception of OC and size, all other variables face a material loss of significance when the dummies are introduced in the model, raising questions about the possible existence of other effects that were not captured in the pooled method.
As it has been seen on both fixed effects and pooled methods, the inclusion of dummies for the years within the sample have impacted the variables’ estimation and their significance. This result does not come as a surprise during the 17-years period analyzed as some cycles of growth and crisis occurred within those years, i.e. Asian Financial crisis (1998), dot.com bubble (2001) as well as the collapse of financial institutions in 2008. All those boom and bust periods have a direct impact on credit availability and, therefore, in M&A market19. Thus, it’s prudent to include those dummies for the years in the model.
Table 5 – Overconfidence and the impact on M&A
The dependent variable “Acquisition” is binary and assumes the value 1 when a CEO announces at least 1 acquisition that was successfully completed during the year. Independent variables Tobin’s Q, Cash Flows, Size, Chairman, Tenure and OC are defined in Appendix A. Standard errors are estimated with 200 bootstrapping replications. Industry groups are base on NAICS codes. Coefficients are presented as odd ratios. Z statistics are in parentheses. *significant at 10%; ** significant at 5%; ***significant at 1%. Total amount of observation in the panel is 6969. Column (3) was omitted for presentation purposes. The complete table is presented on Appendix C.
Pooled logit Pooled logit Pooled logit Pooled logit Pooled logit Pooled logit Pooled logit Fixed Effects Fixed Effects Random Effects Random Effects (1) (2) (4) (5) (6) (7) (8) (9) (10) (11) (12)
Q 1.087*** 1.082*** 1.061*** 1.040*** 1.019 1.034 0.996 1.072* 1.023 (3.37) (3.29) (2.58) (2.07) (1.21) (1.04) (0.16) (1.76) (0.75)
Cash Flow 0.449 0.459* 0.395* 0.688 0.716 1.382 1.564 0.749 0.987 (1.61) (1.78) (1.68) (0.94) (0.76) (0.55) (0.78) (0.48) (0.02)
Size 1.370*** 1.361*** 1.464*** 1.296*** 1.377*** 1.791*** 1.595*** 1.521*** 1.379*** (14.6) (15.2) (16.7) (12.9) (15.1) (4.87) (3.99) (10.6) (8.6)
Chairman 0.804*** 0.744*** 0.759*** 0.890* 0.910 1.010 1.150 0.773*** 0.947 (4.17) (5.26) (4.53) (1.82) (1.59) (0.08) (1.05) (2.62) (0.51)
Tenure 1.069*** 1.053*** 1.053*** 0.994 0.994 1.060*** 1.552*** 1.086*** 0.993 (8.28) (6.48) (6.69) (0.66) (0.7) (2.92) (2.92) (6.44) (0.37)
OC 1.463*** 1.422*** 1.461*** 1.446*** 1.394*** 1.323*** 1.268*** 1.310*** 1.225*** 1.428*** 1.308*** (6.17) (5.58) (6.35) (5.93) (4.9) (4.66) (3.74) (3.02) (2.11) (4.43) (3.16)
Industry Effects no no no no yes no yes no no no no Year Effects no no no no no yes yes no yes no yes
Replications 200 200 200 200 200 200 200 200 200 200 200 LR 42 126 393 454 791 920 1272 219 526 687 633 Observations 6,969 6,969 6,969 6,969 6,959 6,969 6,969 5,589 5,589 6,969 6,969
Finally, the model was also run with random effects. The results are presented in columns 11 and 12, in a similar structure as the Fixed Effects. Once again the inclusion of the years dummies result in several variables becoming insignificant, however, even on those scenarios, the OC variable remains robust and significant, presenting small variations both on the odds ratio and the significance level.
As it can be observed in table 5, while the odds ratio and significance of most variables present big changes depending on the model utilized, “OC” odds ratio remains stable and strong ranging between 1.26 and 1.46. This positive behavior on OC is not observed in other overconfidence measures. Surprisingly, “Chairman” presents odds ratio below 1 in most of the models, indicating an opposite interpretation to the argument proposed in section 4: the results shows that executives acting both as CEO and chairman have lower odds of being involved in M&A transactions. This variable also materially loses significance when estimated with fixed and random effects and including time dummies for the years. This evidence, along with the Hausman test, highlights the importance of using the fixed effects models with time dummies. “Tenure” also presents relatively different results depending on the model estimated, but reports a strong and robust coefficient when the fixed effects are included in the model along with the time dummies.
On the side of the control variables, both “Cash Flows” and “Tobin’s Q” remain insignificant in most models. “Size”, on the other hand, presents a similar path as observed with “OC”: strong and highly significant independently on whether fixed or random effects are included or not.
After estimating all models, the Hausman test was used to compare them and the fixed effects regression was considered the most appropriate. In order to improve the analysis and generate more robust results additional tests and regressions were performed, such as using clusters for standard error estimations. Although not mentioned before, the existence of endogeneity within the model was rejected after running a two-stage least square regression simulation.
Table 6 – Pooled logit model with clusters
The dependent variable “Acquisition” is binary and assumes the value 1 when a CEO announces at least 1 acquisition that was successfully completed during the year. Independent variables Tobin’s Q, Cash Flows, Size, Chairman, Tenure and OC are defined in Appendix A. Standard errors are adjusted for two dimensions of clusters: (i) 17 clusters for industry effect and (ii) 17 clusters for years effects. Coefficients are presented as odd ratios. Z statistics are in parentheses. *significant at 10%; ** significant at 5%; ***significant at 1%. Total amount of observation in the panel is 6969. Additional clusters models are presented on Appendix C.
Pooled logit
Pooled logit
Pooled logit
Pooled logit
Pooled logit
Pooled logit
Pooled logit
Pooled logit (1) (2) (3) (4) (5) (6) (7) (8)
Q 1.0870*** 1.0823*** 1.0614*** 1.0403 1.0198
(2.17) (2.18) (2.18) (1.39) (1.28)
Cash Flow 0.4490 0.4595 0.3951 0.6881 0.7167
(1.01) (1.05) (0.89) (0.85) (0.51)
Size 1.4696*** 1.3703*** 1.3617*** 1.4643*** 1.2969*** 1.3779***
(5.3) (12.7) (13.5) (19.5) (9.64) (10.6)
Chairman 0.8040*** 0.7441*** 0.7593*** 0.8902* 0.9106***
(2.34) (3.46) (3.46) (1.8) (2.07)
Tenure 1.0698*** 1.0537*** 1.0536*** 0.9941 0.9936
(2.87) (2.45) (2.54) (0.49) (0.75)
OC 1.4637*** 1.4224*** 0.0755*** 1.4615*** 1.4466*** 1.3946*** 1.3233*** 1.2683***
(5.02) (5.15) (6.63) (5.37) (5.89) (5.9) (4.68) (4.34)
Industry Effects no no no no no yes no yes
Years Effects no no no no no no yes yes
Industry Cluster yes yes yes yes yes yes yes yes
Firm Cluster no no no no no no no no
5 CONCLUSION
This study investigates the impact of CEO overconfidence on M&A activity. It was argued that overconfidence causes CEOs to behave irrationally, underestimating risks and overestimating valuations and, therefore, should result in a more aggressive attitude towards mergers and acquisition.
To test this prediction, four “sensor” variables were created and intended to capture evidence of overconfidence behavior, attitude and development opportunities within the companies. Those “sensors” allowed a new measure of overconfidence to be created and the prediction to be tested. The model was tested in a large sample of 8,895 takeovers performed by 993 CEOs of 485 US companies over a period of 17 years and the result supported the initial prediction, indicating that CEOs classified as overconfident under the criteria described on section 4.1, have 22% higher odds of making M&A transactions than the regular, non-overconfident CEO.
In addition, the models also find evidence that holding the office over a long period also has a positive impact on the probability of conducting mergers. On the other hand, the expectation that officers holding both the CEO and Chairman positions would present a more acquisitive behavior was not confirmed by the model. The regression not only indicated low odds ratios for “Chairman” but, in most cases, also presented insignificant coefficients.
An interesting aspect that is not covered under this study is the financial impact of the takeovers for the acquiring firm. The analysis performed here is limited to whether overconfidence impacts the M&A decisions. No assessment is made to whether the acquisitions were accretive or if the management was able to extract the synergies originally expected.
6 REFERENCES
BARBERIS, N.; XIONG, W., 2006, “What Drives the Disposition Effect? An Analysis of a long standing preference-based explanation”. Yale University and Princeton University.
BROWN, R. and SARMA, N. 2007. “CEO Overconfidence, CEO Dominance and Corporate Acquisitions”. Journal of Economics and Business, vol. 59, issue 5, pages 358-379
BUEHLER, R; GRIFFIN, D; ROSS, M. 1994. “Exploring the Planning Fallacy: Why People Underestimate their Task Completion Times”. Journal of Personality and Social Psychology, v.67, p.366-381.
DOUKAS, J, and DIMITRIS P. 2007. “Acquisitions, Overconfident Managers and Self-Attribution Bias.” European Financial Management 13:3, 531-577
FISCHHOFF, B; SLOVIC, P; LICHTENSTEIN, S. 1977. "Knowing with certainty: The appropriateness of extreme confidence," Journal of Experimental Psychology: Human Perception and Performance, v.3, p.552-564.
GERVAIS, S; HEATON, J and ODEAN, T, 2003, “Overconfidence, Investment Policy, and Executive Stock Options”. Working Paper, Duke University.
HALL, B; MURPHY, K, 2002. “Stock Options for Undiversified Executives”. Journal of Accounting & Economics, Vol. 33, No. 2
HAYWARD, M; HAMBRICK, D. 1997. “Explaining the Premiums Paid for Large Acquisitions: Evidence of CEO Hubris.” Administrative Science Quarterly 42:1, 103- 127.
HEATON, J. B. 2002. “Managerial Optimism and Corporate Finance Managerial Optimism and Corporate Finance.” Financial Management 31:2, 33-45.
HRIBRAR, P; YANG, H. 2006. “CEO Confidence, Management Earnings Forecasts, and Earnings Management”. Working paper
HUANG, J; SUDARSANAM, S. 2006. Managerial Incentives, Overconfidence, Risk-taking, and Acquirer Shareholder Value Creation in Mergers and Acquisitions.” Working paper.
KAHNEMAN, D; TVERSKY, A. 1974. “Judgment Under Uncertainty: Heuristics and Biases”. Science, v.185 n.4157, p. 1124-1131.
KAHNEMAN, D; TVERSKY, A. 1981. “The framing of decisions and the psychology of choice”. Science v.30 n. 4481, p.453-458.
KAHENEMAN, D; HIGGINGS, E; RIEPE, M. “Aspects of Investor Psychology: Beliefs, preferences, and biases investment advisors should know about.” Journal of Portfolio Management, v.24, n.4.
LANGER, E. J. 1975. "The Illusion of Control," Journal of Personality and Social Psychology (32:2), 1975, pp. 311-328.
LORD, C; ROSS, L; LEPPER, M. 1979. “Biased Assimilation and Attitude Polarization: The Effects of Prior Theories on Subsequently Considered Evidence”. Journal of Personality and Social Psychology, v.37, n.11. p.2098-2109.
MALMENDIER, U. and TATE, G. 2005. “Does Overconfidence Affect Corporate Investment? CEO Overconfidence Measures Revisited”, European Financial Management, 11: 649-659.
MALMENDIER, U; TATE, G. 2003. “Who makes acquisitions? CEO overconfidence and the market’s reaction”. AFA 2004 San Diego Meetings.
MALMENDIER, U; TATE, G. 2008. “Who makes acquisitions? CEO overconfidence and the market’s reaction”. Journal of Financial Economics, vol. 89, issue 1, pages 20-43
MARCH, J.G; SHAPIRA, Z. 1987. "Managerial perspectives on risk and risk taking," Management Science, 33(11), 1404-1418.
ROLL, R. 1986. “The hubris hypothesis of corporate takeovers”. Journal of Business 59: 197-216.
TAFFLER, R; LIU, Y. 2008. “CEO overconfidence in M&A decision making”. Working Paper, University of Edinburgh.
PETERSEN, M, 2009, “Estimating Standard Errors in Finance Panel Data Sets: Comparing Approaches”, Review of Financial Studies, Review of Financial Studies, Volume 22, pp 435-480.
APPENDIX A – VARIABLE DEFINITIONS
Control Variables
Tobin's Q Market Value of Assets divided by Book Value of Assets
Market Value of Assets Fiscal year closing price multiplied by total number of shares outstanding.
Book Value of Assets Total assets - Total liabilities - Preferred stock + Deferred taxes + Convertible debt
Cash Flows Total cash generated from operating activities minus capital expenditures
Size Natural logarithm of acquirer total assets at the end of last fiscal year (before the deal announcement year)
Overconfidence Measures
OC Binary variable equal to 1 if CEO presents at least three posite results
Chairman Binary variable equal to 1 if CEO is also the Chariman of the board of directors
Tenure Number of years in which the CEO has been holnding his office
Sensor Variables
Relative Compensation
Total CEO Compensation The sum of: (i) salary, (ii) bonus, (iii) stock awards, (iv) option awards, (v) long-term incentive payouts and (vi) personal benefits
Total Management Compensation The sum of the total compensation received by the top 5 executives
Options Granted Total value of the options granted during the year divided by the Total CEO Compensation
Options Exercise
Total amount of options exercised by the CEO during the year divided by the sum of: (i) total exercisable options outsstanding and (ii) the total amount of options exercised buring the year
Ownership The number of ordinary shares of the company in which the CEO has a beneficial interest divided by the total number of shares outstanding.
Dependent Vaiable
Acquisition Binary variable equal to 1 if the firm made at least one eventually successful acquisition during a particular year.
APPENDIX B – INDUSTRY CLASSIFICATIONS
NAICS code Industry
11 Agriculture, Forestry, Fishing and Hunting
21 Mining, Quarrying, and Oil and Gas Extraction
22 Utilities
23 Construction
31 Manufacturing
32 Manufacturing
33 Manufacturing
42 Wholesale Trade
44 Retail Trade
45 Retail Trade
48 Transportation and Warehousing
49 Transportation and Warehousing
51 Information
52 Finance and Insurance
53 Real Estate and Rental and Leasing
54 Professional, Scientific, and Technical Services
56 Administrative and Support and Waste Management and Remediation Services
61 Educational Services
62 Health Care and Social Assistance
72 Accommodation and Food Services
26
APPENDIX C – ADDITIONAL REGRESSIONS
Panel A – logit models without bootstrapping
The dependent variable “Acquisition” is binary and assumes the value 1 when a CEO announces at least 1 acquisition that was successfully completed during the year. Independent variables Tobin’s Q, Cash Flows, Size, Chairman, Tenure and OC are defined in Appendix A. Industry groups are base on NAICS codes. Coefficients are presented as odd ratios. Z statistics are in parentheses. *significant at 10%; ** significant at 5%; ***significant at 1%. Total amount of observation in the panel is 6969.
Pooled logit Pooled logit Pooled logit Pooled logit Pooled logit Pooled logit Pooled logit Pooled logit Fixed Effects logit Fixed Effects logit Random Effects logit Random Effects logit
(1) (2) (3) (4) (5) (6) (7) (8) (9) (10) (11) (12)
Q 1.087*** 1.082*** 1.061*** 1.040*** 1.020* 1.035** 0.997 1.072*** 1.024*
(6.32) (6.10) (4.67) (3.40) (1.86) (2.40) (0.24) (4.27) (1.83)
Cash Flow 0.449*** 0.459*** 0.395*** 0.688 0.716 1.382 1.565 0.750 0.988
(2.67) (2.61) (2.79) (1.41) (1.15) (0.65) (0.89) (0.91) (0.04)
Size 1.321*** 1.370*** 1.361*** 1.464*** 1.296*** 1.377*** 1.791*** 1.595*** 1.521*** 1.379***
(16.46) (16.93) (16.34) (17.28) (13.16) (13.74) (6.09) (4.56) (11.74) (8.87)
Chairman 0.804*** 0.744*** 0.759*** 0.890* 0.911 1.011 1.150 0.773*** 0.947
-3.98 (5.23) (4.71) (1.94) (1.51) (0.09) (1.11) (2.88) (0.58)
Tenure 1.069*** 1.054*** 1.054*** 0.994 0.994 1.061*** 1.552*** 1.086*** 0.993
-8.77 (6.63) (6.41) (0.66) (0.69) (3.64) (4.47) (7.62) (0.46)
OC 1.463*** 1.422*** 1.469*** 1.461*** 1.446*** 1.394*** 1.323*** 1.268*** 1.310*** 1.225** 1.428*** 1.308***
-6.48 -5.92 -6.43 (6.30) (6.07) (5.29) (4.45) (3.65) (3.25) (2.34) (4.54) (3.32)
Industry Effects no no no no no yes no yes no no no no
Years Effects no no no no no no yes yes no yes no yes
LR 42 126 332 393 454 791 920 1,272 219 526 687 633
Panel B – logit models with bootstrapping
The dependent variable “Acquisition” is binary and assumes the value 1 when a CEO announces at least 1 acquisition that was successfully completed during the year. Independent variables Tobin’s Q, Cash Flows, Size, Chairman, Tenure and OC are defined in Appendix A. Standard errors are estimated with 200 bootstrapping replications. Industry groups are base on NAICS codes. Coefficients are presented as odd ratios. Z statistics are in parentheses. *significant at 10%; ** significant at 5%; ***significant at 1%. Total amount of observation in the panel is 6969.
Pooled logit Pooled logit Pooled logit Pooled logit Pooled logit Pooled logit Pooled logit Pooled logit Fixed Effects logit Fixed Effects logit Random Effects logit Random Effects logit
(1) (2) (3) (4) (5) (6) (7) (8) (9) (10) (11) (12)
Q 1.087*** 1.082*** 1.061** 1.040 1.020 1.035 0.997 1.072* 1.024
(3.37) (3.29) (2.58) (2.07)** (1.21) (1.04) (0.16) (1.76) (0.75)
Cash Flow 0.449 0.459* 0.395* 0.688 0.716 1.382 1.565 0.750 0.988
(1.61) (1.78) (1.68) (0.90) (0.76) (0.55) (0.78) (0.48) (0.02)
Size 1.321*** 1.370*** 1.361*** 1.464*** 1.296*** 1.377*** 1.791*** 1.595*** 1.521*** 1.379***
(17.41) (14.63) (15.20) (16.79) (12.91) (15.12) (4.87) (3.99) (10.62) (8.60)
Chairman 0.804*** 0.744*** 0.759*** 0.890* 0.911 1.011 1.150 0.773*** 0.947
-4.17 (5.26) (4.53) (1.82) (1.59) (0.08) (1.05) (2.62)*** (0.51)
Tenure 1.069*** 1.054*** 1.054*** 0.994 0.994 1.061*** 1.552*** 1.086*** 0.993
-8.28 (6.48) (6.69) (0.66) (0.70) (2.92) (2.92) (6.44) (0.37)
OC 1.463*** 1.422*** 1.469*** 1.461*** 1.446*** 1.394*** 1.323*** 1.268*** 1.310*** 1.225** 1.428*** 1.308***
-6.17 -5.58 -6.06 (6.35) (5.93) (4.90) (4.66) (3.74) (3.02) (2.11) (4.43) (3.16)
Industry Effects no no no no no yes no yes no no no no
Year Effects no no no no no no yes yes no yes no yes
Replications 200 200 200 200 200 200 200 200 200 200 200 200
LR 42 126 332 393 454 791 920 1,272 219 526 687 633
28 Panel C – logit models with one dimension clusters (Firm Effects)
The dependent variable “Acquisition” is binary and assumes the value 1 when a CEO announces at least 1 acquisition that was successfully completed during the year. Independent variables Tobin’s Q, Cash Flows, Size, Chairman, Tenure and OC are defined in Appendix A. Standard errors are adjusted for 485 clusters related to individual firm effects. Coefficients are presented as odd ratios. Z statistics are in parentheses. *significant at 10%; ** significant at 5%; ***significant at 1%. Total amount of observation in the panel is 6969.
Pooled logit
Pooled logit
Pooled logit
Pooled logit
Pooled logit
Pooled logit
Pooled logit
Pooled logit
(1) (2) (3) (4) (5) (6) (7) (8)
Q 1.0870*** 1.0823*** 1.0614* 1.0403 1.0198
(2.38) (2.35) (1.88) (1.55) (1.02)
Cash Flow 0.4490 0.4595 0.3951 0.6881 0.7167
(1.07) (1.07) (1.07) (0.73) (0.57)
Size 1.3215*** 1.3703*** 1.3617*** 1.4643*** 1.2969*** 1.3779***
(9.25) (10.0) (9.79) (10.3) (7.53) (8.26)
Chairman 0.8040*** 0.7441*** 0.7593*** 0.8902 0.9106
(2.48) (3.28) (3.25) (1.23) (1.04)
Tenure 1.0698*** 1.0537*** 1.0536*** 0.9941 0.9936
(6.25) (4.73) (4.93) (0.45) (0.52)
OC 1.4637*** 1.4224*** 1.4696*** 1.4615*** 1.4466*** 1.3946*** 1.3233*** 1.2683***
(4.84) (4.48) (4.8) (4.71) (4.61) (4.06) (3.41) (2.84)
Industry Effects no no no no no yes no yes
Years Effects no no no no no no yes yes
Industry Cluster no no no no no no no no
Firm Cluster yes yes yes yes yes yes yes yes
Panel D – logit models with one dimension clusters (Industry Effects)
The dependent variable “Acquisition” is binary and assumes the value 1 when a CEO announces at least 1 acquisition that was successfully completed during the year. Independent variables Tobin’s Q, Cash Flows, Size, Chairman, Tenure and OC are defined in Appendix A. Standard errors are adjusted for 17 clusters related to industry effects. Coefficients are presented as odd ratios. Z statistics are in parentheses. *significant at 10%; ** significant at 5%; ***significant at 1%. Total amount of observation in the panel is 6969.
Pooled logit
Pooled logit
Pooled logit
Pooled logit
Pooled logit
Pooled logit
Pooled logit
Pooled logit
(1) (2) (3) (4) (5) (6) (7) (8)
Q 1.0870*** 1.0823*** 1.0614*** 1.0403* 1.0198*
(3.37) (3.31) (3.5) (1.75) (1.8)
Cash Flow 0.4490 0.4595 0.3951 0.6881 0.7167
(0.97) (1.01) (0.89) (0.79) (0.5)
Size 1.3215*** 1.3703*** 1.3617*** 1.4643*** 1.2969*** 1.3779***
(7.2) (11.3) (11.9) (19.2) (9.62) (13.7)
Chairman 0.8040*** 0.7441*** 0.7593*** 0.8902 0.9106*
(2.39) (3.4) (3.71) (1.58) (1.9)
Tenure 1.0698*** 1.0537*** 1.0536*** 0.9941 0.9936
(7.02) (4.95) (6.21) (0.5) (0.74)
OC 1.4637*** 1.4224*** 1.4696*** 1.4615*** 1.4466*** 1.3946*** 1.3233*** 1.2683***
(5.91) (5.64) (5.9) (6.05) (6.52) (7.4) (5.83) (6.13)
Industry Effects no no no no no yes no yes
Years Effects no no no no no no yes yes
Industry Cluster yes yes yes yes yes yes yes yes
Firm Cluster no no no no no no no no
30 Panel E – logit models with two dimension clusters (Firm and Years)
The dependent variable “Acquisition” is binary and assumes the value 1 when a CEO announces at least 1 acquisition that was successfully completed during the year. Independent variables Tobin’s Q, Cash Flows, Size, Chairman, Tenure and OC are defined in Appendix A. Standard errors are adjusted for two dimensions of clusters: (i) 485 clusters for individual firm’s effect and (ii) 17 clusters for years effects. Coefficients are presented as odd ratios. Z statistics are in parentheses. *significant at 10%; ** significant at 5%; ***significant at 1%. Total amount of observation in the panel is 6969.
Pooled logit
Pooled logit
Pooled logit
Pooled logit
Pooled logit
Pooled logit
Pooled logit
Pooled logit
(1) (2) (3) (4) (5) (6) (7) (8)
Q 1.0870* 1.0823* 1.0614 1.0403 1.0198
(1.76) (1.78) (1.52) (1.23) (0.93)
Cash Flow 0.4490 0.4595 0.3951 0.6881 0.7167
(1.07) (1.09) (1.03) (0.76) (0.56)
Size 1.4696*** 1.3703*** 1.3617*** 1.4643*** 1.2969*** 1.3779***
(4.43) (10.4) (10.2) (11.1) (7.79) (7.55)
Chairman 0.8040*** 0.7441*** 0.7593*** 0.8902 0.9106
(2.37) (3.24) (3.09) (1.36) (1.14)
Tenure 1.0698*** 1.0537*** 1.0536*** 0.9941 0.9936
(2.44) (2.14) (2.11) (0.44) (0.52)
OC 1.4637*** 1.4224*** 0.0755*** 1.4615*** 1.4466*** 1.3946*** 1.3233*** 1.2683***
(4.22) (4.11) (7.68) (4.34) (4.33) (3.77) (3.18) (2.65)
Industry Effects no no no no no yes no yes
Years Effects no no no no no no yes yes
Industry Cluster no no no no no no no no
Firm Cluster yes yes yes yes yes yes yes yes
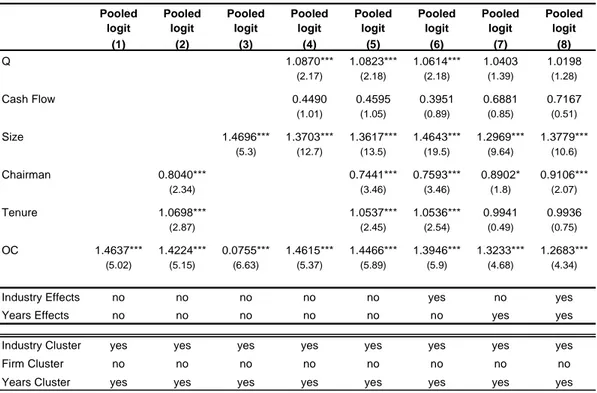
Panel F – logit models with two dimension clusters (Industry and Years)
The dependent variable “Acquisition” is binary and assumes the value 1 when a CEO announces at least 1 acquisition that was successfully completed during the year. Independent variables Tobin’s Q, Cash Flows, Size, Chairman, Tenure and OC are defined in Appendix A. Standard errors are adjusted for two dimensions of clusters: (i) 17 clusters for industry effect and (ii) 17 clusters for years effects. Coefficients are presented as odd ratios. Z statistics are in parentheses. *significant at 10%; ** significant at 5%; ***significant at 1%. Total amount of observation in the panel is 6969.
Pooled logit
Pooled logit
Pooled logit
Pooled logit
Pooled logit
Pooled logit
Pooled logit
Pooled logit
(1) (2) (3) (4) (5) (6) (7) (8)
Q 1.0870*** 1.0823*** 1.0614*** 1.0403 1.0198
(2.17) (2.18) (2.18) (1.39) (1.28)
Cash Flow 0.4490 0.4595 0.3951 0.6881 0.7167
(1.01) (1.05) (0.89) (0.85) (0.51)
Size 1.4696*** 1.3703*** 1.3617*** 1.4643*** 1.2969*** 1.3779***
(5.3) (12.7) (13.5) (19.5) (9.64) (10.6)
Chairman 0.8040*** 0.7441*** 0.7593*** 0.8902* 0.9106***
(2.34) (3.46) (3.46) (1.8) (2.07)
Tenure 1.0698*** 1.0537*** 1.0536*** 0.9941 0.9936
(2.87) (2.45) (2.54) (0.49) (0.75)
OC 1.4637*** 1.4224*** 0.0755*** 1.4615*** 1.4466*** 1.3946*** 1.3233*** 1.2683***
(5.02) (5.15) (6.63) (5.37) (5.89) (5.9) (4.68) (4.34)
Industry Effects no no no no no yes no yes
Years Effects no no no no no no yes yes
Industry Cluster yes yes yes yes yes yes yes yes
Firm Cluster no no no no no no no no