VIVIANNE MOLICA DE ANDRADE
SISTEMAS AQUOSOS BIFÁSICOS: DETERMINAÇÃO DE EQUILÍBRIO DE FASE E APLICAÇÃO PARA PARTIÇÃO DE ALFA-LACTOALBUMINA E
BETA-LACTOGLOBULINA
VIÇOSA
MINAS GERAIS – BRASIL 2011
VIVIANNE MOLICA DE ANDRADE
SISTEMAS AQUOSOS BIFÁSICOS: DETERMINAÇÃO DE EQUILÍBRIO DE FASE E APLICAÇÃO PARA PARTIÇÃO DE ΑLFA-LACTOALBUMINA E
BETA-LACTOGLOBULINA
APROVADA: 02 de Fevereiro de 2011.
Prof. Luis Henrique Mendes da Silva (Coorientador)
Prof. Alvaro Vianna Novaes de Carvalho Teixeira
Profa. Ana Clarissa dos Santos Pires Prof. Alexandre Gurgel
Profa Maria do Carmo Hespanhol da Silva (Orientadora)
Dissertação apresentada à
ii
iii
AGRADECIMENTOS
À Deus, sempre presente em minha vida, guiando todos os meus caminhos.
Aos meus pais, Celinho e Nazaré, pelo amor, paciência, compreensão, orações, incentivo e apoio em minhas escolhas.
Aos meus irmãos, Vivian e Vinícius, pela torcida, orações e por saber que sempre posso contar com vocês.
Ao Michel, pelas conversas e desabafos.
Ao Guilherme pelo amor, companheirismo, amizade, paciência e incentivo sempre. À toda minha família (avós, tios, tias, primos e primas) que sempre torcem por mim. Ao Geraldo, Rozelene e Rafael, pela acolhida na família.
Ao Conselho Nacional de Desenvolvimento Científico e Tecnológico, CNPq, à Fundação de Amparo à Pesquisa do Estado de Minas Gerais, FAPEMIG e ao Instituto Nacional de Ciências e Tecnologias Analíticas Avançadas, INCTAA, pelo apoio financeiro.
À Universidade Federal de Viçosa e ao Departamento de Química, pela oportunidade de realização deste trabalho.
Aos professores Carminha e Luis, pela confiança, orientação, ensinamentos e amizade. Aos professores Alvaro, Gurgel e Ana Clarissa, por aceitarem participar da banca desta defesa.
Aos amigos do grupo QUIVECOM, pela amizade e convívio e em especial ao Gabriel, que me ajudou na realização dos experimentos e discussão dos resultados.
Aos amigos do Departamento de Química, pela amizade e boa convivência no trabalho.
iv BIOGRAFIA
Vivianne Molica de Andrade, filha de Cirilo Antônio de Andrade e Maria Nazaré Molica de Andrade, nasceu em 24 de dezembro de 1983, na cidade de Viçosa, Minas Gerais.
Em março de 2004 ingressou no curso de Bioquímica da Universidade Federal de Viçosa, diplomando-se com o título de Bacharelado em julho de 2008.
Atualmente integra o quadro de servidores da UFV como Assistente de Laboratório do Departamento de Química. É estudante de mestrado e desenvolve pesquisa no grupo de Química Verde Coloidal e Macromolecular (QUIVECOM), sob orientação da Profa. Maria do Carmo Hespanhol da Silva do Departamento de Química da UFV. Além disso, é bolsista de Apoio Técnico - Nível Superior do CNPq, no período de setembro de 2010 a agosto de 2012, desenvolvendo atividades sob orientação do Prof. Luis Henrique Mendes da Silva no grupo QUIVECOM do Departamento de Química da UFV.
v
SUMÁRIO
LISTA DE SÍMBOLOS E ABREVIATURAS... vii
LISTA DE FIGURAS... x
LISTA DE TABELAS... xii
RESUMO... xiv
ABSTRACT... xvi
Capítulo 1: Revisão de Literatura... 1
1. Introdução... 1
1.1. Soro do leite... 1
1.2. Proteínas do soro do leite... 3
1.3. Sistemas Aquosos Bifásicos... 5
2. Referências Bibliográficas... 12
Capítulo 2: Aqueous two–phase systems of copolymer L64 + organic salt + water: Liquid-liquid equilibrium and enthalpic L64–salt interaction………….………... 18
Abstract.………....………..…………. 18
1. Introduction…...………....…..……… 19
2. Experimental Section... 20
2.1. Materials... 20
2.2. ATPS preparation... 21
2.3. Determination of Equilibrium Compositions... 21
2.4. Microcalorimetric measurements... 22
3. Results and Discussion... 23
3.1. Liquid–liquid equilibrium compositions... 23
3.2. Microcalorimetric studies of ATPS formation………..…... 30
4. Conclusions... 35
Literature Cited... 37
vi
Abstract……….………..……… 42
1. Introduction………...…….. 43
2. Experimental………...……. 44
2.1. Materials..………... 44
2.2. Preparation of the aqueous two-phase system………... 45
2.3. Determination of partition coefficient of proteins……… 45
2.4. Determination of the enthalpy of transfer……… 46
3. Results and Discussion……… 47
3.1. Influence of the tie-line length (TLL) on partition behavior of α-la and β-lg…...……….………... 47
3.2. Thermodynamical transfer parameters.………...………... 52
3.3. Effect of the electrolyte nature on the partition of proteins α-la and β-lg………. 55
4. Conclusions………...……….. 57
vii
LISTA DE SÍMBOLOS E ABREVIATURAS
B i
- Fração volumétrica do componente i na fase inferior T
i
- Fração volumétrica do componente i na fase superior B
j
- Fração volumétrica do componente j na fase inferior T
j
- Fração volumétrica do componente j na fase superior
iP
w - Par potencial de energia entre o componente i e o soluto particionado ij
w - Par potencial de energia entre os componentes i e j % (w/w) ou % (m/m) – Porcentagem massa/massa
- Número de sítios reticulares por unidade de volume (densidade numérica total)
Hap–int– Variação da entalpia de interação aparente
ou – Composição de polímero na fase inferior ou – Composição de polímero na fase superior ou – Composição de sal na fase inferior
– Composição de sal na fase superior [P]B– Concentração de proteína na fase inferior
[P]T– Concentração de proteína na fase superior
BSA – Albumina do soro bovino CFI – composição da fase inferior CFS – composição da fase superior CGL – Composição global
CLA ou TLL – Comprimento da linha de amarração EO – Óxido de etileno
FI ou BP – Fase inferior
FPLC – Cromatografia líquida rápida para proteínas FS ou TP – Fase superior
GMP – Glico-macropeptídeos
HPLC-RP– Cromatografia líquida de alta performance em fase reversa HPMC – Hidroxipropilmetilcelulose
viii
Kα– Coeficiente de partição da proteína α-lactoalbumina Kβ– Coeficiente de partição da proteína β-lactoglobulina L64 – Copolímero L64
LA ou TL – Linha de amarração LB – Linha binodal
LLE – Equilíbrio líquido-líquido MD – Maltodextrina
MP– Massa molar do soluto particionado
Mw– massa molar média
nB - Número total de moléculas na fase inferior nT– Número total de moléculas na fase superior Pc – Ponto crítico
PEO – Poli(óxido de etileno) pI – Ponto isoelétrico
PO – Óxido de propileno
R – Constante universal dos gases
SABs ou ATPS– Sistemas aquosos bifásicos STL – Inclinação da linha de amarração T – Temperatura absoluta
VB– Volume da fase inferior VT– Volume da fase superior
wL64– Porcentagem massa/massa de polímero L64
WPC – Concentrado de proteína do soro ws– Porcentagem massa/massa de sal
ww– Porcentagem massa/massa de água
Z - Número de vizinhos α-la –α-lactoalbumina β-lg –β-lactoglobulina
Δprot-dil Htop– Variação da entalpia de diluição da solução de proteína na fase superior
Δprot-dilHbottom– Variação da entalpia de diluição da solução de proteína na fase inferior
ΔPEO-PH° - Variação da entalpia de interação entre moléculas de polímero e proteína
ΔPEO-SH° - Variação da entalpia de interação entre moléculas de polímero e sal
ix
ΔP-WH° - Variação da entalpia de interação entre moléculas de proteína e água
ΔS-PH° - Variação da entalpia de interação entre moléculas de sal e proteína
ΔS-WH° - Variação da entalpia de interação entre moléculas de sal e água
ΔtrG° - Variação da energia livre de Gibbs de transferência
ΔtrH° - Variação da entalpia de transferência
ΔtrS° - Variação da entropia de transferência
ε ii – Energia necessária para romper as interações entre duas moléculas semelhantes do
tipo i
ε ij- Energia envolvida na formação da interação entre as moléculas i e j
ε jj – Energia necessária para romper as interações entre duas moléculas semelhantes do
x
LISTA DE FIGURAS
Capítulo 1: Revisão de Literatura
Figura 1 Diagramas de fase expressos em coordenadas triangulares e retangulares... 7
Figura 2 Diagrama de fase expresso em coordenadas retangulares de um SAB constituído por polímero e sal... 8
Capítulo 2: Aqueous two–phase systems of copolymer L64 + organic salt + water: Liquid-liquid equilibrium and enthalpic L64–salt interaction
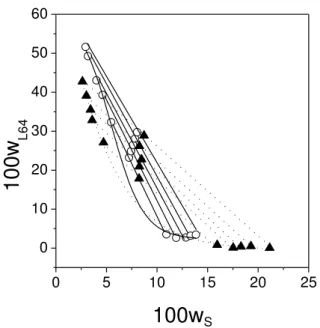
Figure 1 Temperature effect on the phase diagram for the L64 + Sodium Succinate system: ▲, 278.15 K; ○, 298.15 K... 28
Figure 2 Temperature effect on the phase diagram for the L64 + Sodium Tartrate system: ▲, 278.15 K; ○, 298.15 K………... 28
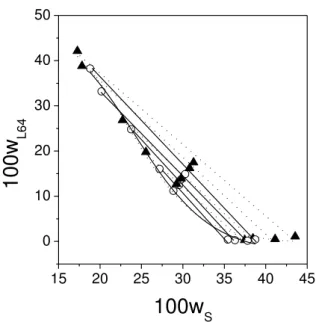
Figure 3 Temperature effect on the phase diagram for the L64 + Sodium Citrate system: ▲, 278.15 K; ○, 298.15 K………. 29
Figure 4 Temperature effect on the phase diagram for the L64 + Ammonium Citrate system: ▲, 278.15 K; ○, 298.15 K………. 29
Figure 5 Apparent enthalpic interaction between L64 and different organic salts... 32
xi
Capítulo 3: Partitioning behavior of α-lactoalbumin and β-lactoglobulin in PEO – organics salts – H2O ATPS: an termodynamic approach
Fig. 1 Partition behavior of the proteins (●) α-la and (○) β-lg in ATPS formed by PEO 1500 + sodium citrate + H2O, in pH 4.0, at 298.15
K……...……….. 48
Fig. 2 Partition behavior of the proteins (●) α-la and (○) β-lg in ATPS formed by PEO 1500 + (a) sodium succinate and (b) sodium tartrate + H2O, in pH 4.0, at 298.15 K……… 49
Fig. 3 Influence of the TLL on ΔtrG° for (a) α-la and (b) β-lg in ATPS
formed by PEO 1500 + (●) sodium citrate, (□) sodium succinate or (▲) sodium tartrate + H2O, in pH 4.0, at 298.15 K………... 53
Fig. 4 Effect of the electrolyte nature on the partition of protein (a) α-la and (b) β-lg in ATPS formed by PEO 1500 + (●) sodium citrate, (□) sodium succinate and (▲) sodium tartrate + H2O, in pH 4.0, at 298.15
xii
LISTA DE TABELAS
Capítulo 1: Revisão de Literatura
Tabela 1 SABs nos quais alguns biomateriais já foram particionados... 6
Tabela 2 Partição das proteínas α-la e β-lg em diferentes SABs... 9
Capítulo 2: Aqueous two–phase systems of copolymer L64 + organic salt + water:
Liquid-liquid equilibrium and enthalpic L64–salt interaction
Table 1 Equilibrium Data for L64 (wL64) + Sodium Succinate (wS) + Water
(wW) System from (278.15 to 298.15) K………. 24
Table 2 Equilibrium Data for L64 (wL64) + Sodium Tartrate (wS) + Water
(wW) System from (278.15 to 298.15) K………. 25
Table 3 Equilibrium Data for L64 (wL64) + Sodium Citrate (wS) + Water
(wW) System from (278.15 to 298.15) K………. 26
Table 4 Equilibrium Data for L64 (wL64) + Ammonium Citrate (wS) + Water
(wW) System from (278.15 to 298.15) K………. 27
Table 5 STL Values for L64 + salt + Water Systems………..…………. 33
Table 6 Water content in mass percentage in top and bottom phases in function of temperature and tie–line length………. 34
xiii
Table 1 Difference between H2O concentration in the top and bottom phases
of ATPS, at 298.15 K……….. 50
Table 2 Thermodynamic parameters obtained for α-lactalbumin and β -lactoglobulin in ATPS formed by PEO1500 + Na3C6H5O7 + H2O,
PEO1500 + Na2C4H4O4 + H2O and PEO1500 + Na2C4H4O6 + H2O,
xiv RESUMO
ANDRADE, Vivianne Molica de, M.Sc., Universidade Federal de Viçosa, Fevereiro de 2011. Sistemas aquosos bifásicos: determinação de equilíbrio de fase e aplicação para partição de alfa-lactoalbumina e beta-lactoglobulina. Orientadora: Maria do Carmo Hespanhol da Silva. Coorientadores: Luis Henrique Mendes da Silva e Jane Sélia dos Reis Coimbra.
Este trabalho apresenta, no primeiro capítulo, uma breve revisão sobre obtenção do
soro do leite e sua composição, destacando as propriedades nutricionais e tecnológicas das
proteínas do soro. Posteriormente, aborda os principais métodos de separação das proteínas do
soro, apresentando a utilização de sistemas aquosos bifásicos (SABs) como uma técnica
eficiente e economicamente viável de extração líquido-líquido para separação das proteínasα -lactoalbumina (α-la) e β-lactoglobulina (β-lg). O segundo capítulo descreve a obtenção e a determinação do equilíbrio de fase de novos SABs constituídos pelo copolímero L64 + sais orgânicos (citrato de amônio, citrato de sódio, succinato de sódio ou tartarato de sódio) + H2O
em diferentes temperaturas (5, 15 e 25 °C). Medidas microcalorimétricas mostraram que o processo de separação de fases nestes sistemas foi exotérmico e o sal citrato de sódio (Na3C6H5O7) foi mais efetivo em promover a separação de fases que o sal citrato de amônio
((NH4)3C6H5O7). A capacidade dos diferentes ânions em induzir a formação de SABs com
L64 obedeceu à seguinte ordem: citrato (C6H5O73–) > tartarato (C4H4O62–) > succinato
(C4H4O42–). Por fim, o terceiro capítulo aborda uma aplicação dos SABs constituídos pelo
polímero PEO 1500 + sais orgânicos (citrato de sódio, succinato de sódio ou tartarato de sódio) + H2O para a partição das proteínas α-la e β-lg. Além disso, os parâmetros
termodinâmicos (ΔtrH°, ΔtrS° e ΔtrG°) associados à transferência das proteínas da fase inferior
(FI) para a fase superior (FS) dos sistemas foram determinados. Os resultados obtidos mostraram que a partição da FI para FS é termodinamicamente favorável para α-la (- 6,61 <
xv
disso, este processo ocorre com perda de entropia configuracional (- 9,23 < TΔtrS° < - 1,34 kJ
mol-1) e as interações intermoleculares entre moléculas de proteína e polietilenoglicol são mais favoráveis que as interações intermoleculares entre moléculas de proteína e sal (- 7,95 < ΔtrH° < - 1,42 kJ mol-1), para ambas as proteínas em todos os SABs estudados. Para explicar o
comportamento de partição das proteínas, o modelo derivado da teoria de Flory-Huggins foi
utilizado e observou-se que a partição da α-la para a FS foi entalpicamente dirigida, enquanto
xvi ABSTRACT
ANDRADE, Vivianne Molica de, M.Sc., Universidade Federal de Viçosa, February, 2011. Aqueous two-phase systems: determination of phase equilibrium and application for partition of alpha-lactoalbumin and beta-lactoglobulin. Adviser: Maria do Carmo Hespanhol da Silva. Co-Advisers: Luis Henrique Mendes da Silva and Jane Sélia dos Reis Coimbra.
This work presents, in its first chapter, a brief review on production and compositions of cheese whey, emphasizing the nutritional and technological properties of whey proteins. Subsequently, the main methods of separation of whey proteins are addressed, using aqueous two-phase systems (ATPS) as an efficient and economically viable liquid-liquid extraction technique for separation of alpha-lactalbumin (α-la) and beta-lactoglobulin (β-lg) proteins. The second chapter describes the formation and determination of the phase equilibrium of new ATPS formed by copolymer L64 + organics salts (ammonium citrate, sodium citrate, sodium succinate or sodium tartrate) + H2O at different temperatures (278.15, 288.15 and
298.15 K). Microcalorimetric measurements showed that the phase separation process in these systems was exothermic and the salt sodium citrate (Na3C6H5O7) was more effective in
promoting phase separation than ammonium citrate ((NH4)3C6H5O7). The capacity of the
different anions in inducing ATPS formation with L64 followed the order: citrate (C6H5O73–)
> tartrate (C4H4O62–) > succinate (C4H4O42–). Finally, the third chapter describes an
application of ATPS formed by polymer PEO 1500 + organics salts (sodium citrate, sodium succinate or sodium tartrate) + H2O for partition of α-la and β-lg proteins. In addition the
thermodynamical parameters (ΔtrH°, ΔtrS° e ΔtrG°) associated with protein transfer from the
bottom phase (BP) to the top phase (TP) were determined. The results showed that the partition from BP to TP is thermodynamically favorable to α-la (- 6.61 < ΔtrG° < - 0.77 kJ
mol-1), but is unfavorable for β-lg (2.68 < ΔtrG° < 6.20 kJ mol-1). Additionally, this process
xvii
intermolecular interactions between proteins and poly(ethylene glycol) molecules are more favorable than intermolecular interactions between proteins and salt molecules (-7.95 < ΔtrH°
1
Capítulo 1 Revisão de Literatura
1. Introdução
1.1. Soro do leite
O soro do leite é um co-produto resultante da fabricação de queijos, de cor amarelo-esverdeada, obtido pela coagulação do leite. O seu sabor, ligeiramente ácido ou doce, e a sua composição dependem do tipo e do processo de fabricação do queijo, respectivamente. Pode ser obtido em laboratório ou na indústria por três processos principais: a) pelo processo de coagulação enzimática (enzima quimosina), resultando no coágulo de caseínas, matéria-prima para a produção de queijos e no soro “doce”; b) por precipitação ácida no pH isoelétrico (pI),
resultando na caseína isoelétrica, que é transformada em caseinatos e no soro ácido; c) por separação física das micelas de caseína por microfiltração, obtendo-se um concentrado de micelas e as proteínas do soro, na forma de concentrado ou isolado proteico [1,2].
A composição do soro é de aproximadamente 93 % de água, 5 % de lactose, 0,9 % de proteínas, 0,3 % de gordura, 0,2 % de ácido láctico e pequenas quantidades de vitaminas [3]. A presença de proteínas com elevado teor de aminoácidos essenciais faz com que o soro do leite tenha alto valor nutricional.
2
fisiológicas, capazes de produzir um importante controle na modulação do metabolismo e nos mecanismos de defesa dos organismos animal e humano [4-6].
O soro do leite, por ser pouco aproveitado pelas indústrias, ao ser descartado no ambiente (solo e mananciais de rios) sem tratamento prévio, gera um grave problema de poluição ambiental, principalmente devido ao seu alto teor de matéria orgânica.
No Brasil, a produção de bebidas lácteas é uma das principais opções de aproveitamento do soro do leite, e as mais comercializadas são as bebidas fermentadas, com características sensoriais semelhantes ao iogurte, e bebidas lácteas não-fermentadas. Contudo, o aproveitamento desse co-produto atinge apenas 15% do total de soro produzido, com a produção nacional estimada em 470 milhares de toneladas [7,8].
Devido à vasta aplicabilidade das proteínas do soro do leite, torna-se importante o desenvolvimento de processos de separação e purificação, em larga escala, destas proteínas, e que também sejam viáveis economicamente. Logo, a busca por processos eficientes e econômicos para o processamento de biomoléculas é uma necessidade. As técnicas empregadas em biosseparações devem assegurar que a atividade biológica das moléculas não seja afetada, elevada pureza e altos rendimentos [9]. Neste contexto, é importante o desenvolvimento de novos métodos analíticos para extração e separação das proteínas do soro do leite, agregando valor a este resíduo agroindustrial.
Os principais métodos de separação de proteínas do soro empregam a precipitação seletiva (por adição de sais ou solventes orgânicos) ou cromatografia. A adição de sulfato de amônio ou sulfato de magnésio em solução resultava na precipitação da beta-lactoglobulina (-lg), restando no sobrenadante a alfa-lactoalbumina (-la) [10]. Posteriormente
descobriu-se que a adição de ácido tricloro-acético [11] promovia a precipitação de todas as proteínas
exceto a -lg, que podia, assim, ser extraída juntamente com a fase líquida em equilíbrio com
3
adição do ácido tricloro-acético quando se adicionava cloreto de sódio em pH igual a 3. Além destas técnicas precipitantes, métodos cromatográficos são eficientes na obtenção de proteínas relativamente puras. Blanc [13] e Yoshida [14] utilizaram cromatografia por exclusão
molecular para obter amostras de -la e -lg enriquecidas em mais de 90 %, enquanto que a
aplicação de cromatografia de troca iônica possibilitava rendimentos ainda maiores [15]. Ye et al. [16] propuseram um método rápido para isolar as proteínas α-la, β-lg A e β-lg B do soro, sem nenhum tratamento prévio, utilizando cromatografia de troca iônica.
Entretanto, estes métodos possuem desvantagens, pois apresentam alto custo dos equipamentos, no caso da cromatografia e/ou não preservam a forma nativa das proteínas o que ocasiona desnaturação e perda de atividade funcional. Uma alternativa interessante para este contexto é a utilização de sistemas aquosos bifásicos (SABs) como técnica líquido-líquido de separação das proteínas do soro.
1.2. Proteínas do soro do leite
As proteínas do soro do leite apresentam estruturas globulares contendo algumas pontes de dissulfeto, que conferem estabilidade estrutural às macromoléculas. As frações, ou peptídeos do soro, são constituídas de: β-lg, α-la, albumina do soro bovino (BSA), imunoglobulinas (Ig’s) e glico-macropeptídeos (GMP). Essas frações podem variar em
4
Dentre as proteínas contidas no soro, as que aparecem em maior concentração são a β -lg e a α-la, correspondendo a cerca de 50 % e 20 %, respectivamente, das proteínas do soro. Os 30 % restantes correspondem a outras proteínas como: soroalbumina, lactoferrina, lisozima e imunoglobulinas.
A proteína β-lg possui estrutura tridimensional globular, apresenta em sua estrutura
primária 162 resíduos de aminoácidos, massa molecular de aproximadamente 18,3 kDa, ponto isoelétrico igual a 5,2 e é termosensível. A β-lg é a proteína mais abundante no soro de leite bovino e praticamente não ocorre no leite humano, sendo considerada alergênica e antigênica, uma vez que pode causar alergia em segmentos mais sensíveis da população, principalmente crianças [22,23]. A estrutura particular da β-lg, do tipo lipocalina, forma uma espécie de cálice de caráter hidrofóbico que lhe confere propriedades funcionais de grande aplicação na indústria de alimentos, como capacidade de emulsificação, formação de espuma, geleificação e interação com moléculas responsáveis pelo aroma e sabor do produto [24]. Esta estrutura em forma de cálice contribui para que ela seja uma proteína bastante estável em solução em uma ampla faixa de pH [25].
A proteína α-la possui estrutura tridimensional em forma de um elipsóide, cuja
5 1.3. Sistemas Aquosos Bifásicos
Os sistemas aquosos bifásicos (SABs) são misturas ternárias compostas majoritariamente por água que, sob certas condições de composição, temperatura e pressão, apresentam duas fases em equilíbrio termodinâmico. Eles podem ser formados pela mistura de soluções de dois polímeros quimicamente distintos [27,28], pela mistura de soluções de um polímero e um eletrólito [29,30] ou ainda pela mistura de soluções de dois eletrólitos [31]. Os SABs são caracterizados por possuírem duas fases distintas: uma rica em polímero (ou sal), denominada fase superior (FS), e outra rica em sal (ou em outro polímero), denominada fase inferior (FI).
Os primeiros relatos de estudos envolvendo esse tipo de sistema datam do ano de 1896, quando Beijerinck [32,33] descobriu que, ao se misturar soluções aquosas de gelatina e ágar (ou gelatina e amido solúvel), sob dada faixa de temperatura e concentração, formavam-se misturas turvas as quais, quando deixadas em repouso, formavam-separavam-formavam-se em duas faformavam-ses límpidas, uma delas (a mais densa) enriquecida em ágar (ou amido) e a outra enriquecida em gelatina, sendo a água o componente majoritário em ambas as fases.
Estudos posteriores realizados por Ostwald e Hertel [34,35] verificaram que amidos provenientes de origens diferentes levavam à formação de SABs com características diferentes, tais como as proporções relativas de seus constituintes.
6
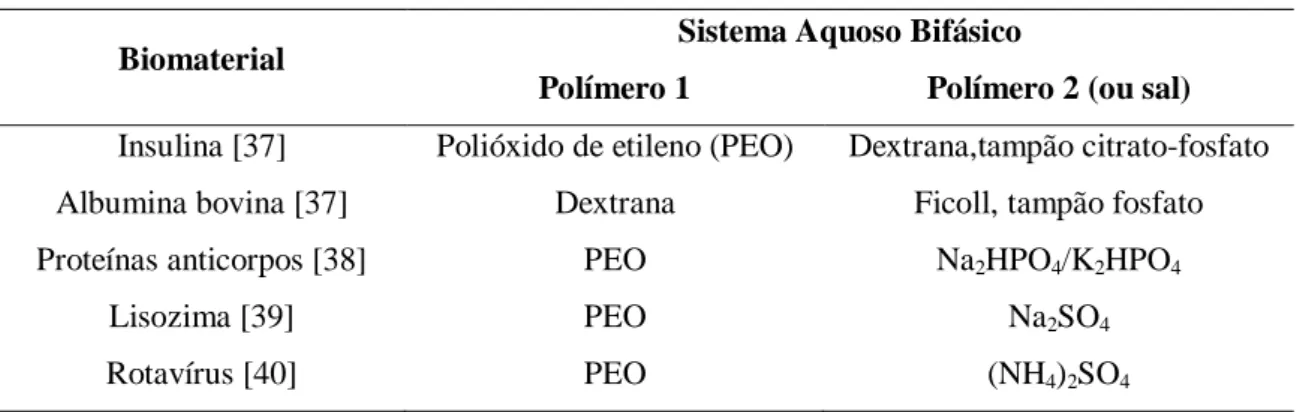
Tabela 1. SABs nos quais alguns biomateriais já foram particionados.
Biomaterial Sistema Aquoso Bifásico
Polímero 1 Polímero 2 (ou sal)
Insulina [37] Polióxido de etileno (PEO) Dextrana,tampão citrato-fosfato
Albumina bovina [37] Dextrana Ficoll, tampão fosfato
Proteínas anticorpos [38] PEO Na2HPO4/K2HPO4
Lisozima [39] PEO Na2SO4
Rotavírus [40] PEO (NH4)2SO4
As vantagens oferecidas pelos SABs residem no fato de eles serem considerados economicamente viáveis e ambientalmente seguros, pois são formados por reagentes de baixo custo e não-tóxicos (polímero, sal e água). Por serem constituídos majoritariamente por água, as propriedades termodinâmicas das fases são semelhantes ao meio aquoso dos seres vivos, o que torna tais sistemas estratégicos na extração de biopartículas, uma vez que evitam a desnaturação, sem perda da atividade biológica [41,42]. Esses sistemas também possuem baixa tensão interfacial, o que viabiliza a transferência de solutos pela interface [43], e por fim podem ser aplicados em larga escala [44].
7
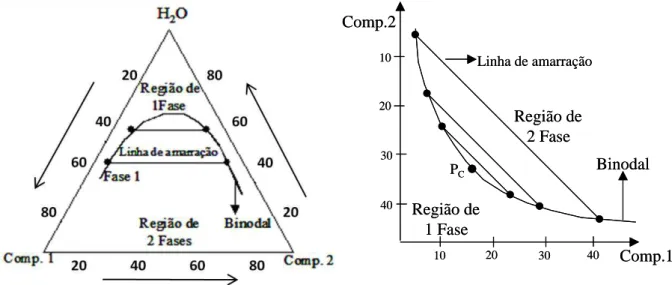
Figura 1. Diagramas de fase expressos em coordenadas triangulares e retangulares.
A Figura 2 representa um diagrama retangular onde o eixo das abscissas representa a concentração de sal do sistema e o eixo das ordenadas corresponde à concentração do polímero. Estas concentrações geralmente são expressas em porcentagem mássica, % (m/m). Neste diagrama encontram-se informações fundamentais para o entendimento e aplicação dos SABs, tais como as composições globais (CGL) nas quais sistemas com uma ou duas fases serão obtidos, a composição da fase superior (CFS) e composição da fase inferior (CFI). A linha binodal (LB) delimita a região homogênea da região bifásica. Esta linha corresponde às composições mínimas dos componentes necessárias para a separação de fases. As composições localizadas acima da LB formam sistemas de duas fases e abaixo desta linha formam sistemas homogêneos. A posição da linha binodal no diagrama pode ser influenciada por fatores como temperatura, natureza do eletrólito, pH do meio, massa molar e hidrofobicidade do polímero. Existem diferentes métodos para a obtenção da LB, entretanto o mais utilizado envolve titulação turbidimétrica e análise das composições das fases [45].
Este diagrama é composto também por linhas de amarração (LA), que são retas que unem as composições de pontos de mistura (ou CGL) com as composições das respectivas fases no equilíbrio termodinâmico. À medida que se caminha para uma LA maior, as
Comp.2
Comp.1 Binodal
Linha de amarração
10 20 30 40
Região de 1 Fase Região de 2 Fase 10 20 30 40 PC Comp.2 Comp.1 Binodal
Linha de amarração
10 20 30 40
8
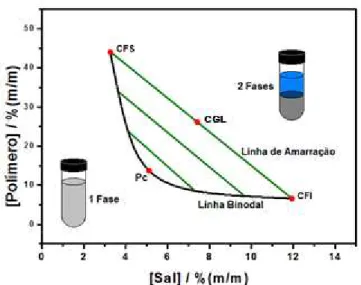
propriedades termodinâmicas intensivas (índice de refração, condutividade, densidade, composição, etc.) das fases (superior e inferior) vão se tornando cada vez mais distintas. Entretanto, sobre uma mesma LA, as composições das fases permanecem inalteradas, mas as propriedades termodinâmicas extensivas (volume, capacidade calorífica, massa, etc.) de cada uma das fases variam. A diminuição sucessiva nos comprimentos das linhas de amarração (CLA) leva de encontro ao ponto crítico (Pc). À medida que as composições das duas fases do sistema se aproximam deste ponto, a diferença entre as propriedades termodinâmicas dessas fases diminui até que, teoricamente, tornam-se iguais.
Figura 2. Diagrama de fase expresso em coordenadas retangulares de um SAB constituído por polímero e sal.
Logo, um importante parâmetro a ser analisado em estudos de partição utilizando SABs é o CLA, que é definido matematicamente pela equação 1.
(1)
onde, e são as concentrações de copolímero e e são as concentrações de sal em
9
mais distintas são as propriedades termodinâmicas intensivas entre as duas fases e maior será o coeficiente de partição (K) deste soluto.
A aplicação de SABs para o processamento do soro de queijo teve início em 1989 [46]. Neste trabalho ficou evidente que a partição das proteínas do soro, em geral, era fortemente influenciada pela massa molar do polímero, concentração dos componentes em cada fase, pH, temperatura, propriedades das proteínas (estrutura, hidrofobicidade, massa molar) e a adição de sais que não participavam do processo de separação de fase.
Vários autores estudaram o comportamento de partição das principais proteínas do soro do leite em diferentes SABs. A Tabela 2 sumariza alguns destes trabalhos. Na maioria deles, percebe-se uma tendência da proteína α-la em se concentrar na fase rica em polímero e uma transferência preferencial da proteína β-lg para a fase rica em sal nos sistemas avaliados.
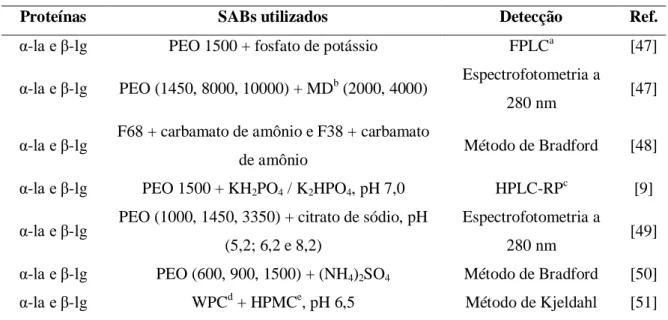
Tabela 2. Partição das proteínas α-la e β-lg em diferentes SABs.
Proteínas SABs utilizados Detecção Ref.
α-la e β-lg PEO 1500 + fosfato de potássio FPLCa [47]
α-la e β-lg PEO (1450, 8000, 10000) + MDb (2000, 4000) Espectrofotometria a
280 nm [47]
α-la e β-lg F68 + carbamato de amônio e F38 + carbamato
de amônio Método de Bradford [48] α-la e β-lg PEO 1500 + KH2PO4 / K2HPO4, pH 7,0 HPLC-RPc [9]
α-la e β-lg PEO (1000, 1450, 3350) + citrato de sódio, pH (5,2; 6,2 e 8,2)
Espectrofotometria a
280 nm [49] α-la e β-lg PEO (600, 900, 1500) + (NH4)2SO4 Método de Bradford [50] α-la e β-lg WPCd + HPMCe, pH 6,5 Método de Kjeldahl [51]
a
FPLC: Cromatografia líquida rápida para proteínas; bMD: Maltodextrina; cHPLC-RP: Cromatografia líquida de alta performance em fase reversa; dWPC: Concentrado de proteína do soro; eHPMC: Hidroxipropilmetilcelulose
10
de polímero e sal no sistema. O comportamento de partição das proteínas α-la e β-lg também
foi estudado em SAB PEO / maltodextrina (MD), sendo que os valores de K da β-lg foram menores do que 1 no SAB PEO 8000 / MD 2000, atingindo valores próximos a 1 quando se utilizou o SAB PEO 1450 / MD 4000. O mesmo comportamento foi observado para a α-la, ou seja, o coeficiente de partição da proteína aumentou à medida que a massa molar do PEO diminuiu e/ou a massa molar da MD aumentou.
Oliveira et al. [48] encontraram coeficientes de partição variando de 1,0 a 2,5 para a α -la e de 0,1 a 1,0 para proteína β-lg utilizando sistemas formados por carbamato de amônio e os copolímeros tribloco F38 e F68.
Giraldo-Zuñiga et al. [9] determinaram o coeficiente de partição das proteínas α-la e β-lg em SAB PEO / fosfato de potássio em pH igual a 7. A partição no SAB PEO 1500 18 %
(m/m) + fosfato de potássio 18 % (m/m) forneceu o maior valor de K para α-la (20,55) e o menor para β-lg (0,030).
Boaglio et al. [49] avaliaram o comportamento de partição das proteínas α-la, β-lg e soroalbumina bovina (BSA) em SABs formados por PEO / citrato de sódio em diferentes pHs. Observou-se que, com o aumento do CLA, os valores de coeficiente de partição para todas as proteínas decaíram, sendo a partição da α-la mais afetada, pois o valor de K diminuiu cerca de quatro vezes. O aumento da massa molar do polímero também diminuiu a partição das proteínas para a FS do SAB, o que pode ser explicado por uma diminuição do volume livre disponível na fase superior em consequência do aumento na concentração do polímero.
Rodrigues et al. [50] estudaram o comportamento de partição das proteínas α-la e β-lg em sistemas formados por PEO / (NH4)2SO4. Estes foram considerados uma alternativa
11
para β-lg, foram obtidos quando se utilizou o sistema PEO 900 18 % (m/m) + (NH4)2SO4 14
% (m/m) em pH 7.
12 2. Referências Bibliográficas
[1] Zinsly, P.F.; Sgarbieri, V. C.; Pereira, D. N. F. G.; Jacobucci, H. B.; Pacheco, M. T. B.; Baldini, V. L. S. Produção piloto de concentrados de proteínas de leite bovino: composição e valor nutritivo. Brazilian Journal of Food Technology 2001, 4, 1-8.
[2] Maubois, J-L.; Fauquant, J.; Famelart, M-H; Caussin, F. Milk microfiltrate, a convenient starting material for fractionation of whey proteins and derivatives. American Dairy Products Institute 2001, 59-72.
[3] Ben-Hassan, R. M., Ghaly, A. E. Continuous propagation of Kluyveromyces fragilis in cheese whey for pollution potential reduction. Appl. Biochem. Biotech. 1994, 47, 89-105.
[4] Sgarbieri, V. C.; Pacheco, M. T. B. Alimentos funcionais fisiológicos. Brazilian Journal of Food Technology 1999, 2, 7-19.
[5] Micke, P.; Beeh, K. M.; Buhl, R. Effects of long-term supplementation with whey proteins on plasma glutathione levels of HIV-infected patients. European Journal of Nutrition. 2002, 41, 12-18.
[6] Rosaneli, C F.; Bighetti, A. E.; Antônio, M. A.; Carvalho, J. E.; Sgarbieri, V. C. Efficacy of a whey protein concentrate on the inhibition of stomach ulcerative lesions caused by ethanol ingestion. J. Med. Food 2002, 5, 221-228.
[7] Neves, B. S. Aproveitamento de subprodutos da indústria de laticínios. In: Embrapa Gado de Leite. Sustentabilidade da pecuária de leite no Brasil: qualidade e segurança alimentar. Juiz de Fora, MG, 2001, 97-108.
[8] Nakamae, I. J. (Ed.). Anualpec 2004: anuário da pecuária brasileira. São Paulo: FNP, 2004, 191-232.
13
[10] Jennes, R.; Patton, S. Principles of dairy chemistry, John Wiley and Sons, New York, 1959.
[11] Fox, K. K.; Holsinger, V. H.; Posati, L. P.; Pallansch, M. J. Separation of β-lactoglobulin from other milk serum proteins by trichloroacetic acid. J. Dairy Sci. 1967, 50, 1363-1367.
[12] Mailliart, P.; Ribadeau-Duma, B. preparation of β-lactoglobulin and p-lactoglobulin – free proteins from whey retentate by NaCl salting out at low pH. J. Food Sci. 1988, 53, 743-745.
[13] Bican, P.; Blanc, B. Milk protein analysis - a high performance chromatographic study. Milchwissenschaft 1982, 37, 592.
[14] Yoshida, S. Isolation of β-lactoglobulin and α-lactalbumin by gel filtration using Sephacryl S-200 and purification by diethylaminoethyl ion-exchange chromatography. J. Dairy Sci. 1990, 73, 2292–2298.
[15] Manji, B.; Hill, A.; Kakuda, Y.; Irvine, D. M. Rapid separation of milk whey proteins by anion exchange chromatography. J. Dairy Sci. 1985, 68, 3176-3179.
[16] Ye, X., Yoshida, S., Ng, T. B. Isolation of lactoperoxidase, lactoferrin, α-lactalbumin, β -lactoglobulin B and β-lactoglobulin A from bovine rennet whey using ion exchange chromatography. Int. J. Biochem. Cell Biol. 2000, 32, 1143-1150.
[17] Kinsella, J.E.; Whitehead, D. M. Proteins in whey: chemical, physical and functional properties. Adv. Foods Nutr. Res. 1989, 33, 343-438.
[18] De Wit, J. N. Nutritional and Functional Characteristics of Whey Proteins in Food Products. J. Dairy Sci. 1998, 81(3), 597-608.
14
[20] Salzano, Jr. I. Nutritional supplements: practical applications in sports, human
performance and life extension. Symposium series 007, São Paulo, 1996-2002, 75-202.
[21] Lönnerdal, B. Nutritional and physiologic significance of human milk proteins. Am. J.
Clin. Nutr. 2003, 77, 1537s-1543s.
[22] Rouvinen, J.; Rautiainen, J.; Virtanen, T.; Zeiler, T.; Kaupinen, J.; Taivainen, A.; Mäntyjärvi, R. Probing the molecular basis of allergy: three-dimentional structure of the bovine lipocalin allergen Bos d 2. The J. Biol. Chem. 1999, 274, 2337-2343.
[23] Sélo, I.; Clément, G.; Bernard, H.; Chatel, J-M.; Créminon, C.; Peltre, G.; Wal, J-M. Allergy to bovine β-lactoglobulin: specificity of human IgE to tryptic peptides. Clin. Exp. Allergy. 1999, 9, 1055-1063.
[24] Morr, C. V.; Foegeding, E. A. Composition and functionality of commercial whey and milk protein concentrates and isolates: a status report. Food Technol. 1990, 44, 100-112.
[25] Taulier, N.; Chalikian, T. Characterization of pH-induced transitions of β-LG: ultrassonic, densitometric, and spectroscopy studies. J. Mol. Biol. 2001, 14, 873-889.
[26] Sgarbieri, V. C. Revisão: propriedades estruturais e físico químicas das proteínas do leite. Brazilian Journal of Food Technoogy 2005, 8, 43-56.
[27] Simonet, F.; Garnier C.; Doublier, J.-L. Partition of proteins in the aqueous guar / dextran two-phase system. Food Hydrocolloid. 2000, 14, 591-600.
[28] Madeira, P. P.; Teixeira, J. A., Macedo, E. A.; Mikheeva, L. M.; Zaslavsky, B. Y. “On the Collander equation”: Protein partitioning in polymer / polymer aqueous two-phase systems. J. Chromatogr. A 2008, 1190, 39-43.
15
[30] Tubío, G.; Nerli, B., Picó, G. PArtitioning features of bovine trypsin and α-chymotrypsin in polyethyleneglycol-sodium citrate aqueous two-phase systems. J. Chromatogr. B 2007, 852, 244-249.
[31] Bridges, N. J.; Gutowski, K. E.; Rogers, R. D. Investigation of aqueous biphasic systems formed from solutions of chaotropic salts with kosmotropic salts (salt–salt ABS). Green Chem. 2007, 9, 177-183.
[32] Beijerinck, M. W. Ueber eine eigentümlichkeit der iöslichen stärke. Zbl. Bakt. II Natur. 1896, 627, 697-699.
[33] Beijerinck, M. W. Ueber emulsionsbildung bei der vermischung wässeriger lösungen gewisser gelatinierender kolloide. Kolloid Z. Z. Polym. 1910, 7, 16-20.
[34] Ostwald, W.; Hertel, R. H. Kolloidchemische reaktionen zwischen solen von Eiweißkörpern und polymeren Kohlehydraten. I. Kolloid Z. Z. Polym. 1929, 47, 258-268.
[35] Ostwald, W.; Hertel, R. H. Kolloidchemische reaktionen zwischen solen von Eiweißkörpern und polymeren Kohlehydraten. II. Kolloid Z. Z. Polym. 1929, 47, 357-370.
[36] Tiselius, A.; Porath, J.; Albertsson, P. A. Separation and Fractionation of Macromolecules and Particles. Science, 1963, 141, 13-20.
[37] Zaslavsky, B. Y. Aqueous Two-Phase Partitioning, Physical Chemistry and Bio-analytical Applications. Marcel Dekker, New York, 1995.
[38] Platis, D.; Labrou, N. E. Development of an aqueous two-phase partitioning system for fractionating therapeutic proteins from tobacco extract. J. Chromatogr. A 2006, 1128, 114-124.
16
[40] Benavides, J.; Mena, J. A.; Cisneros-Ruiz, M.; Ramírez, O. T.; Palomares, L. A.; Rito-Palomares, M. Rotavirus-like particles primary recovery from insect cells in aqueous two-phase systems. J. Chromatogr. B, 2006, 842, 48-57.
[41] Haraguchi, L. H.; Mohamed, R. S.; Loh, W.; Pessoa Filho, P. A. Phase equilibrium and insulin partitioning in aqueous two-phase systems containing block copolymers and potassium phosphate. Fluid Phase Equilibr. 2004, 215, 1-15.
[42] Oliveira, M. C.; Abreu Filho, M. A. N.; Pessoa Filho, P. A. Phase equilibrium and protein partitioning in aqueous two-phase systems containing ammonium carbamate and block copolymers PEO–PPO–PEO. Biochem. Eng. J. 2007, 37, 311-318.
[43] Albertsson, P. A. Partition of Cells, Particles and Macromolecules, 3rd ed., Wiley Interscience, New York, 1986.
[44] Kula, M. R.; Kroner, K. H.; Husted, H.; Schütte, H. Technical aspects of extractive enzyme purification. Ann. N.Y. Acad. Sci. 1981, 369, 341-354.
[45] Zaslavsky, B. Y. Aqueous Two-Phase Partitioning, Physical Chemistry and Bio-analytical Applications. Marcel Dekker, New York, 1995.
[46] Chen, J.-P. Clarification of cheese whey by aqueous two-phase systems. J. Food Sci. 1989, 54, 1369-1370.
[47] Alves, J. G. L. F.; Chumpitaz, L. D. A., da Silva, L. H. M.; Franco, T. T.; Meirelles, A. J. A. Partitioning of whey proteins, bovine serum albumin and porcine insulin in aqueous two-phase systems. J. Chromatogr. B 2000, 743, 235-239.
17
[49] Boaglio, A.; Bassani, G.; Picó, G.; Nerli, B. Features of the milk whey protein partitioning in polyethyleneglycol-sodium citrate aqueous two-phase systems with the goal of isolating human alpha-1 antitrypsin expressed in bovine milk. J. Chromatogr. B 2006, 837, 18-23.
[50] Rodrigues, L.R.; Venâncio, A., Teixeira, J. A. Partitioning and separation of α -lactalbumin and β-lactoglobulin in polyethylene glycol / ammonium sulphate aqueous two-phase systems. Biotechonology Letters, 2001, 23, 1893-1897.
18 Capítulo 2
Aqueous two–phase systems of copolymer L64 + organic salt + water: Liquid-liquid equilibrium and enthalpic L64–salt interaction
Abstract
Phase diagrams of two–phase systems (ATPS) composed by the triblock copolymer L64 + organic salt (sodium tartrate, sodium succinate, sodium citrate, or ammonium citrate) + water, at different temperatures (278.15, 288.15, and 298.15 K) are presented in this work. Contrary to behavior of ATPS formed by inorganic salts, the study of the temperature influence in the liquid–liquid equilibrium behavior of L64–organic salts ATPS showed an exothermic character for phase separation process. Microcalorimetric measurements showed that this phase separation energy is around – 0.2 kJ mol-1 for all organic salts. The slope of tie line (STL) tends to increase with an increase in temperature. The cation nature effect showed that the salt Na3C6H5O7 was more effective in promoting phase separation than (NH4)3C6H5O7.
The capacity of the different anions tested for inducing ATPS formation with L64 followed the order: C6H5O73– > C4H4O62– > C4H4O42–. Because the salt–L64 interaction energy to be
very similar, the cation and anion effects on the phase separation could be attribute to a process driven by entropy.
19 1. Introduction
Separation processes involving macromolecular systems, such as cloud point extraction [1] and polymeric blends [2], are applied frequently in several areas of research and industry. This type of process also occurs through organic solvent/water systems [3–5] and water/water systems, generally called aqueous two–phase systems, or ATPS [6–9]. In the latter case, there are some strategic advantages, including the following: (i) it provides a suitable environment for the preservation of biological activity of some solutes [10]; (ii) low interfacial tensions improve the diffusion process through the interface [11]; and (iii) the possibility of linear scale–up exists [12].
Within this context, ATPS have proven to be an excellent technique in the preconcentration, purification and separation of different solutes, such as nanoparticles [13], proteins [14], cell organelles [15], membranes [16], DNA [17], dye molecules [18], and metallic ions [19]. Under specific thermodynamic conditions [20], ATPS is traditionally formed by the mixture of aqueous solutions of two mutually incompatible polymers [21], by a polymer and a salt [22], or by two salts [23]. This ternary system splits into two water– enriched phases: a polymer–enriched top phase (or enriched with a salt) and a salt–enriched bottom–phase (or enriched with another polymer).
Most ATPS phase diagrams and partitioning studies reported in the literature are relative to systems composed of poly(ethylene oxide) (PEO) [22,24], which are limited for the extraction of water–soluble compounds (hydrophilic solutes). ATPS formed by (EO)n–(PO)m–
(EO)n triblock copolymers are excellent options for PEO-ATPS due to the extent of the
20
assembly process, forming micelles. These aggregates have a hydrophilic crown of ethylene oxide units and a hydrophobic core formed by propylene oxide units [6], which are capable of interacting with hydrophobic compounds. For example, the triblock copolymer L64 ((EO)11(PO)16(EO)11, with average molecular weight (Mw) 2900 g·mol–1 and 40% ethylene
glycol) is known to form aggregates with different morphologies (e.g. vesicles and lamellae) depending on the thermodynamic conditions [25], which allows a wider application of the ATPS.
To the authors’ best knowledge, there exists only one work in the literature describing phase diagrams of ATPS composed by the triblock copolymer L64 and inorganic electrolytes [26]. The aim of the present work is to determine the phase diagrams of ATPS composed by L64 + organic salt + water. To investigate the effect of the cations and anions, the organic electrolytes used were sodium tartrate, sodium succinate, sodium citrate, and ammonium citrate. Equilibrium data at 278.15, 288.15, and 298.15 K were determined to study the influence of temperature on the phase composition. Microcalorimetric measurements were used to determine the enthalpy of the interaction between the different salts and the L64 macromolecules.
2. Experimental Section
2.1. Materials. Poly(ethylene glycol)–block–poly(propylene glycol)–block–poly(ethylene
glycol) copolymer with the basic backbone (EO)n(PO)m(EO)n was used. The L64,
(EO)13(PO)30(EO)13, with an average molar mass (Mw) of 2900 g· mol–1 and a mass fraction of
40 % EO was purchased from Aldrich. The analytical-grade reagents, Na2C4H4O6·2H2O
(sodium tartrate dihydrate), Na2C4H4O4·6H2O (sodium succinate hexahydrate),
21
obtained from Vetec (Brazil). Milli–Q II water (Millipore) was used throughout the experiments for the preparation of all aqueous solutions.
2.2. ATPS preparation. As presented elsewhere [26], we have established a general
methodology that is used in all equilibrium studies carried out by our group with appropriate adaptations. First, stocks aqueous solutions of L64 and salt were prepared by weighing appropriate amounts of reagents on an analytical balance (Shimadzu, AG 220). We prepared ATPS by mixing appropriate quantities of the aqueous solutions of copolymer and salt in glass vessels according to the global compositions desired. The mixture was manually stirred until the system became turbid. It was allowed to settle for 24 to 72 h at the operational temperature of 278.15, 288.15, or 298.15 K in a temperature–controlled bath (Microquímica, MQBTC 99–20, with an uncertainty of ± 0.1 K). The equilibrium state was characterized by the absence of turbidity in both top and bottom phases. Aliquots of the top and bottom phases were collected with a syringe for analysis.
2.3. Determination of Equilibrium Compositions. The concentrations of salt were
22
(obtained by conductivity) from the total solution composition (obtained by refractive index) [27]. The standard deviation of the copolymer mass percent was ± 0.006 %. The water content was determined by the difference in the mass (percentage mass) of each component (wH2O =
wtotal– wS– wL64), where wtotal = 100 % (w/w). All analytical measurements were performed
in triplicate.
2.4. Microcalorimetric measurements. The enthalpy changes in the L64 and organic salt
interactions were performed in triplicate using a CSC–4200 microcalorimeter (Calorimeter Science Corp.) controlled by ItcRun software. Titrations were carried out at 298.15 K ± 0.002
K by adding aliquots of 1.0 L of a concentrated solution of one salt (20.0 % (m/m) of sodium succinate, sodium tartrate or sodium citrate and 30.0 % ammonium citrate) into a sample cell containing 1.82 mL of the aqueous mixture formed by L64 and the added salt (19.9 % (m/m) of L64 and 6.70 % (m/m) of sodium succinate; 18.4 % (m/m) of L64 and 7.75 % (m/m) of sodium tartrate; 20.2 % (m/m) of L64 and 6.52 % (m/m) of sodium citrate; or 8.14 % (m/m) of L64 and 29.1 % (m/m) of ammonium citrate). Raw data were analyzed using software supplied by the Calorimetry Sciences Corporation (ITCRun) after subtraction of the
blank experiments, which were as follows: i) the addition of 1 L of salt concentrated solution
into a sample cell containing 1.82 mL of water and ii) the addition of 1 L of water into a
23 3. Results and Discussion
3.1. Liquid–liquid equilibrium compositions: For macromolecule–salt ATPS, the decrease in
the free energy of the system occurs at specific thermodynamic conditions by an exclusion process between the polymer and electrolyte, leading to the formation of two aqueous phases. At lower polymer/salt concentrations, both components of the aqueous solution are miscible forming a single phase. However, above a critical concentration, they will separate into two phases, in which the upper phase is enriched in the polymer and the lower phase is concentrated in the salt component [26]. The composition of each phase depends on the macromolecule and electrolyte nature, opening the possibility to modulate the phase properties by changing the polymer and/or the salt structure.
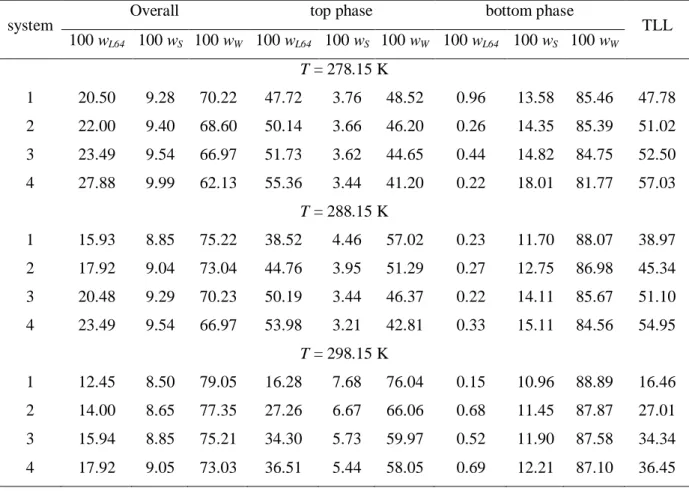
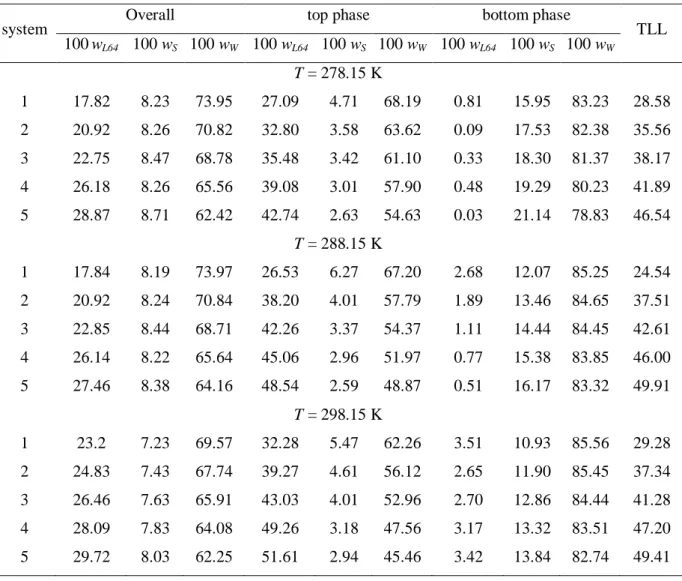
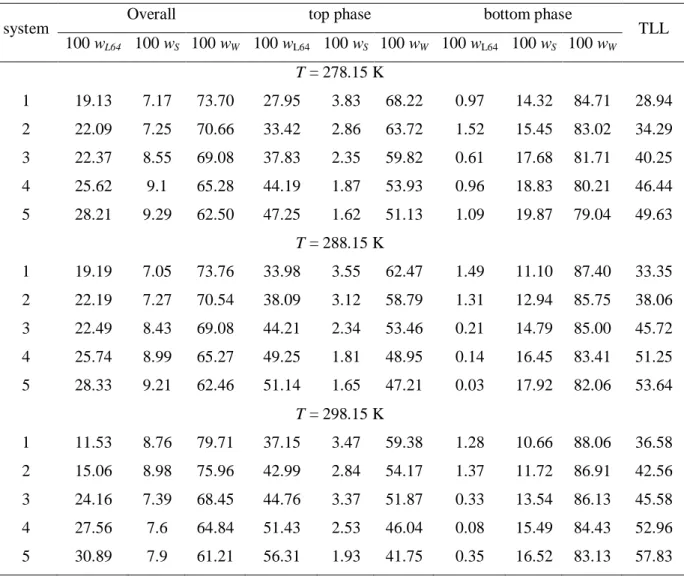
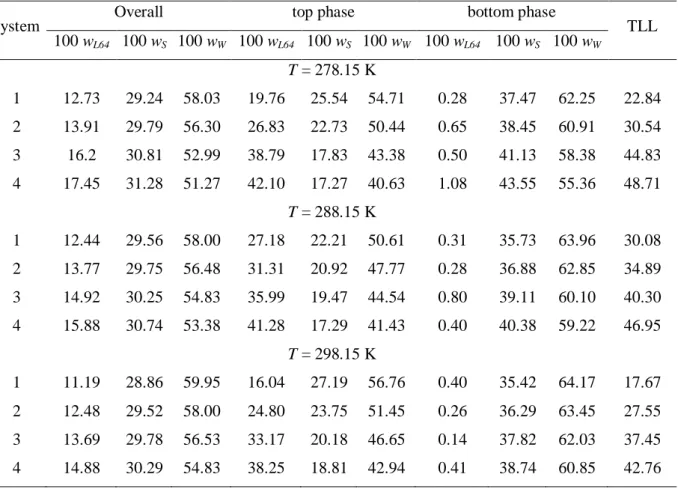
Tables 1 to 4 present liquid–liquid equilibrium (LLE) data of the upper and lower phases and the tie–line length (TLL) values, expressed in mass percent, for the L64 + sodium succinate + water, L64 + sodium tartrate + water, L64 + sodium citrate + water, and L64 + ammonium citrate + water ATPS at 278.15, 288.15, and 298.15 K. According to the system, four or five tie–lines (TL) were obtained. The tie–line length (TLL) is a thermodynamic parameter that at constant pressure and temperature expresses the difference in intensive thermodynamic functions between the upper and lower phases [7]. TLL is expressed as the difference between polymer and salt concentrations present in the phases and is calculated by the following equation:
2 2 1/2
[( TP PB) ( ST SB) ]
TLL C C C C (1)
where T P
C and B
P
C are the polymer concentrations in the top and bottom phases, respectively,
while T S
C and B
S
C are those of the salt. The tie lines were constructed by means of linear
24
upper and lower phases. It was observed that an increase in the overall composition enhanced the segregation between the copolymer and salt, i.e., the concentration of copolymer increased in the upper phase and decreased in the lower phase and that of the salt increased in the lower phase and decreased in the upper phase. This fact was also represented by the increase in TLL. This behavior has been reported previously for other ATPS [20, 26]. Nevertheless, as a consequence of the hydrophobic contribution of the PO segments [29], the top–phase water content is markedly lower than the water concentration observed in the top phase of the PEO– salt ATPS [30–33].
Table 1. Equilibrium Data for L64 (wL64) + Sodium Succinate (wS) + Water (wW) System from (278.15
to 298.15) K
system Overall top phase bottom phase TLL 100 wL64 100 wS 100 wW 100 wL64 100 wS 100 wW 100 wL64 100 wS 100 wW
T = 278.15 K
1 20.50 9.28 70.22 47.72 3.76 48.52 0.96 13.58 85.46 47.78
2 22.00 9.40 68.60 50.14 3.66 46.20 0.26 14.35 85.39 51.02
3 23.49 9.54 66.97 51.73 3.62 44.65 0.44 14.82 84.75 52.50
4 27.88 9.99 62.13 55.36 3.44 41.20 0.22 18.01 81.77 57.03
T = 288.15 K
1 15.93 8.85 75.22 38.52 4.46 57.02 0.23 11.70 88.07 38.97
2 17.92 9.04 73.04 44.76 3.95 51.29 0.27 12.75 86.98 45.34
3 20.48 9.29 70.23 50.19 3.44 46.37 0.22 14.11 85.67 51.10
4 23.49 9.54 66.97 53.98 3.21 42.81 0.33 15.11 84.56 54.95
T = 298.15 K
1 12.45 8.50 79.05 16.28 7.68 76.04 0.15 10.96 88.89 16.46
2 14.00 8.65 77.35 27.26 6.67 66.06 0.68 11.45 87.87 27.01
3 15.94 8.85 75.21 34.30 5.73 59.97 0.52 11.90 87.58 34.34
25
Table 2. Equilibrium Data for L64 (wL64) + Sodium Tartrate (wS) + Water (wW) System from (278.15 to 298.15) K
system Overall top phase bottom phase TLL 100 wL64 100 wS 100 wW 100 wL64 100 wS 100 wW 100 wL64 100 wS 100 wW
T = 278.15 K
1 17.82 8.23 73.95 27.09 4.71 68.19 0.81 15.95 83.23 28.58
2 20.92 8.26 70.82 32.80 3.58 63.62 0.09 17.53 82.38 35.56
3 22.75 8.47 68.78 35.48 3.42 61.10 0.33 18.30 81.37 38.17
4 26.18 8.26 65.56 39.08 3.01 57.90 0.48 19.29 80.23 41.89
5 28.87 8.71 62.42 42.74 2.63 54.63 0.03 21.14 78.83 46.54
T = 288.15 K
1 17.84 8.19 73.97 26.53 6.27 67.20 2.68 12.07 85.25 24.54
2 20.92 8.24 70.84 38.20 4.01 57.79 1.89 13.46 84.65 37.51
3 22.85 8.44 68.71 42.26 3.37 54.37 1.11 14.44 84.45 42.61
4 26.14 8.22 65.64 45.06 2.96 51.97 0.77 15.38 83.85 46.00
5 27.46 8.38 64.16 48.54 2.59 48.87 0.51 16.17 83.32 49.91
T = 298.15 K
1 23.2 7.23 69.57 32.28 5.47 62.26 3.51 10.93 85.56 29.28
2 24.83 7.43 67.74 39.27 4.61 56.12 2.65 11.90 85.45 37.34
3 26.46 7.63 65.91 43.03 4.01 52.96 2.70 12.86 84.44 41.28
4 28.09 7.83 64.08 49.26 3.18 47.56 3.17 13.32 83.51 47.20
26
Table 3. Equilibrium Data for L64 (wL64) + Sodium Citrate (wS) + Water (wW) System from (278.15 to
298.15) K
system Overall top phase bottom phase TLL 100 wL64 100 wS 100 wW 100 wL64 100 wS 100 wW 100 wL64 100 wS 100 wW
T = 278.15 K
1 19.13 7.17 73.70 27.95 3.83 68.22 0.97 14.32 84.71 28.94
2 22.09 7.25 70.66 33.42 2.86 63.72 1.52 15.45 83.02 34.29
3 22.37 8.55 69.08 37.83 2.35 59.82 0.61 17.68 81.71 40.25
4 25.62 9.1 65.28 44.19 1.87 53.93 0.96 18.83 80.21 46.44
5 28.21 9.29 62.50 47.25 1.62 51.13 1.09 19.87 79.04 49.63
T = 288.15 K
1 19.19 7.05 73.76 33.98 3.55 62.47 1.49 11.10 87.40 33.35
2 22.19 7.27 70.54 38.09 3.12 58.79 1.31 12.94 85.75 38.06
3 22.49 8.43 69.08 44.21 2.34 53.46 0.21 14.79 85.00 45.72
4 25.74 8.99 65.27 49.25 1.81 48.95 0.14 16.45 83.41 51.25
5 28.33 9.21 62.46 51.14 1.65 47.21 0.03 17.92 82.06 53.64
T = 298.15 K
1 11.53 8.76 79.71 37.15 3.47 59.38 1.28 10.66 88.06 36.58
2 15.06 8.98 75.96 42.99 2.84 54.17 1.37 11.72 86.91 42.56
3 24.16 7.39 68.45 44.76 3.37 51.87 0.33 13.54 86.13 45.58
4 27.56 7.6 64.84 51.43 2.53 46.04 0.08 15.49 84.43 52.96
27
Table 4. Equilibrium Data for L64 (wL64) + Ammonium Citrate (wS) + Water (wW) System from
(278.15 to 298.15) K
system Overall top phase bottom phase TLL 100 wL64 100 wS 100 wW 100 wL64 100 wS 100 wW 100 wL64 100 wS 100 wW
T = 278.15 K
1 12.73 29.24 58.03 19.76 25.54 54.71 0.28 37.47 62.25 22.84
2 13.91 29.79 56.30 26.83 22.73 50.44 0.65 38.45 60.91 30.54
3 16.2 30.81 52.99 38.79 17.83 43.38 0.50 41.13 58.38 44.83
4 17.45 31.28 51.27 42.10 17.27 40.63 1.08 43.55 55.36 48.71
T = 288.15 K
1 12.44 29.56 58.00 27.18 22.21 50.61 0.31 35.73 63.96 30.08
2 13.77 29.75 56.48 31.31 20.92 47.77 0.28 36.88 62.85 34.89
3 14.92 30.25 54.83 35.99 19.47 44.54 0.80 39.11 60.10 40.30
4 15.88 30.74 53.38 41.28 17.29 41.43 0.40 40.38 59.22 46.95
T = 298.15 K
1 11.19 28.86 59.95 16.04 27.19 56.76 0.40 35.42 64.17 17.67
2 12.48 29.52 58.00 24.80 23.75 51.45 0.26 36.29 63.45 27.55
3 13.69 29.78 56.53 33.17 20.18 46.65 0.14 37.82 62.03 37.45
4 14.88 30.29 54.83 38.25 18.81 42.94 0.41 38.74 60.85 42.76
The effect of temperature on the binodal position is shown in Figures 1 to 4. For the L64–(NH4)3C6H5O7 ATPS, the temperature has an insignificant effect on the phase
equilibrium compositions (Fig. 4). Nevertheless, a slight increase was observed in the biphasic area with the reduction of the temperature of the systems for L64–Na2C4H4O4, L64–
Na2C4H4O6 and L64–Na3C6H5O7 ATPS, indicating that the phase separation process has an
28
Figure 1. Temperature effect on the phase diagram for the L64 + Sodium Succinate system: ▲, 278.15 K; ○, 298.15 K.
Figure 2. Temperature effect on the phase diagram for the L64 + Sodium Tartrate system: ▲, 278.15 K; ○, 298.15 K.
2 4 6 8 10 12 14 16 18 20
0 10 20 30 40 50 60
100w
L64
100w
s
0 5 10 15 20 25
0 10 20 30 40 50 60
100w
L64
29
Figure 3. Temperature effect on the phase diagram for the L64 + Sodium Citrate system: ▲, 278.15 K; ○, 298.15 K.
Figure 4. Temperature effect on the phase diagram for the L64 + Ammonium Citrate system: ▲, 278.15 K; ○, 298.15 K.
0 2 4 6 8 10 12 14 16 18 20 22
0 10 20 30 40 50 60
100w
L64
100w
S
15 20 25 30 35 40 45
0 10 20 30 40 50
100w
L64
100w
30
3.2. Microcalorimetric studies of ATPS formation: Calorimetric measurements were carried
out by da Silva and Loh [34] to investigate and explain the ATPS formation process. According to the proposed model, when PEO and salts are mixed, the ions and the polymer interact, releasing solvation water molecules in a process driven by this increase in entropy. The ion binding continues as more electrolytes are added until it reaches a saturation point, after which no more entropy is gained and the phase splitting becomes more favorable. After this saturation point, the addition of more salt would lead to a higher concentration in the bulk than around the polymer. The proposition that phase separation occurs in association with the saturation of the electrolyte–polymer binding may sound contradictory to features of the binodal curves for aqueous two–phase systems, which highlights that at lower concentrations of one component, more of the other component is necessary to induce phase splitting. At this point, it is important to stress that this saturation does not mean physical saturation of the binding sites around the polymer, but that a significant amount of electrolyte is left in solution without interacting with the polymer, destabilizing the system, hence, leading to phase separation.
The microcalorimetric results obtained by da Silva and Loh [34] point out that the interaction between PEO and Na2SO4 (or Li2SO4) is an endothermic event, and the
temperature increment should cause the interaction to be more favorable, leading to a decrease in the amount of salt necessary for phase splitting. To investigate why the phase separation process in L64–organic salts ATPS is exothermic, microcalorimetric measurements were taken to determine the enthalpy change associated with salt–L64 interaction. Figure 5 shows the titration curves obtained in our work, in which the observed apparent molar
enthalpy of the interaction, Hap–int,for each injection, is plotted against the injection number.
31
not known, we cannot calculate the exact molar enthalpy change of the interaction, but instead
only the apparent molar enthalpy change, Hap–int.
For the ammonium citrate ATPS salt concentration intervals examined in this work,
the Hap–int values are in the range of –2.3 kJ mol–1 < Hap–int < –1.8 kJ mol–1,which can
explain the minor temperature effect on the phase separation behavior of this ATPS. Different from Li2SO4 and Na2SO4, the (NH4)3C6H5O7 has an exothermic interaction with the L64
macromolecules, suggesting that a temperature decrease should make this interaction more favorable, leading to a decrease in the amount of salt necessary for phase splitting. However, this small magnitude of the energy of interaction should explain the insignificant effect of the temperature change on the phase separation process. For the other three salts, sodium citrate,
sodium succinate and sodium tartrate, the Hap–int values are endothermic and are in the range
of +6.0 kJ mol–1 < Hap–int < +21.0 kJ mol–1. Despite these positive values of the interaction
energy, the enthalpy change associated with the phase separation process, p–sH, is
exothermic for all sodium organic salts, and their values are Na2C4H4O4= – 3.0 kJ mol–1,
Na2C4H4O6= – 6.0 kJ mol–1 and Na3C6H5O7= – 3.0 kJ mol–1. These negative energies of the
32
0 20 40 60 80 100
-2,2 -2,0 -1,8 -1,6
H a p -int / kJ m ol -1 injection number ammonium citratep-sH
0 20 40 60 80 100
6 9 12 15 18 21 sodium citrate sodium succinate sodium tartrate
Figure 5. Apparent enthalpic interaction between L64 and different organic salts.
The influence of the temperature on the phase equilibrium also can be analyzed by applying the slope of the tie–line (STL) concept. The STL values, which are reported in Table 5, express the effect of the thermodynamic conditions on system composition. The STL can be calculated as shown by the following equation:
T B P P T B S S C C STL C C (2)
where CPT and CPB are the polymer concentrations in the top and bottom phases, respectively,
while CST and B S
C are those of the salt. As shown in Table 5, an increase in the temperature
33
the increase in temperature promotes a decrease of the content of water in the top phase and, consequently, an increase of the solvent concentration in the bottom phase.
Table 5. STL Values for L64 + salt + Water Systems
L64+ sodium succinate + water
system T/K
278.15 288.15 298.15
1 –4.77 –5.27 –4.94
2 –4.67 –5.07 –5.51
3 –4.58 –4.70 –5.47
4 –3.77 –4.51 –5.28
L64 + sodium tartrate + water
system T/K
278.15 288.15 298.15
1 –2.32 –4.08 –5.27
2 –2.33 –3.84 –5.02
3 –2.35 –3.71 –4.56
4 –2.37 –3.57 –4.54
5 –2.31 –3.53 –4.42
L64 + sodium citrate + water
system T/K
278.15 288.15 298.15
1 –2.57 –4.30 –4.96
2 –2.53 –3.74 –4.67
3 –2.43 –3.53 –4.33
4 –2.55 –3.35 –3.92
5 –2.53 –3.15 –3.82
L64 + ammonium citrate + water
system T/K
278.15 288.15 298.15
1 –1.61 –1.99 –1.83
2 –1.66 –1.95 –1.95
3 –1.65 –1.80 –1.88
34
Table 6. Water content in mass percentage in top and bottom phases in function of temperature and
tie–line length
T / K; TLL / % (w/w)
top phase
water content / % (w/w)
bottom phase
water content / % (w/w)
sodium citrate
278.15; 38.17 61.10 81.37
288.15; 37.51 57.79 84.65
298.15; 37.34 56.12 85.45
sodium tartrate
278.15; 34.29 63.72 83.02
288.15; 33.35 62.47 87.40
298.15; 36.58 59.38 88.06
Figure 6 presents the influence of anions on the phase diagram of the L64 + sodium salt systems at 278.15 K. For salts in which the cation is Na+, the ability of the three anions to promote the formation of ATPS followed the order: citrate > tartrate > succinate. Because sodium citrate has the higher endothermic energy of interaction with L64 and its phase separation energy is not the most negative, we can conclude that the higher efficiency of sodium citrate in promoting the phase separation can be associated with the entropic aspect of the splitting phase process, i.e., the positive entropic change due to the increase of translational entropy of water molecules that are released during the biphasic systems formation. The cation effect on the binodal position is also shown in Figure 6. As can be seen, lower Na3C6H5O7 concentrations were required to generate an ATPS as compared to
(NH4)3C6H5O7, an indication that Na+ cations are more capable of inducing ATPS formation
than NH4+ cations. This observed behavior can be attributed to different interaction energies
between cations and EO segments in the copolymer molecule. The L64–Na3C6H5O7
interaction energy is higher than that of the L64–(NH4)3C6H5O7 apparent enthalpic interaction,