CONSIDERATIONSăONăROMANIA’SăVEGETABLEăMARKET
Agatha POPESCU
University of Agricultural Sciences and Veterinary Medicine Bucharest, 59 Marasti, District 1, Zip code 011464, Bucharest, Romania, Phone: +40 213182564/232, Fax:+40213182888,
Email:[email protected]
Corresponding author: [email protected]
Abstract
The paper aimed to present the situation of Romania’s vegetable market in the period 2007-2011 based on the statistical data regarding the main vegetables: tomatoes, onion, garlic, cabbage, green peppers and melons. The vegetable production increased by 33.99 from 3,166.8 tons in 2007 to 4,176.3 tons in 2011.This was due to the yield gain as follows: 58.55 % for melons, 27.62 % for green peppers, 27.05 % for tomatoes, 25.99 % for dry garlic, 24.96 % for dry onion, 12.61 % for white cabbage. In 2011, the contribution of various categories of vegetables to production was: 24.55 % white cabbage, 21.81 % tomatoes, 15.45 % melons, 9.44 % onion, 6.06 % green pepper, 1.59 % garlic and 21.1 % other vegetables.The contribution of the micro regions to vegetable production in 2011 was: 19.46 % South Muntenia, 18.95 % South East Romania, 17.30 % South West Oltenia, 15.92 % North East Romania, 10.43 % West Romania, 8.47 % North West Romania, 6.54 % Central Romania, 2.93 % Bucharest Ilfov. Vegetable production per inhabitant is higher in Romania compared to the average production per capita in the EU. The average consumption increased as a postive aspect reflecting the obtained production and import. Vegetable production should increase in order to cover much better the doestic market needs and support export to the EU market.
Key words: cultivated area,market, production, Romania, vegetables
INTRODUCTION
Vegetables are rich in a large variety of nutrients important for human diet: fibers, vitamins (A,C K, etc), minerals ( K, Ca, Mg, Fe, Zn etc), and also proteins and fats in small amounts. Due to their chemical composition, vegetables are recommended to be consumed in the daily diet in 3-5 portions mainly as fresh, chopped, boiled vegetable and also as vegetable juice [1, 2].
Due to the intensive campaign on vegetable importance in the human diet for a healthy life, vegetable consumption has continuously increased. From this point of view, Romania comes on the 6th position in the EU, after Italy, Germany, Spain, France and Poland [5]. Romania has a high production potential being able to carry out a large variety of vegetable along the year due to its climate and soil conditions which offer them a special taste. Vegetable production has a seasonal character which means that is not able to cover market needs in all the seasons. Also, another feature is the fact that vegetables have
to be consumed immediately after harvesting, in general as fresh vegetables in order to preserve their content in vitamins.
In this context, this paper aimed to present the actual situation in Romania regarding cultivated area, yield and production, their distribution in the territory, consumption and trade in order to identify the main trends in the vegetable market.
MATERIALS AND METHODS
The paper is based on the data collected from
RomКnТК’s SЭКЭТsЭТМКl ВОКrЛook, 2012 КnН
vegetable trade balance. They were processed using the well known index, share and comparison methods.
RESULTS AND DISCUSSIONS
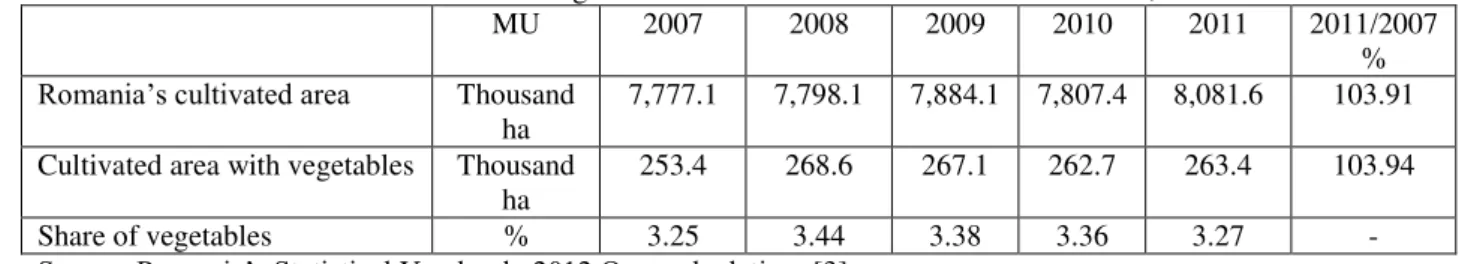
Surface cultivated with vegetables
increased by 3.94 % from 253.4 thousand ha in 2007 to 8,081.6 thousand ha in 2011. The share of cultivated area with vegetables in the total cultivated land registered a slight increase from 3.25 % in 2007 to 3.27 % in 2011(Table 1).
Table 1. Evolution of cultivated area with vegetables and its share in the total cultivated land, 2007-2011
MU 2007 2008 2009 2010 2011 2011/2007
%
RomКnТК’s МЮlЭТЯКЭОН КrОК Thousand
ha
7,777.1 7,798.1 7,884.1 7,807.4 8,081.6 103.91
Cultivated area with vegetables Thousand ha
253.4 268.6 267.1 262.7 263.4 103.94
Share of vegetables % 3.25 3.44 3.38 3.36 3.27 -
SoЮrМО: RomКnТК’s SЭКЭТsЭТМКl ВОКrЛook, 2012.Oаn МКlМЮlКЭТon. [3]
Cultivated surface by vegetable category.
The cultivated surface increased in general for all the categories of vegetables except dry onion and melons. The highest growth was registered by tomatoes in the period 2007-2011, accounting for 12.60 %. In 2007-2011, the cultivated land with tomatoes was 51.8
thousand ha compared to 46 thousand ha in 2007. On the 2nd position, it is situated green pepper whose cultivated area increased by 7.52 % from 18.6 thousand ha in 2007 to 47 thousand ha in 2011.
Table 2. Evolution of cultivated area by vegetable category, 2007-2011 (thousand ha)
2007 2008 2009 2010 2011 2011/2007 %
Cultivated land with vegetables 2534 268.6 267.1 262.7 263.4 103.94
Tomatoes 46.0 51.5 49.1 49.8 51.8 112.60
Dry onion 34.1 35.0 35.2 33.8 33.1 97.06
Dry garlic 11.5 13.8 13.1 12.8 12.1 105.21
White cabbage 46.1 49.0 48.3 47.0 47.0 101.95
Green peppers 18.6 20.2 20.0 21.0 20.0 107.52
Melons 31.0 29.7 33.5 31.5 30.9 99.67
Subtotal 187.3 199.2 199.2 195.9 194.9 104.05
Other vegetables 66.1 69.4 67.9 66.8 68.5 103.63
Source: RomКnТК’s SЭКЭТsЭТМКl ВОКrЛook, 2012.Oаn МКlМЮlКЭТon. [3]
The dry garlic comes on the 3rd position because its cultivated area increased by 5.21 % from 11.5 thousand ha in 2007 to 12.1 thousand ha in 2011. The surface cultivated with white cabbage increased by 1.95 % from 46.1 thousand ha in 2007 to 47 thousand ha in 2011.The cultivated land with melons decreased by 0.33 % from 31 thousand ha in 2007 to 30.9 thousand ha in 2011. The cultivated area with dry onion declined by 2.94 % from 34.1 thousand ha in 2007 to 33.1 thousand ha in 2011 (Table 2).
Structure of cultivated area with vegetables by vegetable category. In 2007, the cultivated land with vegetables had the
following structure: 18.19 % white cabbagge, 18.15 % tomatoes, 13.45 % dry onion, 12.23 % melons, 7.34 % green peppers, 4.53 % dry garlic and 26.11 % other vegetables.
In 2011, it was recorded the following structure of the cultivated land with vegetables: 19.66 % tomatoes, 17.84 % white cabbage, 12.56 % dry onion, 11.73 % melons, 7.59 % green peppers, 4.59 % dry garlic and 26.03 % other vegetables.
Distribution of cultivated land with vegetables by macro and micro regions was the following one in 2011: 34.19 % macro region M2, 28.90 %, macro region M4, 21.50 % macro region M3 and 15.41 % macro region M1. By micro region, the order of importance regarding the cultivated land with
vegetables was the following one: 19.25 % South Muntenia, 17.69 % North East Romania, 17.25 % South Oltenia, 16.50 % South East Romania, 11.65 % West Romania, 8.67 % North West Romania, 6.74 % Central Romania, 2.25 % Bucharest-Ilfov (Table 3).
Table 3. Land cultivated with vegetables by macro and micro region in 2011
Macro/Micro Region Cultivated land (ha) %
Total 263,359 100.00
M1 Macro region 40,605 15.41
-North West 22.840 867
-Center 17,765 6.74
M2 Macro region 90,067 34.19
-North East 46,605 17.69
-South East 43,462 16.50
M3 Macro region 56,626 21.50
-South Muntenia 50,710 19.25
-Bucharest Ilfov 5,916 2.25
M4 Macro region 76,061 28.90
-South West Oltenia 45,439 17.25
-West 30,622 11.65
Source: RomaniК’s SЭКЭТsЭТМКl ВОКrЛook, 2012.Oаn МКlМЮlКЭТon. [3]
Structure of cultivated land with vegetabes in the territory by vegetable category in 2011.
-Tomatoes were cultivated in macroregions as follows: 39.18 % in M4, 34.68 % in M2, 24.79 % in M3 and 11.35 % in M1. By micro region, the share of cultivated land with tomatoes, in the decreasing order was the following one: 21.21 % South Muntenia, 19.84 % West Romania, 19.34 % South West Oltenia, 19.15 % South East Romania, 15.53 % North East Romania, 6.36 % Nort West Romania, 4.99 % Central Romania, 3.58 % Bucharest Ilfov.
-Onion was cultivated as follows: 37.05 % M2, 25.95 % M4, 19.40 % M3 amd 17.58 % M1. By micro region, the situation was the following one: 21.33 % North Eastern Romania, 17.77 % South Muntenia, 15.72 % South Eastern Romania, 14.65 % South West Oltenia, 11.30 % West Romania, 9.09 % Central Romania, 8.49 % North Western Romania, 1.63 % Bucharest Ilfov.
-White cabbage was cultivated by macro region as follows: 29.35 % M4, 27.16 % M2, 24.40 M3 and 19.99 % M1. By micro region, in the decreasing order of the share of the cultivated surface, the situation was the
following one: 22.16 % South Muntenia, 18.74 % North East Romania, 16.09 % South West Oltenia, 13.26 % West Romania, 10.10 % North West Romania, 8.99 % Central Romania, 8.42 % South East Romania, 2.24 % Bucharest Ilfov.
-Green peppers weight in tha cultivated area with vegetables by macro region was : 43.39 % M2, 34.90 % M4, 18.50 % M3 and 3.21 % M1. By micro region, the situation was the following one:33.91 % South East Romania, 28.42 % South West Oltenia, 18.07 % South Muntenia, 9.48 % North East Romania, 6.48 % West Romania, 2.67 % North West Romania, 0.54 % Central Romania, 0.43 % Bucharest Ilfov.
kg/ha in 2011. Melon average production grew by 58.55 % from 13,161 kg/ha in 2007
to 20,868 kg/ha in 2011 ( Table 4).
Table 4. Vegetable Yield, 2007-2011 (kg/ha)
2007 2008 2009 2010 2011 2011/2007 %
Tomatoes 13,916 15,814 15,395 15,443 17,602 127.05
Dry onion 9,526 11,294 10,748 10,908 11,904 124.96
Dry garlic 4,359 5,244 4,812 5,250 5,492 125.99
White cabbage
19,364 19,680 20,724 20,858 21,807 112.61
Green peppers 9,931 11,824 12,295 11,592 12,674 127.62
Melons 13,161 18,942 19,490 21,055 20,868 158.55
SoЮrМО: RomКnТК’s SЭКЭТsЭТМКl ВОКrbook, 2012.Own calculations. [3]
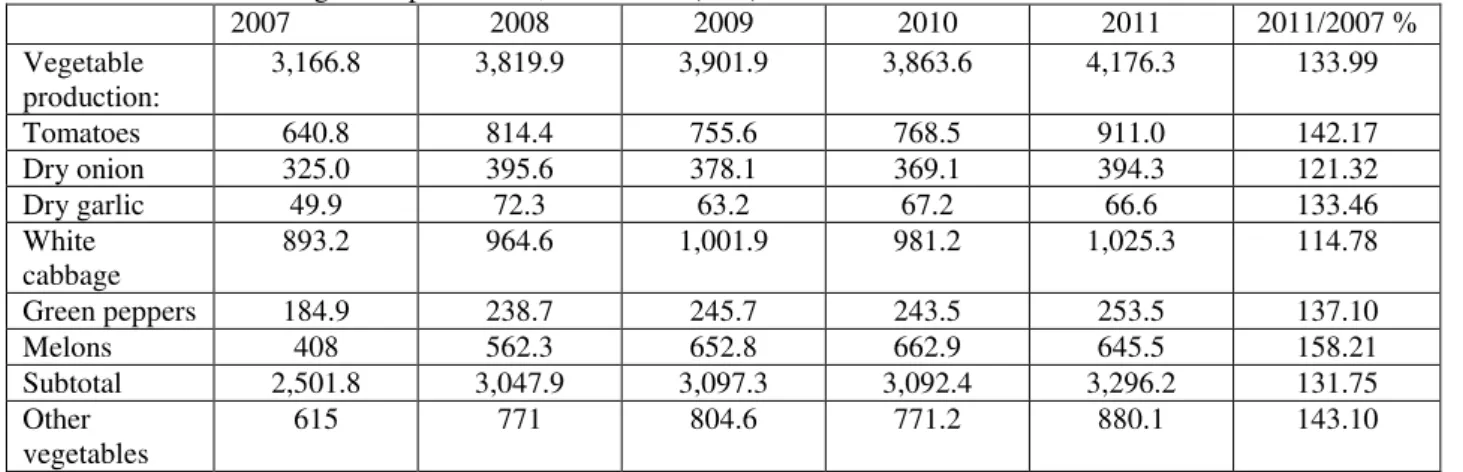
Vegetable production increased by 33.99 % from 3,116.8 tons in 2007 to 4,176.3 tons in 2011. This was due to the increase of cultivated surface and mainly due to the yield gain.Tomatoes production increased by 42.17 % from 640.8 tons in 2007 to 911 tons in 2011. Dry onion production increased by 21.32 % from 325 tons in 2007 to 394.3 tons in 2011. Dry garlic production increased by
33.46 5 from 49.9 tons in 2007 to 66.6 tons in 2011. White cabbage production increased by 14.78 % from 893.2 tons in 2007 to 1,025.3 tons in 2011. Green peppers production grew by 37.10 % from 184.9 tons in 2007 to 253.5 tons in 2011. Melon production increased by 58.21 % fom 408 tons in 2007 to 645.5 tons in 2011 (Table 5).
Table 5. Evolution of vegetable production, 2007-2011 (tons)
2007 2008 2009 2010 2011 2011/2007 %
Vegetable production:
3,166.8 3,819.9 3,901.9 3,863.6 4,176.3 133.99
Tomatoes 640.8 814.4 755.6 768.5 911.0 142.17
Dry onion 325.0 395.6 378.1 369.1 394.3 121.32
Dry garlic 49.9 72.3 63.2 67.2 66.6 133.46
White cabbage
893.2 964.6 1,001.9 981.2 1,025.3 114.78
Green peppers 184.9 238.7 245.7 243.5 253.5 137.10
Melons 408 562.3 652.8 662.9 645.5 158.21
Subtotal 2,501.8 3,047.9 3,097.3 3,092.4 3,296.2 131.75
Other vegetables
615 771 804.6 771.2 880.1 143.10
SoЮrМО: RomКnТК’s SЭКЭТsЭТМКl ВОКrЛook, 2012.Oаn МКlМЮlКЭТons [3]
Contribution of various vegetables to production. In 2007, the situation was the following one: 28.65 % white cabbage, 20.55 % tomates, 13.09 % melons, 10.42 % dry onion, 5.93 % green peppers, 1.60 % dry garlic, 19.76 % other vegetables. In 2011, the decreasing order of the contribution of vegetables to production was: 24.55 % white cabbage, 21.81 % tomatoes, 15.45 % melons, 9.44 % onion, 6.06 % green pepper, 1.59 % garlic and 21.1 % other vegetables.
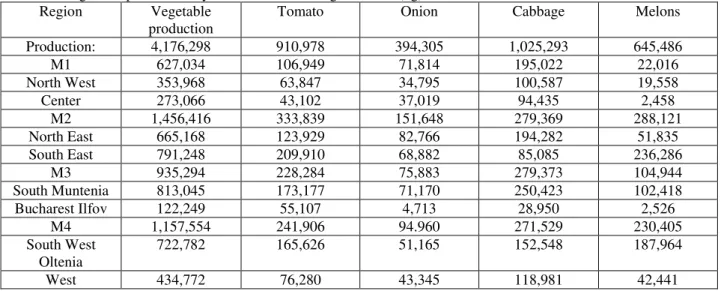
Distribution of vegetable production in the territory by macro region was the following one in 2011: 34.87 % M2, 27.73 % M4, 22.39
% M3 and 15.01 % M1. In the decreasing order, the contribution of the micro regions to vegetable production was the following one in 2011: 19.46 % South Muntenia, 18.95 % South East Romania, 17.30 % South West Oltenia, 15.92 % North East Romania, 10.43 % West Romania, 8.47 % North West Romania, 6.54 % Central Romania, 2.93 % Bucharest Ilfov.
Oltenia, 13.60 % North East Romania, 8.39 % West Romania, 7 % North West Romania, 6.04 % Bucharest Ilfov, 4.734 % Central Romania.
-Onionwas achieved as follows: 24.10 % M4, 38.45 % M2, 19.24 % M3, 18.21 % M1. By micro reion, the situation was the following one: 20.99 % North East Romania, 18.04 % South Muntenia, 17.46 % South East Romania, 13.09 % South West Oltenia, 10.10 % Central Romania, 9.01 % West Romania, 8.82 % North West Romania, 1.20 % Bucharest Ilfov.
-Cabagge was produced as follows: 27.24 % in M3, 27.24 % in M2, 26.50 % in M4 and 19.02 % in M1. The production achieved by macro region was presented as follows: 24.42
% South Muntenia, 18.94 % North East Romania, 14.87 % South West Oltenia, 11.63 % West Romania, 9.81 % North West, 9.21 % Central Romania, 8.30 % South East Romania, 2.82 % Bucharest Ilfov.
-Melon production was carried out by the following contribution of macro regions: 44.63 % M2, 35.71 % M4, 16.25 % M3 and 3.41 % M1. The contribution by micro region was: 36.10 % South East Romania, 29.11 % South West Oltenia, 15.86 % South Muntenia, 8.03 % North East Romania, 6.60 % West Romania, 3.02 % North West Romania, 0.39 % Central Romania and 0.39 % Bucharest Ilfov ( Table 6).
Table 6. Vegetable production by macro and micro region, 2011 (kg)
Region Vegetable
production
Tomato Onion Cabbage Melons
Production: 4,176,298 910,978 394,305 1,025,293 645,486
M1 627,034 106,949 71,814 195,022 22,016
North West 353,968 63,847 34,795 100,587 19,558
Center 273,066 43,102 37,019 94,435 2,458
M2 1,456,416 333,839 151,648 279,369 288,121
North East 665,168 123,929 82,766 194,282 51,835
South East 791,248 209,910 68,882 85,085 236,286
M3 935,294 228,284 75,883 279,373 104,944
South Muntenia 813,045 173,177 71,170 250,423 102,418
Bucharest Ilfov 122,249 55,107 4,713 28,950 2,526
M4 1,157,554 241,906 94.960 271,529 230,405
South West Oltenia
722,782 165,626 51,165 152,548 187,964
West 434,772 76,280 43,345 118,981 42,441
SoЮrМО: RomКnТК’s SЭКЭТsЭТМКl ВОКrЛook, 2012.Oаn МКlМЮlКЭТons. [3]
Vegetable production per inhabitant
increased by 34.76 % from 144.7 kg in 2007 to 195 kg in 2011 as a consequence of the increased production ( Table 7).
This is a pozitive aspect for Romania taking into account as the average production per inhabitant in the EU is smaller: 127 kg (2007), 125 kg (2008) and 131 kg (2009). This reflect
RomКnТК’s high production potential [5].
Table 7. Production per inhabitant ( kg/capita)
2007 2008 2009 2010 2011 2011/2007 %
Production per capita 144.7 177.6 181.7 180.3 195 34.76
Table 8. Vegetable Consumption, 2007-2009
MU 2007 2008 2009 2009/2007 %
Vegetable consumption Thousand tons 3,245 3,738 3,643 112.26
Average annual consumption per inhabitant
Kg/capita 149 173 169 113.42
Vegetable consumption Romania comes on the 6th position in the EU based on vegetable consumption after Italy, Germany, Spain, France and Poland.
This happens while in other EU countries like Luxembourg, Malta, Latvia, Slovenia and Denmark vegetable consumption is low due to
the climate conditions unfavorable to produce vegetables and the high import price.
Average purchase price increased in general in case of all vegetables. For example, in case of tomatoes, it increased by 15.57 % from Lei 1.22/kg in 2007 to Lei 1.41/kg in 2011 (Table 9).
Table 9.Vegetable average purchase price, 2007-2011 ( Lei/kg)
2007 2008 2009 2010 2011 2011/2007 %
Vegetable average purchase price 1.22 0.82 1.06 1.07 1.41 15.57
SoЮrМО: RomКnТК’s SЭКЭТsЭТМКl ВОКrЛook, 2012.Oаn МКlМЮlКЭТons. [3]
The price indices for cabbage and onion are presented in Table 10. The highest increase compared to 2005 level was registered in 2010 ( +29.8 %) for cabbage and in 2011 (+101.3 %) for onion.
Table 10. Vegetable price indices (%)(2005=100)
2007 2008 2009 2010 2011
Cabbage 108.3 103.3 103.3 129.8 92.5 Onion 169.4 164.4 160.4 190.4 201.3 SoЮrМО: RomКnТК’s SЭКЭТsЭТМКl ВОКrЛook, 2012.Oаn calculations. [3]
Average prices for the main vegetables sold in the agro-food markets in 2011 varied from a market to another depending on offer/demand ratio. The average price was Lei 2.19 per kg for onion, Lei 2.16 per kg for tomatoes and Lei 1.01 per kg for cabbage. -Tomato price varied between the highest levle registered as follows: Lei 4 per kg at Sf.Gheorghe, Lei 3.99 in Arad, Lei 3.65 in Miercurea Ciuc, Lei 3.61 in Brasov and Lei 3.59 in Sibiu and the lowest levels: Lei 1.62 in Slatina, Lei 2.01 in Tg. Jiu, Lei 2.02 in Galati, Lei 2.15 in Focsani and Lei 2.19 in Vaslui. -Onion price varied between the highest level: Lei 3.21 in Miercurea Ciuc, Lei 3.20 in Zalau, Lei 3.12 in Sibiu, Lei 3.06 in Brasov and the lowest levels: Lei 1.75 in Braila, Lei 1.84 in Craiova and Lei 1.99 in Bacau.
-Cabbage price varied between the highest levels: Lei 2.42 in Brasov, Lei 2.34 in Vaslui, Lei 2.29 in Piatra Neamt and the lowest levels: Lei 1.04 in Alexandria and Giurgiu, Lei 1.10 in Drobeta-Turnu Severin, Lei 1.12 in Craiova.
Romania’să tradeă withă vegetables.
RomКnТК’s ЯОРОЭКЛlО ЭrКНО ЛКlКnМО аКs
characterized in the period 2000-2009 by the following figures: exported vegetable 256 thousand tons, imported vegetables 448 thousand tons, reflecting that Romania is a net importing country as import exceeds export. A part of fresh vegetables are needed to be imported in order to cover internal market needs in the extraseason, which is an incentive to increase consumption and assure a healthy food for population. Vegetables are imported mainly as fresh products and also as frozen products. Market demand is in general relatively constant along the year, except some celebration moments when comsumption increases.
CONCLUSIONS
The most adequate areas for cultivating vegetables are, in the decreasing order: for tomatoes: South Muntenia, West Romania, South West Oltenia and South East Romania; for onion: North East Romania, South Muntenia, North East Romania, South West Oltenia and West Romania; for white cabbage: South Muntenia, North East Romania, South West Oltenia, West Romania; for green peppers: South Eastern Romnaia, South West Oltenia, South Muntenia, North East Romania.
The production gain by vegetable category registered in the period 2007-2011 was the following one: 58.21 % for melons, 42.17 % for tomatoes, 37.10 % for green peppers, 33.46 % for dry garlic, 21.32 % for dry onion, 14.78 % for white cabbage.
In 2011, the contribution of various categories of vegetables to production was: 24.55 % white cabbage, 21.81 % tomatoes, 15.45 % melons, 9.44 % onion, 6.06 % green pepper, 1.59 % garlic and 21.1 % other vegetables. The contribution of the micro regions to vegetable production in 2011 was: 19.46 % South Muntenia, 18.95 % South East Romania, 17.30 % South West Oltenia, 15.92 % North East Romania, 10.43 % West Romania, 8.47 % North West Romania, 6.54 % Central Romania, 2.93 % Bucharest Ilfov. Vegetable production per inhabitant is higher in Romania compared to the average production per capita in the EU. The average consumption increased as a postive aspect reflecting the obtained production and import. Vegetable production should increase in Romania in order to cover much better the domestic market needs and support export to the EU market.
REFERENCES
[1]Heller Julia, 2012, Le Compteur Alimentaire, Fod Guide, What and how much we eat?, Les editions Quebecor, Translation into Romanian, Lider Press House, Bucharest
[2]Pridie Elena, 2004, The Bokk of my family, Ceres Press House, Bucharest, p.69-70
Д3] RomКnТК’s SЭКЭТsЭТМКl ВОКrЛook, 2012 [4]FAOStat, 2012
[5]Eurostat, www.epp.eurostat.ec.europa.eu/ statistics_explained