Abstract – This work analyses the effects of trade and exchange poli-cies adopted in the first stage of Real Plan on some macroeconomic indicators and the production of some sectors of the Brazilian agribusiness. Using a Computable General Equilibrium (CGE) model, measures of economic policy were simulated and the results obtained were compared to the reference situation. It was verified that, in gen-eral, the agribusiness sectors benefited from the reduction of import taxes and from the exchange devaluation, which occurred after the implementation of the Real Plan in 1994.
Key words: Macroeconomic Stabilization, Real Plan, Agribusiness, Computable General Equilibrium.
1. Introduction
After a period of relatively closed economy and high taxes of inflation, Brazil, since the 90‘s, entered in a stage of trade entrance and macroeconomic stabilization.In this period, the importation av-erage tax diminished expressively and, in 1994, it was implemented the Real Plan, which was attended by an exchange control policy with strong appreciation of domestic money. In the first stage of Real Plan, though it happened a nominal devaluation of almost 20%, the domes-tic money remained up-valorized and the exchange adjustment hap-pened with a change in the beginning of 1999, when the country adopted the flexible exchange system.
In relation to the entrance, Pinheiro et al. (2001) affirm that,
POLICIES OF THE REAL PLAN AND ITS
EFECTS ON BRAZILIAN AGRIBUSINESS
Adelar Fochezatto1
1 PPGE/PUCRS. E-mail: [email protected]
in the 1988 to 1995 period, the average tax on importation dimin-ished from 51% to 12%, the majority of non-tributary barrier was eliminated and the market reserve to the computer sectors was over. The trade liberation caused a raising on the country integration to the world economy and stimulated the technological modernization and the productivity.According to Muendler (2001), the incentive of concurrency and the ease of access to the foreign capital stimu-lated the domestic producers to raise its capacity of competition. The result of it was a relative rising of economy resources allocated to the trade operationsectors.
In 1994, Brazil began to implement a program of macroeco-nomic stabilization. In order to control the prices, the Real Plan used specially the following measures of economical policy: exchange tax control, money offer control and basic interest tax control. The com-bination that was in force during the first stage of Real Plan was the appreciated exchange, monetary restriction and interest tax relatively high, arousing the price down, the raise of importation and the raising of public deficit. The reduction of inflation, by its side, raised the domestic aggregated demand and became possible, somehow, the sub-stitution of importation and the rising of exportations.
So, the stabilization had favorable impacts on some produc-tive sectors and unfavorable on others. In relaproduc-tive terms, it can be asserted that the more benefited were the sectors: a) more dependent of imported inputs, b) with more substitution elasticity of domestic inputs by imported ones, c) with less substitution elasticity of the do-mestic final product by the imported one, and d) with the production running specially toward domestic market.
its productive structure, so any economical policy change will cause to it a group of favorable and/or unfavorable impacts
The central goal of this work is to analyze the effects of im-portation taxes reduction and of exchange tax devaluation occurred during the first stage of the Real Plan, on some macroeconomics indi-cators and the development of some sectors that compose the agribusiness2. The analysis will allow the identification of who won and who lost, in terms of sector production, with the Real Plan stabi-lization process.
It was used a model of Brazilian economy multi-sector con-sistence to do such analysis. This model catches the inner-dependence that exists between the agents and markets. In this model exist, in an explicitly way, the relations of input-outputbetween the productive sectors and between the revenue generation process beside the offer with the use of the same beside the product demand. For this kind of studies, this approaching is the more adequate because it becomes possible to check the liquid balance of lots of effects that each sector suffer when changes the economical policy.
2 Model General Characteristics
The Brazilian experience with these models began in the 70‘s and the formulations worried specially with the question of revenue distribution. Later the focus changed to analysis of the external sec-tor, because of the problems related to balance of payment oscilla-tion. Since the first 80‘s half, the models started to be worried with questions linked to the macroeconomics instability. The major part of the more recent models followed the standard model of the World Bank developed by Dervis, de Melo and Robinson (1982)3.
2 There is no precise definition of the input-outputmatrix sectors that compose the
Brazil-ian agribusiness. In this work, the term “agribusiness” is used to simplify the exposition and it concerns the following sectors: Farming, Vegetable products benefit, Animal slaugh-ter, Dairy products industry, Vegetable oils manufacturing and Other food industries. 3 An excellent literature review about Computable General Equilibrium models can be
The computable general equilibrium model used in this work appreciatesfour economic agents: consumers, producers, government and the rest of the world.The consumers were non-aggregated in three groups of families: rural, urban employee (that receives a salary) and urban capitalist. The producers were fragmented in twelve sectors: Farming, Machines and equipment, Automobiles, buses and trucks, Chemistry industry, Shoes production, Vegetable products benefit, Animal slaughter, Dairy products industry, Vegetable oils production, Other food industries, and Trade and services. Though relatively ag-gregated, this configuration catch the main channels through the eco-nomical changes influence the economy. That’s why it can be asserted that this configuration is the chosen one in order to achieve the work general goal, that is, to analyze the impacts of exchange and trade policies on economic activities, families revenue, and production of some sectors of the Brazilian agribusiness.
Even so the agents behavior is in agreement with the neo-classic theory, the model shows keynesian and structuralist character-istics: here is no full use of the work force, the salary is not flexible and the values of the substitution elasticity of the factors and products are relatively low. These stiffness sources cause a higher realism to the model. This is necessary because in Brazil it can be observed pretty high unemployment figures, the minimum salary is defined by the government, the flexibility in the productive processes is not perfect, and there are unsymmetrical information about the quality and prices of the products.
The model is recursive dynamical and the model solution in each period depends on the variable values in the same period and out of them. With this, it can be analyzed the adjustment path of the inner variables to the new economy balance after the economic policy change. Thus, in relation to this general balance model, the results founded in the simulations represent consistentalternative situations, which are compared with the referral situation, without political changes.
reader a general idea about the model structure and about the casual mechanisms that exist inside it. The mathematical model can be found in Fochezatto (1999)4.
2.1 Price definition
The international prices converted by exchange tax and im-portation taxes added determine the imported product prices, expressed in domestic money. The exported products prices, expressed in do-mestic money, are determined by the international prices converted by the exchange tax and discounted from the exportation taxes.
A possibility of imperfect substitution between the internal and external tradable goods is assumed to exist. They can be aggre-gated by a SCE function in order to obtain a compound product (ag-gregation between the domestic product and the imported one). The price of this compound product is a ponderous average between the domestic good’s price and the imported good’s price, expressed in domestic money. Besides the family’s consumption, the compound product still goes to the production activities intermediate consump-tion, to the government consumption and to the gross formation of fixed capital.
The liquid price is the domestic production sale in the internal market. It is equal to the market price minus the indirect taxes. Fi-nally, the prices general level, which was chosen as numeraire, is a price general index that belongs to the Paasche kind.
2.2 Goods production and work demand
The production of each sector is represented by a structure of several levels. In the last level, the gross production function is an aggregation of Leontief kind of intermediate consumption and added value. The sectors intermediate consumption occurs in fixed
propor-4 The model presents about 500 equations; it was programmed and solved using the
tions and the added value is produced using money and work, com-bined by a function with substitution constant elasticity (SCE).
The work demand is derived from the enterprise profit maxi-mization process, under the technological restriction given by the production function SCE. With this, the demand given by the work factor is function of the product liquid price (or of the added value). As this is a short-term analysis, the capital factor was considered fixed.
2.3 Family and Government Consumption
The family’s consumption demand to the products of each sector is derived from a utility function of Stone-Geardy kind. It de-pends on the minimum consumption of each product, the total sumption of each families group, the marginal propensity to be con-sumed, and the concurrent prices. The demand functions are derived from the maximization of this utility function, under the consumer budgetary restriction, resulting in a Linear Expenditure System (LES) which, to each families group, the consumption of a specific product is function of its revenue and of prices.
The Government expenditures in the product purchase are distributed between the different sectors in fixed proportions. The prod-uct participation of each sector in relation to the expenditures of the Government is gauged according to the distribution that is in the base year or in the social accounting matrix.
2.4 Investment and savings
(in-cluding the enterprises savings), b) government savings, and c) exter-nal savings (current transactions deficit).
2.5 Domestic sales, exportation and importation
According to Melo (1988), the external sector representation based on the supposition that the domestic production is the perfect substitute of the external products, it is not the more appropriated. According to Devarajan et al. (1990), the changes in the importation and exportation prices are just partially transmitted to the domestic goods prices. In the same way, the domestic and the external market represent imperfect transformation possibilities, reflecting the diffi-culties of the production destiny alteration.
So, the major part of general equilibrium models uses the Armington‘s hypothesis (1969), that suppose the imperfect situation5 between products of different geographic origins and the outer growth of the international prices (small country). Examples of works that prac-tice it are founded in Decaluwe and Martens (1988), Melo (1988), Melo and Robinson (1989). Devarajan et al. (1990) and Lofgren et al. (2001). The main advantages of this modeling are: a) it allows that simultaneous trade of products of the same sector exists between coun-tries, fact that can be observed empirically given that the products are imperfect substitutes; b) it avoids extreme specialization in econo-mies, considering that the countries have tendency to produce some amount in all products groups; and c) it becomes possible to define different degrees of substitution to the products, also allowing differ-ences in product prices for different countries. This approaching is very used by being the best representation of the agents behavior in open and developing economies
The domestic production goes to the internal and/or external market, and products of inner production and/or imported ones sup-ply the domestic demand. The exportations offer and the importation demand come from, respectively, the enterprises behavior in relation
5 The term “imperfect substitution” is used to refer to the external relationship of
to the destiny’s choice of this production and the enterprises, families and government behavior in relation to the choice between domestic products and the imported ones.
The products offer to the exportation is represented by a func-tion with transformafunc-tion constant elasticity (TCE). This kind of pro-duction modeling supposes that the domestic sales and exportations, to products of the same sector, represent products of different quality. The exportation proportion of a product is derived from the producer revenue maximization, restricted to the TCE transformation function: the resolution of this problem defines the optimal combination be-tween the possible destinies to the production, which depends on the relative prices and on the transformation elasticity.
The products of inner market are composed of goods produced in an inner way and imported ones, which are supposedly an aggrega-tion of SCE kind. Given the imported and domestic product prices, the consumer’s problem is to acquire a certain amount of products with a minimum expense. The optimal proportion of domestic and imported goods depends on the relative prices and on the substitution elasticity and result from the minimization problem solution of the consumption charge, restricted to the SCE aggregation function.
The inner demand to the domestic products is defined by “do-mestic use fraction” of production. This proportion of the do“do-mestic production that goes to the inner market is an inner variable and de-pends on the relative prices of the domestic products and the substi-tutes imported ones.
2.6 Equilibrium conditions
bud-get. The revenues and expenses happen in an independent way and nothing can guarantee that equilibrium occur.
There is no equilibrium in the work market. It means a con-sistent macroeconomic closure with the definition of the economy average salary, which is indexed to the general prices index. As the work offer is exogenous and the demand is endogenous, given by producers in theirs productive processes, there is a possibility to hap-pen involuntary unemployment. In this way, like the economy is not necessarily operating on the production possibility frontier, the eco-nomical policies can provoke real growth.
2.7 Inter-temporary relations
The capital stock diminishes because it suffers erosion by de-preciation and rises due the new investment in fixed capital. The in-ner-timeaspect of this variable is in the circular relationship that ex-ists between the production, investment and accumulation of capital. Certain products, with useful life to many years, are incorporated via investments to the productive process, transforming itself into an in-crement of present and future production capability.
The average salary, indexed to the general prices index, is readjusted in each period by the inflation index of the prior period. The employ offer is exogenous and in each period is added by the work force that becomes inactive, and is reduced by the work force that becomes inactive.6
2.8 Calibration
The information sources to construct a Social Accounting Matrix (SAM) for the year 19947, model basis year, were the
Input-6 It is considered the work offer like being the economically active population (EAP), and
the growth tax of the work force offer like being the growth tax of EAP. So, there is no involuntary unemployment.
7 The year of 1994 was chosen like basis year because it represents the beginning of Real
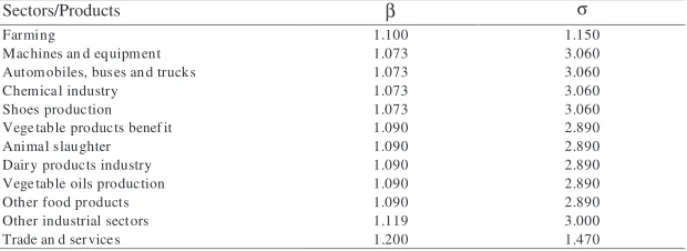
OutputMatrix and the National Accounts in 1994, both from IBGE. Starting from SAM, through the calibrationmethod, there were deter-mined the values of the majority of the model’s parameters. However, what is common in this kind of modeling, the values of some param-eterswere obtained from other works. The substitution elasticity be-tween capital and work in the SCE production function, and the sub-stitution elasticity between domestic and imported products in the Armington‘s SCE function were obtained from Mercenier and Souza (1994). These values are seen in Table 1. The model vigor is availed through a sensibility analysis, which was done to verify the results variability for different values of these parameters.
The biggest difficulty faced in the model construction is re-lated to the lack of existence of consistent and compatible data to the model basis year, in order to calibratethe parameters. Thus, there was necessity to construct a social accounting matrix. The procedure of parameter calibrationis one of the deficiencies of these kind of model because the parameter values are obtained from information of just a year. But, theeconometricestimation, theoretically more satisfactory than the calibration, presents lots of difficulties. The main one occurs from the big number of parameters used in the models, and from the difficulty to find a series of trusting data to estimate all of them.
Table 1 – Values of parameters obtained from other sources
Sectors/Products β σ
Farming
Machines an d equipm ent Autom obiles, buses an d trucks Chemica l industry
Shoes production Vege table products benef it Animal slaughter Dair y products industry Vege table oils production Other food products Other industrial sect ors Trade an d ser vice s
1.100 1.073 1.073 1.073 1.073 1.090 1.090 1.090 1.090 1.090 1.119 1.200 1.150 3.060 3.060 3.060 3.060 2.890 2.890 2.890 2.890 2.890 3.000 1.470
Source: MERCENIER, J. e SOUZA, M.C.S. (1994).
3 Results Analysis
It was made an analysis that compares the effects of each simu-lated policy on the interested variables in the referral solution, and the model produced this solution after the parameter calibration. It repro-duced the matrix values of social accounting and represents the economy behavior, without any politics change. The impacts of each policy are computed by the ratio between the alternative solution, in presence of economical policy shock, and the referral solution.
It was simulated three policy options: a) essay 1 (A): devalu-ation of 20% of nominal exchange tax, b) essay 2 (B): uniform reduc-tion of importareduc-tion taxes in 50%, and c) essay 3 (C): exchange de-valuation of 20% and reduction of 50% in importation taxes.
The agribusiness sectors analyzed are the following: Farming, Shoes production, Vegetable products benefit, Animal slaughter, Dairy products industry, Vegetable oils production, and Other food products. The other economical sectors that exist in the model are Machines and equipment, Automobiles, buses and trucks, Chemical industry, Other in-dustrial sectors, and Trade and Services. As the work goal is to analyze the impacts of trade and exchange policies adopted in the first stage of Real Plan on the agribusiness, the political options that were simulated tried to reproduce the behavior of the same ones inside that period.
3.1 Macroeconomic performance
a) Empirical theory and evidences
The model of development by importation substitution pre-sents adverse effects on the long-term economy. According to Bruton (1989), the results of this strategy are the formation of an industrial structure very dependent of intermediate products and imported capi-tal goods, low exportations growth, recurrent difficulties in the bal-ance of payments and strong allocated distortions.
a development strategy more integrated with the rest of the world, through the adoption of more liberal commercial policies. The gov-ernment begun to reduce importation taxes and to adopt another mea-sures, like the public enterprise privatization and the reduction of in-centives, in order to adjust the relative prices and improve the economy’s efficiency.
In short-term, the economy opening impact depends on the intern productive structure dependence degree of inputs and im-ported capital goods and of substitution elasticity of domestic fi-nal products by imported ones. If economy is highly dependent, the liberation must stimulate a production costs reduction and, consequently, a greater competition activity of the domestic final products. In this case, the liberation can have a positive effect on domestic production and provoke an exportation and/or substitu-tion importasubstitu-tion’s rise.
Although the more important consequences of a commercial reform happen on the location of economy resources in long-term, it links in many aspects with other short-term macroeconomics poli-cies. The adoption of a determined commercial policy can influence product and employ such a way that it can disable the utilization of another short-term adjusts instruments.
A great part of the empirical studies to developing countries shows that commercial reforms that promoted a greater economy open-ing provoked too a rise of inner products and employ duropen-ing the re-form process, and especially after the same8. The commercial balance raised in the most cases either, showing that the exportations growth compensate very much the importation rise.
The commercial policies, however, are very linked to exchange policies. It is so real that the economy opening, joined to exchange tax depreciation, can lead to an opposite effect, because of the per-verse effects of the rise in inputsrelative prices, and in imported capi-tal goods.
There is necessity to consider some items to better under-stand how these different adjustment mechanisms influence the
economy structures. First, an adjustment via exchange tax devalua-tion is symmetrical because it affects, in inverse way, the exporta-tion and importaexporta-tion of each sector. Second, an adjustment via im-portation taxes is unsymmetrical because the prices of imim-portation, in domestic money, are directly affected by taxes changes, while the exportation prices can be influenced just indirectly through the pro-duction costs.
Exchange devaluation has similar effects to a tax increase, by importation side, raising the domestic economy protection. Ac-cording to Agenor and Montiel (2000), the analysis of these poli-cies reveal that GDP of developing countries normally fall and the inflation rises, with an exchange devaluation, so as with an impor-tation taxes rise. These effects are greater the smaller the offer prices elasticity and the substitution elasticity of domestic prod-ucts by imported ones.
In relation to offer, if price elasticity is low, the intern produc-tion of substitute products will be short. In relaproduc-tion to demand, if the domestic consumers resist substituting imported products by domes-tic ones, the inflation tax tends to be greater, due to the increase of production costs from devaluation and/or taxes increase.
b) Results found in this work
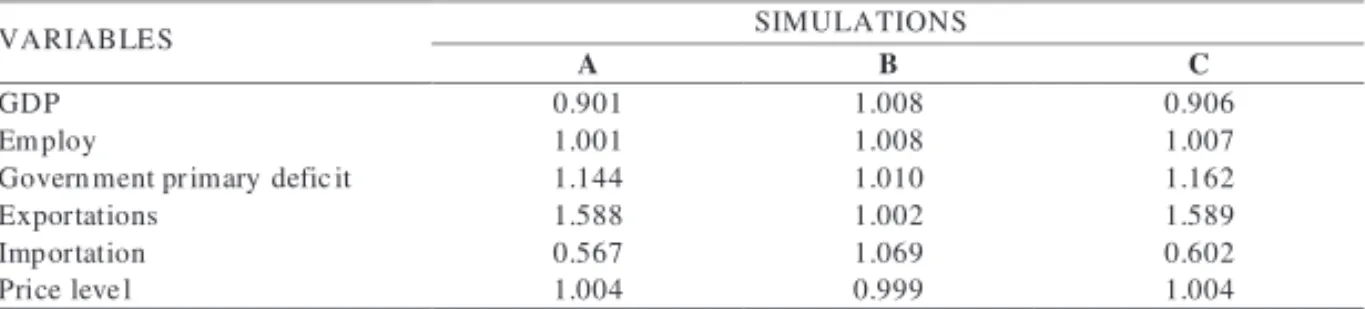
Table 2 (column A) shows that exchange devaluation provoke a GDP decrease and, consequently, a government primary deficit rise. In addition, given the imported inputcountry’s dependence, the de-valuation stimulated a general price index rise. The positive aspects of this policy were exportations rise, commercial balance and employ rise. It occurs because, in general, the exported sectors are relatively more intensive in the use of the work factor.
than the exportations. In relation to the public deficit, the tendency is to happen a reversion in long and middle terms because of the posi-tive impact from the GDP increase. These results also show the Bra-zilian economy dependence of inputsand imported capital goods.
Table 2 (column C) shows that a combination of opening policy and exchange devaluation provokes a GDP reduction, and govern-ment primary deficit and inflation rise, although it stimulate positive effects on employ and commercial balance
Table 2 – Results from simulations on some selected macroeco-nomic variables.
PS.: The table’s values show the simulation effect over each variable in relation to the values of the same in the basis year (value obtained from the simulation/ value in the basis year). A = exchange devaluation of 20%; B = reduction of 50% in importation taxes; C = exchange devaluation of 20% and reduction of 50% in importation taxes.
b) Effects over families revenue
Table 3 shows that the economy opening (column B) provokes revenue improvements in all families groups while the effects of ex-change devaluation (column A) and of conjugation of the two poli-cies (column C) stimulate the revenue reduction in all groups. In policy combination, the revenues raise due to economy opening were more than compensated by the losses from devaluation.
These results come especially from price behavior inside each of these policies: when the prices general index reduction happened, the families revenue raised, so as the opposite situation.Besides the prices, other factors, like the alteration of sectorial production
com-SIMULATIONS VARIABLES
A B C
GDP Em ploy
Govern ment pr imary defic it Exportations
Imp ortation Price leve l
0.901 1.001 1.144 1.588 0.567 1.004
1.008 1.008 1.010 1.002 1.069 0.999
position and the behavior of GDP and job, influenced the revenue distribution between the families9.
Table 3 – Results from simulations about family’s revenue.
PS.: The table’s values show the simulation effect about each variable in rela-tion to the values of the same in the basis year (value obtained with the simula-tion/value in the basis year). A = exchange devaluation of 20%; B = reduction of 50% in importation taxes; and C = exchange devaluation of 20% and reduc-tion of 50% in importareduc-tion taxes.
3.2 Sectorial performance
a) Theory and empirical evidences
The sector production is an answer to the liquid prices and these vary with the commercial policies. In the commercial policies context, the liquid prices change is determined by the dependence degree of each sector on imported intermediate inputs. Through this, the more dependent importation sectors have its relative position im-proved when the taxes and/or exchange valorization reduction oc-curs, because they are benefited by the cost reduction. This effect is invert when taxes and/or exchange devaluation rises happen, other-wise, the sector gain will depend on the consumer’s substitution elas-ticity between domestic and imported products, because it determines how much from the reduction or rise costs and from prices is con-verted in rise or reduction of the product demand10.
SIMULATIONS FAMILIES
A B C
Rural
Urba n rece iving salary Urba n ca pitalists
0.980 0.982 0.982
1.006 1.006 1.007
0.984 0.986 0.987
9The basis social accounting matrix was built in order to the rural families receive all capital
revenue of the farming sector and the urban capitalist receive from other sectors. The urban salary receiving families receive the work revenues from the non-agricultural sectors. 10 In a normal way, the liquid prices and the sectorial production vary in the same way, but
Inside a commercial reform context, it can be underlined four mechanisms in the domestic sectorial prices determination. First, in case of a tax reduction, the domestic prices tend to diminish more in the sectors that produce almost perfect substitute products to the im-ported ones. In other words, the prices diminish the greater is the sub-stitution elasticity between imported and domestic products. It hap-pens because any differential to up in domestic substitute’s price will reduce its demand and, consequently, reduce the price, given a fall in imported products price.
Second, if the participation of competitive importation in the inner offer of sector is low and the participation of exportation in the sector production is high, the product’s price tend to rise. It occurs because this sector can bargain the price between the inner and the outer sales, and this same sector does not suffer the competitionof the imported in the inner market.
Third, sectors that presents a low offer elasticity tend to have a greater price rise, in case of a substitute products taxes rise. It will occur because an excessive demand to its product happened if it is essential (low price elasticity). The offer elasticity, itself, depends on the substitution elasticity between capital and work and on the inten-sity of work factor in the production process. As big as the substitu-tion elasticity and the participasubstitu-tion of work producsubstitu-tion are, the bigger will be the offer elasticity. According to this, an importation taxes rise can lead the intensive sectors in work to benefit in relative terms.
Fourth, as low as the price elasticity of product demand, the more the price tend to rise in case of taxes rise over substitutes im-ported ones. The sectors that produce these products can pass again all inflation stimulated by the taxes rise, without implicate the de-manded quality very much. This is the case of essential products.
Thus, the sectors with greater potential of prices rise in case of a rise in importation taxes and/or in case of an exchange devalua-tion are the ones that present one or more of the following character-istics: high substitution elasticity of the imported product by the
mestic one, high coefficient of competitive importation and/or high coefficient of product exportation, low offer elasticity, and low demand’s price elasticity.
b) Results found in this work
Table 4 (column A) shows that, except the Dairy products industry, all other sectors of the agribusiness sectors were benefited with the exchange devaluation. The sectors that had the bigger im-pacts on production were the ones towards to the exportation, like Production of vegetable oils, Production of shoes and Vegetable prod-ucts benefit.
The weak performance of some sectors of agribusiness, spe-cially the Dairy products industry, was due to one or more of the fol-lowing factors: high dependency of imported input, low offer price elasticity, and low substitution elasticity of imported products by the domestic substitutes. In addition, the not tradable, like the services, were impaired by the reduction of economy’s activity level. Accord-ing to Dervis, de Melo and Robinson (1982), the not tradable sectors and the outer inputdependent sectors are highly impaired by policies that rise the imported prices and, when it occurs, normally, they have their position damaged in the productive structure. These same fac-tors, with an opposite behavior, can be used to justify the positive performance of the most of agribusiness sectors.
Table 4 – Results from simulations over the added value of the productive sectors.
SIMULATIONS SECTORS
A B C
Farming
Machines an d Trac tors Autom obiles, Buses a nd Truc ks Chemica l Industry
Shoes Production Vege table Products B enef it Animal Slaughter Dair y Products Industry Vege table Oil Production Other Food Industries Other Industrie s Trade an d S erv ices
1.023 0.793 0.849 1.151 1.574 1.310 1.175 0.998 3.213 1.031 0.937 0.998 1.013 0.999 0.939 0.979 0.994 1.004 1.013 1.002 1.006 1.004 1.002 1.005 1.032 0.793 0.802 1.131 1.562 1.313 1.186 1.000 3.211 1.034 0,938 1,002
P.S.: The table values show the simulation effect over each variable in relation to the value of the same in the basis year (value obtained from the simulation/ value in the basis year). A = exchange devaluation of 20%; B = reduction of 50% in importation taxes; and C = exchange devaluation of 20% and reduction of 50% in importation taxes.
Observing the exchange devaluation results (column A), a protectionism policy, and the taxes reduction (column B), it can be identified the most dependent imported inputsectors and those, which benefit from the commercial opening. They are Machines and trucks production, Automobiles industry and Dairy products industry. The Services segment, considering a not tradable sector, benefit itself from the rise of domestic economical activity.
The combination of the two policies, Table 4 (column C), was positive to the majority of the agribusiness sectors: Farming, Vegetable products benefit, Animal slaughter and Other food industries. It shows that these values benefit more when occurs a bigger opening of economy combined with a favorable exchange policy to the exportations.
According to the authors, in the 90‘s happened a rise of fertilizer consumption, a rise of commercialized value of defensives, an in-crease of farming productivity and an improvement of the farming change terms.
In other work, Campos e Paula (2002) analyzed the evolution of Brazilian farming in the 90‘s and concluded it has presented an and medium income production growth in the majority of farming prod-ucts, to exportation so as to domestic market. According to the au-thors, the main determinants of the production increase were the pro-ductivity raise and the improvement of the relative prices. The cattle raising production grew more than the agricultural one, stimulated by the per capita consumption increase and by the improvement of the sector relative prices.
4 Conclusions
The simulations results showed that exchange devaluation caused GDP retaining, public finances deterioration, price general level increase and, consequently, families real revenue reduction, because of the dependence on the Brazilian economy for inputs and imported capital goods, even so it has stimulated the exportations. But, in sec-torial production terms, the majority of the agribusiness sectors, by being exporters, were benefited from this policy. Even so the GDP has diminished, the good relative performance of exporter sectors, which, in general, are more intensive in the work factor use, reflected positively over employ.
The agribusiness sectors were also benefited with the com-mercial opening, what can be observed in the raising of its produc-tion. The good performance of these sectors happened specially be-cause the raising of its competitiveness, due to imported inputs prices reduction, and because the raising of inner demand, due to families revenue raising.
In aggregated terms, the combination of the two policies had as favorable results the raising of commercial scale and employ. The nega-tive aspects were in charged by the GDP reduction, government pri-mary deficit rising, general level of prices rising and family’s real rev-enue reduction. In relation to the sectorial production, like the agribusiness sectors were benefited with each one of the policies in detachment, these sectors were favored with the policies combination. The general conclusion of this work is that the commercial and exchange policies, that were fundamental to the macroeconomic stabilization process in the first stage of Real Plan, had very favorable impacts over the majority of sectors that compose the Brazilian agribusiness.
In future works we suggest some improvements. It could be enclosed a greater number of production sectors, specially those linked to the agribusiness. Also, it could be non-aggregated a greater num-ber of families groups, classifying them by revenue levels. And, fi-nally, the model could be a multi-regional model, dividing it in under-national regions (States), allowing analyzing the aggregated and re-gional impacts of the simulated policies.
References
AÉNOR, P.R. e MONTIEL, P.J. La macroeconomía del desarrollo. Fondo de Cultura Económica, 2000.
ARMINGTON, P. A theory of demand for products distinguished by place of production. IMF Staff Papers, v.16, p.159-78, 1969.
CAMPOS, A.C. e PAULA, N. A evolução da agropecuária brasileira nos anos 90. Indicadores Econômicos FEE, Porto Alegre, v.29, n.4, p.307-341, fev. 2002.
CASTILHO, M.R. Algumas considerações sobre o uso de modelos computáveis de equilíbrio geral como instrumento de análise do setor externo brasileiro. Rio de Janeiro, Funcex, 1994.
DECALUWÉ, B.; MARTENS, A. CGE modeling and developing economies: a concise empirical survey of 73 applications to 26 coun-tries. Journal of Policy Modeling, v.10, n.4, p.529-568, 1988. DERVIS, K.; de MELO, J. and ROBINSON, S. General equilibrium models for development policy. Cambridge: Cambridge University Press, 1982.
DEVARAJAN, S.; LEWIS, J.D.; ROBINSON, S. Policy lessons from trade-focused, two-sector models. Journal of Policy Modeling, v.12, n.4, p.625-657, 1990.
FOCHEZATTO, A. Estabilização, ajuste estrutural e eqüidade no Brasil: uma análise contrafactual com um modelo de EGA - 1994/97. Porto Alegre: PPGE/UFRGS, 1999. (Tese de doutorado)
GUILHOTO, J.J.M. A experiência brasileira com modelos computáveis de equilíbrio geral. Rio de Janeiro: IEI/UFRJ, 1988. (Texto para Discussão, n. 175)
HELFAND, S.M.; REZENDE, G.C. Brazilian agriculture in the 1990s: impact of the policy reforms. Rio de Janeiro: IPEA, 2001. 39p. (Texto para a Discussão, 785)
LÖFGREN, H.; HARRIS, R.L.; ROBINSON, S. A standard comput-able equilibrium (CGE) model in GAMS. Washington: International Food Policy Research Institute, Trade and Macroeconomics Division, 2001. 80p. (TMD Discussion Paper, 75)
MELO, J. Computable general equilibrium models for trade policy analysis in developing countries: a survey. Journal of Policy Model-ing, v.10, n.4, p.469-503, 1988.
MERCENIER, J.; SOUZA, M.C.S. Structural adjustment and growth in a highly indebted market economy: Brazil. In: MERCENIER, J. and SRINIVASAN, T.N. Applied general equilibrium and economic development: present achievements and future trends. Ann Arbor: University of Michigan Press, 1994.
MUENDLER, M. Trade, technology, and productivity: a study of Brazilian manufacturers, 1986-1998. Berkeley: University of Cali-fornia, 2001.
PINHEIRO, A. C.; GIAMBIAGI, F. e MOREIRA, M. M. O Brasil na década de 90: uma transição bem-sucedida? Rio de Janeiro: BNDES, Departamento Econômico – DEPEC, 2001. 36p. (Textos para discussão, n. 91)